

ABSTRACT
Enterococcus faecalis is a common Gram-positive commensal bacterium of the metazoan gastrointestinal tract capable of biofilm formation and an opportunistic pathogen of increasing clinical concern. Dogma has held that biofilms are slow-growing structures, often taking days to form mature microcolonies. Here we report that extracellular DNA (eDNA) is an integral structural component of early E. faecalis biofilms (≤4 h postinoculation). Combining cationic dye-based biofilm matrix stabilization techniques with correlative immuno-scanning electron microscopy (SEM) and fluorescent techniques, we demonstrate that—in early E. faecalis biofilms—eDNA localizes to previously undescribed intercellular filamentous structures, as well as to thick mats of extruded extracellular matrix material. Both of these results are consistent with previous reports that early biofilms are exquisitely sensitive to exogenous DNase treatment. High-resolution SEM demonstrates a punctate labeling pattern in both structures, suggesting the presence of an additional, non-DNA constituent. Notably, the previously described fratricidal or lytic mechanism reported as the source of eDNA in older (≥24 h) E. faecalis biofilms does not appear to be at work under these conditions; extensive visual examination by SEM revealed a striking lack of lysed cells, and bulk biochemical assays also support an absence of significant lysis at these early time points. In addition, some cells demonstrated eDNA labeling localized at the septum, suggesting the possibility of DNA secretion from metabolically active cells. Overall, these data are consistent with a model in which a subpopulation of viable E. faecalis cells secrete or extrude DNA into the extracellular matrix.
IMPORTANCE
This paper reports the production of extracellular DNA during early biofilm formation in Enterococcus faecalis. The work is significant because the mechanism of eDNA (extracellular DNA) production is independent of cell lysis and the DNA is confined to well-defined structures, suggesting a novel form of DNA secretion by viable cells. Previous models of biofilm formation in enterococci and related species propose cell lysis as the mechanism of DNA release.
Introduction
The extracellular matrix of bacterial biofilms is incompletely understood. Produced by the bacteria themselves, the matrix is a highly hydrated collection of biopolymers: polysaccharides, polypeptides, lipids, and nucleic acids. While this matrix was originally dismissed as merely bacterial slime or the remnants of the glycocalyx, recent work has led to the understanding that matrix formation leads to important and structured physiological responses of biofilm communities to their environment (1). From a biomedical standpoint, bacterial cells in the biofilm state demonstrate extraordinarily elevated resistance to most clinically relevant antimicrobial agents; whether this resistance is a result of the matrix itself or a function of the large changes in gene expression as cells switch from the planktonic to biofilm modes of growth remains unclear (2).
Extracellular DNA (eDNA) was originally reported as a critical structural component of the Pseudomonas aeruginosa biofilm matrix (3); numerous Gram-negative and Gram-positive bacteria—including Enterococcus faecalis—have since been shown to use eDNA for matrix stabilization. Research to date has largely focused on several inducible autolytic mechanisms for DNA release into the extracellular milieu in which a subpopulation of biofilm cells are sacrificed for community stability. Most of these lytic models involve an active intercellular signaling system. In E. faecalis, a quorum sensing-dependent fratricidal mechanism has been demonstrated by Thomas et al. to result in bulk cell lysis by 24 h of biofilm growth (4).
A question overlooked by these bulk cell lysis models remains: if the lytic mechanisms are the source of eDNA, why do early “low-cell-density” biofilms frequently demonstrate similar or even more pronounced sensitivity to DNase? Additionally, if lytic mechanisms are key and result in bulk DNA salvage and incorporation into nascent biofilms, why are biofilm-deficient phenotypes largely resistant to rescue by the addition of exogenous DNA?
Here we report the presence of extracellular DNA in the matrix of E. faecalis biofilms at very early time points (4 h postinoculation) that displays strong localization to specific ultrastructural locations. Further, the source of this eDNA does not appear to be tied to a bulk lysis mechanism but is associated with a subpopulation of active and physiologically competent cells.
RESULTS
Ultrastructural analysis of eDNA distribution in early biofilms.
Scanning electron micrographs of early (4 h postinoculation) OG1RF E. faecalis biofilms show the presence of long, filamentous strands between cells (Fig. 1A to C). These intercellular “yarn-like” structures are of variable thickness, though they are approximately on the order of 10 to 100 nm. Filament length is also variable but with a greater range: 50-µm strands can be readily observed (Fig. 1A). The strands contain a high proportion of extracellular DNA (eDNA), labeling strongly and specifically with an anti-dsDNA monoclonal antibody–colloidal gold probe (Fig. 1C and D). In addition to the intercellular yarn structures, significant anti-dsDNA antibody labeling can also be visualized in the thick, “sweater-like” mats of extracellular matrix (ECM) material that begin to envelop E. faecalis cells in the nascent stages of biofilm microcolony development (Fig. 2A and B). Closer examination of the ECM (Fig. 2C) demonstrates the complex structural arrangement of eDNA in the matrix, along with fine fibrillar material on the surface of some cells (Fig. 1C and 2B, lower left) that do not contain eDNA accessible to antibody labeling.
FIG 1 .

(A and B) Long intercellular strands (yarn structures) visible in early (4-h) E. faecalis biofilms (arrows) Bar, 5 µm. (C) Strong punctate labeling of the strands visualized by using an anti-dsDNA monoclonal antibody conjugated to an immunogold particle (asterisks). The image shows the significant eDNA component (the central area is magnified in panel D). Bar, 250 nm. (E) Surface morphology can be appreciated in the corresponding secondary electron image. Bar, 1 µm.
FIG 2 .

Thick enveloping mats of extracellular matrix (sweater structure) make up a large fraction of the E. faecalis biofilm (A, secondary electron image) and contain significant eDNA, as shown via immunogold labeling of the anti-dsDNA monoclonal antibody (B, backscatter image of the same field). Bars, 1 µm. (C) False-color SEM image showing the relationship between the surface of the ECM (red; secondary electron detector) and the immunogold-labeled anti-dsDNA antibody (green; backscatter detector). eDNA appears to be encased within another ECM component (arrows). Bar, 500 nm.
Matched planktonic controls failed to demonstrate labeling with the anti-dsDNA antibody (see Fig. S1A in the supplemental material), and substitution of an irrelevant primary antibody or elimination of the primary antibody also led to no labeling of matched biofilm samples (see Fig. S1B). A well-characterized E. faecalis clinical isolate (V583) produced eDNA labeling patterns comparable to those of OG1RF (see Fig. S1C), indicating that this phenomenon is not limited to the lab strain.
Finally, in a small number of nascent biofilm microcolonies, we have been able to visualize cells in which eDNA localization appears immediately adjacent to the enterococcal septum (Fig. 3A and B). In some cases, this signal is small, with only a few probe molecules visible (Fig. 3A). In others, the eDNA signal near the septum is much more robust (Fig. 3B) and contiguous with yarn and sweater structures. Lysed cells were virtually undetectable in adherent cells examined for ≤8 h of biofilm growth, whereas older biofilms contained readily detectable lysed cells (Fig. 3C); the associated released cytoplasmic contents adjacent to lysed cells were labeled with the antibody but had an appearance distinct from that of the sweater and yarn structures.
FIG 3 .

(A and B) Immuno-SEM micrographs demonstrating localization of the eDNA probe near the E. faecalis septum. (C) Endogenous lysis of cells in an older (48-h) biofilm display an entirely different morphology from that seen in early biofilms, as DNA (asterisks) is released from a ruptured cell (arrow). Bars, 500 nm.
Correlative microscopy reveals structures analogous to those observed by SEM.
To ensure that the structures seen by SEM were not an artifact of the harsh chemical and physical treatment necessary for traditional electron microscopy sample preparation, we used matched samples under wide-field immunofluorescent (IF) illumination. With the same anti-dsDNA primary antibody but a green fluorescent protein-conjugated secondary antibody, structures strikingly similar to the yarn and sweater structures can been seen: long intercellular filaments (Fig. 4A and C) and locally diffuse pericellular labeling visible immediately adjacent to a subpopulation of E. faecalis cells (Fig. 4B and C). Since structures analogous to the immuno-SEM ultrastructural analysis can be seen in these minimally manipulated and fully hydrated IF samples, we suggest that the SEM sample processing reported here has a minimal effect on the morphology of the extracellular matrix. To further verify this structural equality, unprocessed immunolabeled samples were plunge frozen in liquid ethane and examined by cryo-SEM to further test the hypothesis that complex ECM morphology is independent of traditional SEM sample preparation: both yarn and sweater structures are clearly labeled with the anti-dsDNA probe (see Fig. S1D) in the fully hydrated state.
FIG 4 .

Correlative microscopy. Though imaged using different microscopic techniques, both the SEM (A and B; bars, 500 nm) and immunofluorescent micrographs (C) show similar patterns of eDNA labeling in early E. faecalis biofilms—long intercellular strands (yarn structures [asterisks]) as well as a pericellular labeling component of the sweater matrix (Δ) (C; bar, 25 µm). Monoclonal antibody labeling of extracellular dsDNA (green, DyLight 488; blue, Hoechst 33342 highlighting individual E. faecalis cells) is shown.
Biochemical assays shows no elevation in bulk cell lysis.
To rule out the simple possibility that early bulk cell lysis was the source of eDNA in the extracellular matrix, we looked for elevated levels of two intracellular compounds of central bacterial metabolism: ATP and glucose-6-phosphate dehydrogenase (G6PD). Compared to matched planktonic controls, biofilm samples showed no increase in the extracellular concentrations of ATP (Fig. 5A) or G6PD (data not shown), suggesting that bulk lysis does not play a role in early E. faecalis biofilm eDNA levels.
FIG 5 .
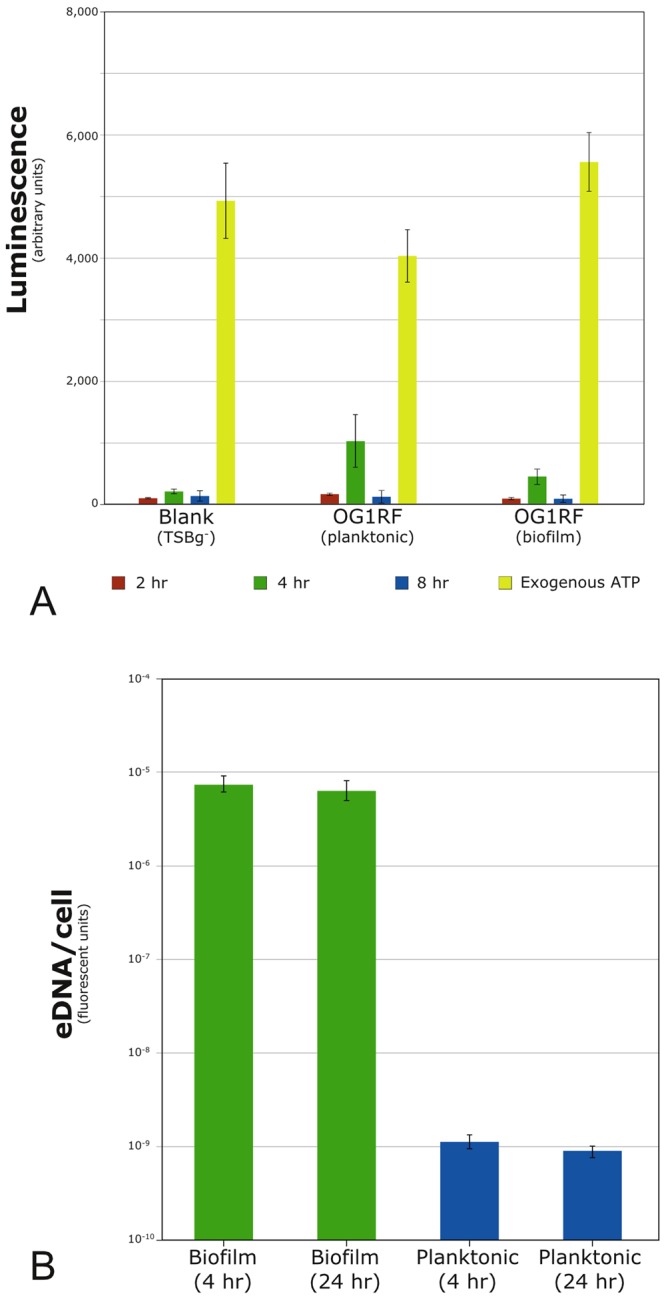
Biochemical assays. (A) Luciferase-based quantification of extracellular ATP. No significant differences were found between biofilm and planktonic levels at 2, 4, or 8 h postinoculation in matched E. faecalis samples. Results are averages from four independent experiments. Only the values for the 4-h OG1RF samples (planktonic and biofilm) are above the instrument background; neither rose to statistical significance. (B) The cell-impermeant fluorescent dye Sytox green (Invitrogen) was used to label nucleic acids outside functional cells. eDNA levels were >103-fold higher under biofilm conditions than in matched planktonic controls. Exogenous lysis of a small fraction of cells (~5% by microscopy) produced a luciferase signal that saturated the instrument detector under the displayed conditions (not shown). Error bars indicate 1 SD.
Cells associated with eDNA have an active membrane potential.
The fluorescent dye DiOC2 (3,3′-diethyloxacarbocyanine iodide) crosses cell membranes and labels all cells green. Cells with a nonzero membrane potential (ΔΨ) preferentially accumulate the dye: at these higher concentrations the dye molecules aggregate and lead to the appearance of a second, red fluorescent signal. Metabolically active cells display both green and red fluorescence. Combining the anti-dsDNA antibody with DiOC2 labeling, we examined the relationship between cell viability and localization of eDNA, specifically, whether eDNA is associated with cells displaying a lowered membrane potential. An unfixed 4-h E. faecalis biofilm cultured as described above was labeled with the anti-dsDNA antibody and treated with DiOC2. All cells displayed green fluorescence (Fig. 6A) and have an active—though variable—signal in the red channel (Fig. 6B). The dsDNA antibody was conjugated to a blue fluorophore (Fig. 6C) and labeled the same yarn and sweater structures noted above (Fig. 4). An overlay of the red (cells with an active membrane potential) and blue (dsDNA) channels (Fig. 6D and E) illustrates that a significant fraction of eDNA labeling is spatially associated with cells displaying a higher membrane potential. In some regions, these cells showed red channel fluorescence up to 26% above the median DiOC2 red-green ratio. Finally, of the group of highest-intensity signals from the dsDNA probe (Fig. 6C), 19 of 21 occurred within 0.7 µm of cells displaying elevated DiOC2 red-green ratios; the two outliers were within 1.05 µm.
FIG 6 .

Elevated membrane potentials occur in a subpopulation of biofilm cells and are correlated with significant eDNA appearance. DiOC2 crosses the cell membrane, nonspecifically labeling all cells green (A). Cells with a nonzero membrane potential (ΔΨ) preferentially accumulate the dye, which, at these higher concentrations, leads to dye molecule aggregation and the appearance of a second, red fluorescent signal (B); metabolically active cells display both green and red fluorescence. The sample was also labeled with the anti-dsDNA antibody, here conjugated to a blue fluorophore (C). Overlaying the red and blue channels (D and E) reveals that >90% of cells immediately adjacent to areas with eDNA present (asterisks) not only demonstrate viability (ΔΨ > 0) but also display membrane potentials ~25% greater than the median. Bars, 25 µm.
DISCUSSION
The presence of bacterially derived extracellular DNA (eDNA) in biofilms and its role as an important structural component of the matrix in many species has been known for over a decade (3). The source of this eDNA has generally been characterized as autolysis of a subpopulation of biofilm cells via fratricidal, suicidal, or quorum sensing-based systems; E. faecalis itself has been shown to use the lytic system in later stages of biofilm growth (4). While predominant, lytic models are not exclusive: nucleic acid secretion from intact cells has been reported to be important in early Bacillus cereus biofilm formation (5), and hydrogen peroxide-induced eDNA release without cell lysis is known to occur in both Streptococcus sanguinis and Streptococcus gordonii (6). Lacking in many of these investigations has been an examination of eDNA’s role in nascent biofilms, nor has the ultrastructural distribution of the eDNA present in the matrix been considered thoroughly. Our findings via bulk biochemical analysis that the ratio of eDNA per cell rises dramatically in the first 4 h of biofilm development—more than 1,000-fold compared to planktonic controls (Fig. 5B)—prompted us to investigate the distribution of eDNA in early E. faecalis biofilms at the ultrastructural level.
Early E. faecalis biofilms (≤8 h postinoculation) are exquisitely sensitive to DNase I, while older biofilms display less degradation (7); this pattern of early sensitivity followed by later relative resistance has also been observed in biofilms of other species (3). The data shown here reveal that eDNA is largely localized to two structures in very early E. faecalis biofilms during the first 4 h of growth: intercellular string-like patterns (yarn; Fig. 1) and the thick matrix surrounding cells (sweater; Fig. 2). These two phenotypes are not exclusive: individual samples contain both structures. Notably, the immunogold labeling pattern seen by SEM is not continuous but punctate in both yarn and sweater forms (Fig. 1C and D, 2C, and 4A and B), suggesting an additional, non-nucleic acid component. A false-color low-voltage scanning electron microscopy (LVSEM) image overlaying the anti-dsDNA probe (green) with the surface morphology (red) reveals that the eDNA lies within another component of the matrix (Fig. 2C). Preliminary work suggests that a protein or lipoprotein constituent may be involved (data not shown).
Morphologically, the DNA distribution patterns seen in these early biofilms are inconsistent with wholesale cellular lysis: bulk cell lysis generally leads to irregular masses of intracellular debris—including the nucleic acid component (Fig. 3C). While not completely at odds with the sweater phenotype, the long intercellular structures containing DNA (yarn) are also difficult to reconcile with such a model. Both yarn structures and the fine branching pattern seen in many SEM micrographs (Fig. 1A) would seem to require an enzymatic extracellular remodeling system if a lytic mode of action is the primary source of eDNA—a decidedly nonparsimonious option. Finally, the possibility of preparation-induced ultrastructural artifacts is largely eliminated by the striking correlative features visible in the immunofluorescent (Fig. 4C and 6C) and cryo-SEM (see Fig. S1D) images.
The inherent heterogeneity of bacterial biofilms can often limit the utility of biochemical analysis based on bulk properties; population averaging of strong subpopulation phenotypes can be lost when averaged over entire samples (8-11). Despite these limitations, a comparison of eDNA levels in matched biofilm and planktonic samples revealed a dramatic increase in eDNA (>103-fold) in the biofilm samples. This elevation occurs within the first 4 h postattachment and, on a per-cell basis, remains largely unchanged at 24 h (Fig. 5B) (12). Extracellular concentrations of two key central metabolism compounds—ATP and G6PD—are also unchanged over the first 8 h of biofilm growth compared to those in planktonic controls (Fig. 5A).
The lack of visibly lysed cells at the ultrastructural level and the discrete spatial distribution of eDNA are consistent with a nonlytic release mechanism but do not directly preclude a lytic one. Maintaining a gradient across the cell membrane is a significant source of potential energy generation in bacteria. Conversely, loss of this gradient is a marker for nonviability. Results from the DiOC2-based assay for an active membrane potential (Fig. 6) show that not only are the cells nearest to eDNA alive, but also there is evidence of an elevated potential—a finding consistent with increased metabolic activity in a distinct subpopulation of biofilm cells. This elevated potential may be a reflection of the increased nucleic acid synthesis presumably required of cells secreting eDNA; alternatively, active DNA secretion may be restricted to cells with elevated membrane potentials.
An obvious candidate for such an active secretion system in E. faecalis is the conjugation apparatus. In enterococci, conjugation occurs via a mating channel encoded on a plasmid (pCF10); this channel appears to be a Gram-positive analog of type IV secretion systems common in Gram-negative organisms (13), and Neisseria gonorrhoeae is known to secrete chromosomal DNA into the extracellular space via such a system (14). The results reported here are, however, independent of pCF10; data shown in Fig. 1 to 6 are all from a strain lacking a conjugative plasmid. Notably, strains containing pCF10 or the homologous pTEF2 contain eDNA distributions indistinguishable from those of the plasmid-free strain under our experimental conditions (see Fig. S1C in the supplemental material).
In a small number of nascent biofilm microcolonies, we have been able to visualize cells in which eDNA localization appears immediately adjacent to the enterococcal septum (Fig. 3A and B). In some cases, this signal is small with only a few probe molecules visible (Fig. 3A). In others, the eDNA signal near the septum is much more robust (Fig. 3B) and contiguous with yarn and sweater structures. Localization near the septum is notable for its similarity to a previously reported mechanism of protein secretion found in Streptococcus pyogenes—the ExPortal system (15, 16). Postulating a homologous system for E. faecalis eDNA export is intriguing not only as an explanation for the septal localization but also for providing a possible model for the integration of the non-nucleic acid component of both the sweater and yarn morphologies. Alternatively, E. faecalis may use an as-yet-uncharacterized DNA export system. In either case, this secretion system appears active only when E. faecalis is in the biofilm state. Notably, the OG1RF strain contains an operon that appears to be related to competence with significant homology to the comY operon of Streptococcus mutans and similar to the comG system of B. subtilis (17).
Here we have shown that extracellular DNA is a component of E. faecalis biofilms at very early time points—within 4 h postinoculation. This eDNA is largely localized to two structural motifs: long, intercellular complexes (yarn structures) and a more globular domain (sweater structure) that appears to be congruent with the thick extracellular material forming the bulk of the biofilm matrix. The early appearance of eDNA in the matrix occurs in the absence of observable cellular lysis—a finding consistent with our observation that a subpopulation of cells display eDNA localization near the putative septum, as well as our evidence showing eDNA association with cells having elevated metabolic activity.
Goodman et al. recently reported that the stabilizing influence of eDNA in some bacterial biofilms is largely mediated by the interactions between the nucleic acid components and proteins from the DNABII family, primarily the highly conserved HU and IHF intracellular binding proteins (18). It is conceivable that this type of protein may be an integral component of the DNA-containing extracellular structures reported here.
These in vitro findings suggest that eDNA may play a more fundamental role in establishing functional E. faecalis biofilm stability. If the in vivo data are consistent with these results, a productive line of inquiry in the search for antibiofilm chemotherapeutic agents would focus on compounds targeting the bacterial eDNA and eDNA-associated components in the matrix.
MATERIALS AND METHODS
Bacterial strains, growth conditions, and reagents.
E. faecalis plasmid-free strain OG1RF was used in all experiments unless otherwise noted (19). The V583 clinical strain was obtained from the American Type Culture Collection (Manassas, VA) (20). Overnight cultures were grown at 37°C in brain heat infusion medium (BHI, BD Bacto; Becton, Dickinson, Sparks, MD). Biofilms were cultured on sterile Aclar fluoropolymer coupons (Aclar embedding film, ~200 µm thick; Electron Microscopy Sciences, Hatfield, PA) with a 1:50 dilution of the overnight culture in tryptic soy broth without added dextrose (TSBg−; Becton, Dickinson, and Co.) under gentle agitation (100 to 150 rpm) for 2 to 8 h.
Microscopy.
Cultured Aclar coupons were rapidly cooled to 4°C and rinsed repeatedly with cold buffer to remove nonadherent cells (Hank’s balanced salt solution [HBSS]; Gibco/Invitrogen, Carlsbad, CA). All steps prior to fixation were done at 4°C to allow immunolabeling of unfixed cells without growth; conventional, post-aldehyde fixation labeling resulted in similar labeling patterns (data not shown). Samples were blocked with 2% bovine serum albumin (BSA; Sigma-Aldrich, St. Louis, MO) in HBSS and labeled with a mouse anti-dsDNA monoclonal antibody (Abcam, Cambridge, MA). After primary labeling and repeated washings with HBSS containing 0.5% BSA, a 12-nm colloidal gold or fluorescent secondary antibody (DyLight 405 or 488; Jackson ImmunoResearch, West Grove, PA) was added for LVSEM or IF microscopy, respectively.
For LVSEM imaging, samples were stabilized and fixed as previously reported (21). Briefly, Aclar coupons were fixed for 22 h at room temperature in a sodium cacodylate-buffered solution (150 mM) with methanol-free, EM-grade 2% formaldehyde and 2% glutaraldehyde added (Electron Microscopy Sciences, Hatfield, PA) (22). The fixative also contained 4% sucrose to provide proper tonicity, as well as 0.15% Alcian blue 8GX (Sigma-Aldrich), a polycationic dye previously shown to stabilize the E. faecalis biofilm matrix during the chemical and physical dehydration steps common to electron microscopy (22). Fixed samples were chemically dried in a graded ethanol series (25 → 50 → 70 → 85 → 95 [twice] → 100% [twice]), processed in a CO2-based critical point dryer (tousimis, Rockville, MD), and sputter coated with a 1- to 2-nm layer of platinum (Denton DV-502, Moorestown, NJ). LVSEM imaging was done on a Hitachi S-4700 field emission instrument; secondary electron images were typically acquired at 2.5 keV, while backscatter (BSE) micrographs were collected using an Autrata-modified yttrium-aluminum-garnet detector at 5 keV (23).
For IF imaging, immunolabeled Aclar coupons were fixed in 4% formaldehyde in HBSS with 6% sucrose for ~3 h and mounted in Vectashield HardSet medium (Vector Laboratories, Burlingame, CA) on slides with a cover glass spacer to avoid physically distorting the biofilm structure (SecureSeal, Grace Bio-Labs, Bend, OR). Images were acquired with a Cascade 1k EMCCD camera (Photometrics, Tucson, AZ) as wide-field z stacks with a 60× 1.4 numerical aperture (NA) objective (Nikon Instruments, Melville, NY). z stacks were taken at 0.15-µm intervals and deconvolved using Huygens Professional software (Scientific Volume Imaging, Hilversum, The Netherlands). The images presented here are maximum-intensity projections of the deconvolved z stacks obtainedusing ImageJ (NIH, Bethesda, MD).
Membrane potentials were determined using a BacLight kit (Invitrogen) adapting a previously published protocol for microscopy (24). Unfixed immunolabeled sheets were treated with DiOC2 (3,3′-diethyloxacarbocyanine iodide), incubated for 5 min, and promptly mounted in nonhardening Vectashield. Imaging was done immediately after mounting, using a 40× 1.2 NA water immersion objective (Carl Zeiss, Thornwood, NY); all other imaging parameters and techniques were as noted above.
Biochemical assays for bulk cell lysis.
An ATP determination kit (Invitrogen) was used to check for elevations in extracellular ATP levels. Opaque white 96-well plates (Nalge Nunc, Rochester, NY) were inoculated with a 1:50 dilution of a BHI overnight culture into TSBg−. Equal volumes of prepared luciferase master mix were added at ~23°C, immediately loaded into a microplate reader (Synergy HT; Bio-Tek, Winooski, VT), and agitated for 5 s. Under these conditions, maximum luminescence occurred around 35 s after reagent mixing followed by a slow and consistent signal decay; all measurements reported here were made at this empirically determined time point. To ensure appropriate assay sensitivity, 100 pmol of exogenous ATP were added to a series of control wells. Results are averaged from four independent experiments; statistical significance was presumed if P was <0.05 (Student’s t test).
Quantification of extracellular glucose-6-phosphate dehydrogenase (G6PD) has also been used to detect bulk cellular lysis (25). Following the manufacturer’s protocol, a G6PD kit (Pointe Scientific, Canton, MI) was used to determine extracellular levels of this enzyme.
SUPPLEMENTAL MATERIAL
(A and B) Antibody labeling controls. Matched planktonic OG1RF cells (4 h postinoculation) show no eDNA labeling (A); omission of the primary antibody or substitution of an irrelevant primary antibody shows no discrete or punctate labeling of similar structures (*) in matched biofilm controls (B). (C) A 4-h biofilm formed by the common clinic strain V583 demonstrates labeling indistinguishable from that of the OG1RF strain used throughout. (D) Cryo-SEM micrograph of a 4-h OG1RF biofilm showing the presence of a complex ECM structure in the native hydrated state. The immunogold eDNA labeling pattern (*) is the same as that in the conventionally prepared samples. Bars, 1 µm (A and B), 5 µm (C), 500 nm (C, inset), and 3 µm (D). Download Figure S1, TIF file, 3.2 MB.
ACKNOWLEDGMENTS
This research was supported by award AI058134 from the National Institute of Allergy and Infectious Diseases (GMD) and GM095553 from the National Institute of General Medical Studies (C.L.W.). A.M.T.B. received additional support from NIH Medical Scientist training grant GM008244. During portions of this work, K.S.B. was also supported by the Dennis Watson Fellowship from the Department of Microbiology at the University of Minnesota.
Parts of this work were carried out in the College of Science and Engineering Characterization Facility (CharFac), University of Minnesota, which receives partial support from the National Science Foundation through the MRSEC program. Computational resources were provided by the Minnesota Supercomputing Institute at the University of Minnesota.
Footnotes
Citation Barnes AMT, Ballering KS, Leibman RS, Wells CL, and Dunny GM. 2012. Enterococcus faecalis produces abundant extracellular structures containing DNA in the absence of cell lysis during early biofilm formation. mBio 3(4):e00193-12. doi:10.1128/mBio.00193-12.
REFERENCES
- 1. Flemming HC, Wingender J. 2010. The biofilm matrix. Nat. Rev. Microbiol. 8:623–633 [DOI] [PubMed] [Google Scholar]
- 2. Lewis K. 2008. Multidrug tolerance of biofilms and persister cells. Curr. Top. Microbiol. Immunol. 322:107–131 [DOI] [PubMed] [Google Scholar]
- 3. Whitchurch CB, Tolker-Nielsen T, Ragas PC, Mattick JS. 2002. Extracellular DNA required for bacterial biofilm formation. Science 295:1487 [DOI] [PubMed] [Google Scholar]
- 4. Thomas VC, et al. 2009. A fratricidal mechanism is responsible for eDNA release and contributes to biofilm development of Enterococcus faecalis. Mol. Microbiol. 72:1022–1036 [DOI] [PMC free article] [PubMed] [Google Scholar]
- 5. Vilain S, Pretorius JM, Theron J, Brözel VS. 2009. DNA as an adhesin: Bacillus cereus requires extracellular DNA to form biofilms. Appl. Environ. Microbiol. 75:2861–2868 [DOI] [PMC free article] [PubMed] [Google Scholar]
- 6. Kreth J, Vu H, Zhang Y, Herzberg MC. 2009. Characterization of hydrogen peroxide-induced DNA release by Streptococcus sanguinis and Streptococcus gordonii. J. Bacteriol. 191:6281–6291 [DOI] [PMC free article] [PubMed] [Google Scholar]
- 7. Guiton PS, et al. 2009. Contribution of autolysin and Sortase A during Enterococcus faecalis DNA-dependent biofilm development. Infect. Immun. 77:3626–3638 [DOI] [PMC free article] [PubMed] [Google Scholar]
- 8. Wimpenny J, Manz W, Szewzyk U. 2000. Heterogeneity in biofilms. FEMS Microbiol. Rev. 24:661–671 [DOI] [PubMed] [Google Scholar]
- 9. Spormann AM. 2008. Physiology of microbes in biofilms. Curr. Top. Microbiol. Immunol. 322:17–36 [DOI] [PubMed] [Google Scholar]
- 10. Stewart PS, Franklin MJ. 2008. Physiological heterogeneity in biofilms. Nat. Rev. Microbiol. 6:199–210 [DOI] [PubMed] [Google Scholar]
- 11. An D, Parsek MR. 2007. The promise and peril of transcriptional profiling in biofilm communities. Curr. Opin. Microbiol. 10:292–296 [DOI] [PubMed] [Google Scholar]
- 12. Ballering KS. 2010. Identification and characterization of novel genetic determinants of biofilm formation in Enterococcus faecalis. Ph.D. thesis University of Minnesota, Minneapolis, MN: [Google Scholar]
- 13. Dunny GM. 2007. The peptide pheromone-inducible conjugation system of Enterococcus faecalis plasmid pCF10: cell-cell signalling, gene transfer, complexity and evolution. Philos. Trans. R. Soc. Lond. B Biol. Sci. 362:1185–1193 [DOI] [PMC free article] [PubMed] [Google Scholar]
- 14. Hamilton HL, Domínguez NM, Schwartz KJ, Hackett KT, Dillard JP. 2005. Neisseria gonorrhoeae secretes chromosomal DNA via a novel type IV secretion system. Mol. Microbiol. 55:1704–1721 [DOI] [PubMed] [Google Scholar]
- 15. Rosch JW, Caparon MG. 2004. A microdomain for protein secretion in Gram-positive bacteria. Science 304:1513–1515 [DOI] [PubMed] [Google Scholar]
- 16. Rosch JW, Caparon MG. 2005. The ExPortal: an organelle dedicated to the biogenesis of secreted proteins in Streptococcus pyogenes. Mol. Microbiol. 58:959–968 [DOI] [PubMed] [Google Scholar]
- 17. Bourgogne A, et al. 2008. Large scale variation in Enterococcus faecalis illustrated by the genome analysis of strain OG1RF. Genome Biol. 9:R110 [DOI] [PMC free article] [PubMed] [Google Scholar]
- 18. Goodman SD, et al. 2011. Biofilms can be dispersed by focusing the immune system on a common family of bacterial nucleoid-associated proteins. Mucosal Immunol. 4:625–637 [DOI] [PubMed] [Google Scholar]
- 19. Dunny GM, Brown BL, Clewell DB. 1978. Induced cell aggregation and mating in Streptococcus faecalis: evidence for a bacterial sex pheromone. Proc. Natl. Acad. Sci. U. S. A. 75:3479–3483 [DOI] [PMC free article] [PubMed] [Google Scholar]
- 20. Sahm DF, et al. 1989. In vitro susceptibility studies of vancomycin-resistant Enterococcus faecalis. Antimicrob. Agents Chemother. 33:1588–1591 [DOI] [PMC free article] [PubMed] [Google Scholar]
- 21. Kristich CJ, et al. 2008. Development and use of an efficient system for random mariner transposon mutagenesis to identify novel genetic determinants of biofilm formation in the core Enterococcus faecalis genome. Appl. Environ. Microbiol. 74:3377–3386 [DOI] [PMC free article] [PubMed] [Google Scholar]
- 22. Erlandsen SL, Kristich CJ, Dunny GM, Wells CL. 2004. High-resolution visualization of the microbial glycocalyx with low-voltage scanning electron microscopy: dependence on cationic dyes. J. Histochem. Cytochem. 52:1427–1435 [DOI] [PMC free article] [PubMed] [Google Scholar]
- 23. Erlandsen SL, Frethem C, Autrata R. 1990, Workshop on high-resolution immunocytochemistry of cell surfaces using field emission SEM. J. Histochem. Cytochem. 38:1779–1780 [DOI] [PubMed] [Google Scholar]
- 24. Shapiro HM. 2008. Flow cytometry of bacterial membrane potential and permeability. Methods Mol. Med. 142:175–186 [DOI] [PubMed] [Google Scholar]
- 25. Wu J, Xi C. 2009. Evaluation of different methods for extracting extracellular DNA from the biofilm matrix. Appl. Environ. Microbiol. 75:5390–5395 [DOI] [PMC free article] [PubMed] [Google Scholar]
Associated Data
This section collects any data citations, data availability statements, or supplementary materials included in this article.
Supplementary Materials
(A and B) Antibody labeling controls. Matched planktonic OG1RF cells (4 h postinoculation) show no eDNA labeling (A); omission of the primary antibody or substitution of an irrelevant primary antibody shows no discrete or punctate labeling of similar structures (*) in matched biofilm controls (B). (C) A 4-h biofilm formed by the common clinic strain V583 demonstrates labeling indistinguishable from that of the OG1RF strain used throughout. (D) Cryo-SEM micrograph of a 4-h OG1RF biofilm showing the presence of a complex ECM structure in the native hydrated state. The immunogold eDNA labeling pattern (*) is the same as that in the conventionally prepared samples. Bars, 1 µm (A and B), 5 µm (C), 500 nm (C, inset), and 3 µm (D). Download Figure S1, TIF file, 3.2 MB.