

Abstract
HCN channels are responsible for Ih, a voltage-gated inwardly rectifying current activated by hyperpolarization. This current appears to be more active in human sensory axons than motor and may play a role in the determination of threshold. Differences in Ih are likely to be responsible for the high variability in accommodation to hyperpolarization seen in different subjects. The aim of this study was to characterise this current in human axons, both motor and sensory. Recordings of multiple axonal excitability properties were performed in 10 subjects, with a focus on the changes in threshold evoked by longer and stronger hyperpolarizing currents than normally studied. The findings confirm that accommodation to hyperpolarization is greater in sensory than motor axons in all subjects, but the variability between subjects was greater than the modality difference. An existing model of motor axons was modified to take into account the behaviour seen with longer and stronger hyperpolarization, and a mathematical model of human sensory axons was developed based on the data collected. The differences in behaviour of sensory and motor axons and the differences between different subjects are best explained by modulation of the voltage dependence, along with a modest increase of expression of the underlying conductance of Ih. Accommodation to hyperpolarization for the mean sensory data is fitted well with a value of −94.2 mV for the mid-point of activation (V0.5) of Ih as compared to −107.3 mV for the mean motor data. The variation in response to hyperpolarization between subjects is accounted for by varying this parameter for each modality (sensory: −89.2 to −104.2 mV; motor −87.3 to −127.3 mV). These voltage differences are within the range that has been described for physiological modulation of Ih function. The presence of slowly activated Ih isoforms on both motor and sensory axons was suggested by modelling a large internodal leak current and a masking of the Na+/K+-ATPase pump activity by a tonic depolarization. In addition to an increased activation of Ih, the modelling suggests that in sensory axons the nodal slow K+ conductance is reduced, with consequent depolarization of resting membrane potential, and action potential of shorter duration.
Key points
Pacemaking in cardiac and neuronal cells is primarily controlled by the interaction between different voltage gated ion channels, and in particular the hyperpolarization-activated cyclic-nucleotide gated (HCN) family of channels.
HCN channels are activated by membrane hyperpolarization and play a key role in the determination of resting membrane potential.
We provide evidence suggesting that differences in (i) the modulation and expression of HCN channels, (ii) the expression of slow K+ channels; and (iii) the resultant changes in resting membrane potential are the major determinants of the functional differences between human motor and sensory axons.
Contrary to current wisdom, this study supports the view that the greater persistent Na+ current observed in sensory axons is not due to greater expression of persistent Na+ channels but instead to the relatively depolarized membrane potential driving greater resting activation.
Introduction
The voltage-gated inwardly rectifying current Ih flows through hyperpolarization-activated cyclic nucleotide-gated (HCN) channels and plays an important role in pace-making and determination of resting membrane potential (Pape, 1996; Biel et al. 2009). Recent studies in vivo have suggested a contribution of Ih to the determination of axonal threshold in human motor axons (Trevillion et al. 2010) and to a number of pathologies including diabetes, stroke and porphyria (Horn et al. 1996; Jankelowitz et al. 2007; Lin et al. 2008). HCN channels are of particular interest as molecular targets for neuropathic pain resulting from traumatic nerve damage or channelopathy (Chaplan et al. 2003; Momin et al. 2008; Momin & McNaughton, 2009; Wickenden et al. 2009).
Sensory axons undergo ectopic activity more readily than motor axons (Erlanger & Blair, 1938; Mogyoros et al. 2000). Bostock and colleagues (1994) suggested that greater expression of Ih in sensory axons than motor was a factor in post-ischaemic paraesthesiae and the greater accommodation of sensory axons to hyperpolarizing currents. This view has been supported by subsequent studies (Lin et al. 2002; Kiernan et al. 2004). Additionally, increased expression of Ih has been suggested as a contributing factor to the greater anode break hyperexcitability seen in sensory axons (Bostock et al. 1994; Stephanova & Mileva 2000). In a study of motor axons of subjects who had suffered an ischaemic stroke the key difference was a reduction in accommodation to hyperpolarization on the affected side (Jankelowitz et al. 2007). Decreased expression of Ih and of the internodal leak conductance accounted for a 77% reduction in the discrepancy between the affected and unaffected sides.
With one exception, previous studies have focused on the average response of a group of subjects, and have ignored the possibility of differences between subjects. Tomlinson and colleagues (2010) applied longer and stronger hyperpolarization to the motor axons of 15 subjects, performed repeated measures, and found a high degree of variability in response to hyperpolarization between subjects, but not within the same subject. They attributed these findings to the possibility that there was more than one isoform of HCN channels and/or to differences in metabolic factors such as cAMP which are known to modulate the voltage activation of Ih. In a recent study exploring the ionic basis of threshold to electrical stimulation (Trevillion et al. 2010), greater inward rectification was found in low-threshold motor axons, and this could be modelled by a near doubling of the expression of Ih and leak conductance across the internodal axolemma.
In the present study the responses of sensory axons to strong long-lasting hyperpolarization are contrasted with those of motor axons in the same subjects. A mathematical model of human sensory axons is developed and used to provide insight into the mechanisms underlying the differences between axons of different modality. The findings emphasize the importance of differences in channel gating in addition to differences in channel expression and provide evidence for the possibility of HCN isoforms with a slow time constant on both motor and sensory axons.
Methods
Thirty experiments were performed in 10 healthy subjects with no evidence of a peripheral neuropathy. The research conformed to the Declaration of Helsinki and local ethics approval was obtained from the University of Sydney's Human Research Ethics Committee. All subjects provided informed written consent prior to commencement of the study.
The sensory and motor studies in each subject were performed in the same session with the same stimulating electrode set-up. The cathode was placed in line with the median nerve at the proximal wrist crease and the anode approximately 10 cm proximal on the radial edge of the forearm. Compound muscle action potentials (CMAPs) were measured with disposable ECG electrodes (ClearTrace Ref 1700-030; ConMed; Utica, NY, USA) over the thenar eminence and the reference electrode over the proximal phalanx of digit one. A self-adhesive electrosurgical plate (no. 1180; 3M Healthcare; St Paul, MN, USA) was cut down, coated with Redux Creme (Parker Laboratories; Fairfield, NJ, USA) and placed over the palm to provide a large reliable ground electrode. Compound sensory action potentials (CSAPs) were recorded with self-adhesive disposable ring electrodes (RE-D; Electrode Store, Enumclaw, WA, USA), with the active electrode at the proximal end of digit two and the reference at the proximal end of the middle phalanx. Temperature was measured continuously with a thermistor close to the site of stimulation. The forearm was wrapped in a towel, and studies commenced only when the temperature was stable and greater than 32°C.
The CMAPs and CSAPs were amplified (×200 for motor; ×10k for sensory) and bandpass filtered (2 Hz to 2 kHz) using a purpose-built battery-powered isolated amplifier with low noise and high common mode rejection. The amplified signals had mains frequency noise removed using a HumBug 50/60 Hz noise eliminator (Quest Scientific; North Vancouver, BC, Canada) and were then digitised with a 16-bit data acquisition system (NI-USB6251; National Instruments; Austin, TX, USA). Stimulation was delivered by a DS5 Isolated Bipolar Constant Current Stimulator (Digitimer; Welwyn Garden City, UK). Both the stimulation and data acquisition were controlled by QtracS software (©Prof Hugh Bostock; Institute of Neurology, London, UK).
Excitability protocols
A stimulus–response curve was recorded so that the amplitude of the target potential could be defined. For both motor and sensory recordings the target potential was set to be 50% of maximal amplitude. The threshold for the target potential was tracked using a 1 ms test stimulus. In the present study it was important to optimise the comparison between sensory and motor recordings, and the same test stimulus was therefore used for both sensory and motor axons. However, most studies on sensory axons use a test stimulus width of 0.5 ms, to minimise the effects of temporal dispersion (Kiernan et al. 2001) so that additional sensory recordings were made with 0.5 ms test stimuli. For two excitability measures, threshold electrotonus and the current–threshold relationship, the strength of the conditioning polarizing currents was set as a percentage of the threshold of the target potential (that is, control threshold).
The strength–duration time constant (SDTC) was calculated by plotting the threshold stimulus charge against stimulus duration for test stimuli of five different durations. The stimulus widths used in the motor recordings were 0.2, 0.4, 0.6, 0.8 and 1.0 ms, and in the sensory recordings were 0.1, 0.2, 0.3, 0.4 and 0.5 ms.
Current–threshold (I–V) relationships were recorded by measuring the threshold for the target potential at the end of a 200 ms polarizing current (standard duration). The strength of the polarizing current was adjusted in 10% steps from +50% of control threshold (depolarizing) to −100% of control threshold (hyperpolarizing). A current–threshold relationship was also recorded using a 100 ms polarizing current (shorter duration) adjusted in strength as described for the 200 ms polarizing current. The threshold changes induced by the shorter duration conditioning current were recorded in order to obtain greater detail about the time course of accommodation to hyperpolarization.
The standard threshold electrotonus protocol using currents ±20% and ±40% of threshold was modified. Depolarizing currents of +40% are often not subthreshold for sensory axons, especially with 0.5 ms test stimuli (Burke et al. 2007; Trevillion et al. 2007), and regularly produce an artefact on the threshold electrotonus waveform. As a result, a 100 ms long +30% depolarizing current was also used in the sensory studies. Activation of Ih was explored using two additional hyperpolarizing currents, 70% for 200 ms and 100% for 300 ms (Tomlinson et al. 2010).
The recovery cycles of motor and sensory axons were recorded using 18 different conditioning–test intervals from 2 to 200 ms. The strength of the conditioning stimulus was set to be three times the control threshold to ensure that it was supramaximal. Measurements of the conditioned potential were made after subtraction of the conditioning potential.
Mathematical modelling
An existing mathematical model (the Bostock model; Fig. 1) of the human motor axon (Bostock et al. 1991; Kiernan et al. 2005; Bostock, 2006; Jankelowitz et al. 2007; Lin et al. 2008; Trevillion et al. 2010) was modified to interpret the measured responses to extended hyperpolarization and, in particular, the contribution of Ih to accommodation. The Bostock model lends itself well to the simulation of axonal excitability studies which stimulate superficial nerves with relatively large surface electrodes (effectively space-clamped stimulation). For modelling the behaviour of human axons, this model reproduces axonal excitability with detailed ionic contributions and simplified axonal geometry. The Bostock model has evolved from the Barrett & Barrett (1982) model of depolarizing afterpotentials in lizard and frog axons, with ionic conductances initially determined by intracellular and extracellular studies of rat spinal root myelinated axons (Baker et al. 1987) and by current- and voltage-clamping of the human node of Ranvier (Scholz et al. 1993; Schwarz et al. 1995; Reid et al. 1999). Later studies of latent addition in human motor and sensory axons led to the inclusion of persistent Na+ channels in the model (Bostock & Rothwell, 1997). The relevant values are listed in Table 1, left column, as modified in the present study to reproduce the extended hyperpolarization for motor axons introduced recently (Tomlinson et al. 2010).
Figure 1. The Bostock model of the human motor axon.
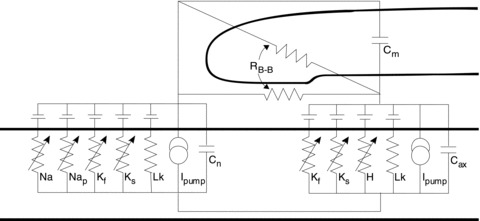
Schematic description of the key nodal and internodal features of the mathematical model. Voltage-gated channels: sodium (transient (Na) and persistent (Nap)); potassium (fast (Kf) and slow (Ks)); HCN (H). Na+/K+-ATPase pump (Ipump). Ohmic leak conductance (Lk). Capacitance of: axolemma (internodal (Cax), nodal (Cn)); myelin sheath (Cm). Barrett–Barrett conductance (RB-B) through and under the myelin sheath.
Table 1.
Modelled parameters producing the greatest error reduction
| Parameter | Description | Motor | Sensory |
|---|---|---|---|
| PNaN (cm3s−1× 10⁻⁹) | Permeability of Na+ channels at the node | 4.35 | 4.35 |
| PNap% (%) | % of Na+ channels that are persistent | 1.07 | 1.07 |
| GKsN (nS) | Max. conductance of slow K+ channels at the node | 56.7 | 29.1 |
| GKsI (nS) | Max. conductance of slow K+ channels at the internode | 0.57 | 1.74 |
| GKfN (nS) | Max. conductance of fast K+ channels at the node | 18.2 | 19.4 |
| GKfI (nS) | Max. conductance of fast K+ channels at the internode | 207 | 205 |
| GH (nS) | Max. conductance of Ih | 2.95 | 4.1 |
| GLkN (nS) | Leak conductance at the node | 1.97 | 1.69 |
| GLkI (nS) | Leak conductance at the internode | 4 | 3.65 |
| GBB (nS) | Barrett–Barrett conductance | 35.9 | 40.3 |
| Aam (ms−1)† | Activation rate of transient Na+ channels | 6.54 | 6.25 |
| Aah (ms−1)† | Inactivation rate of transient Na+ channels | 0.126 | 0.153 |
| Aq (ms−1) †‡ | Activation rate of Ih channels | 5.22 × 10⁻³ | 5.22 × 10⁻³ |
| Bq (mV) | Voltage of half-activation of Ih channels | −107.3 | −94.2 |
| Cq (mV) ‡ | Voltage activation slope factor of Ih channels | −12.2 | −12.2 |
| EIR (mV) | Internodal resting membrane potential (internodal pump current; nA)* | −84.6 (−7.86 × 10⁻³) | −81.3 (−4.3 × 10⁻³) |
| ENR (mV) | Nodal resting membrane potential (nodal pump current; nA)* | −84.4 (−3.33 × 10⁻²) | −80.3 (−5.44 × 10⁻²) |
Key differences between motor and sensory axons are highlighted in bold.
Activation rates at 36°C.
These values of Aq and Cq are presented here for completeness. They are not substantially different from the earlier Bostock model (4.30 × 10⁻³ ms−1 and −13.2 mV respectively) and over this range they do not appreciably alter the final model fits.
The Na+/K+-ATPase pump current itself is hyperpolarizing and is masked here by a tonic depolarization (shown by the negative pump currents).
This space-clamped, two-compartment model consists of a node and internode linked by the paranodal Barrett–Barrett pathways through and under the myelin sheath (Barrett & Barrett, 1982; Mierzwa et al. 2010), and has the key components of: transient and persistent Na+ channels, fast and slow K+ channels, a single HCN isoform, Na+/K+-ATPase pump, membrane and myelin capacitances, and leak conductances across the axolemma. Stephanova & Bostock (1996) further compartmentalized the internode of this model and found that the increased morphological complexity added no greater insight into axonal function.
The model was run in an unclamped mode, which allowed secondary changes due to the polarization of resting membrane potential (RMP), caused by changes in conductances or pump currents. No restriction was placed on the direction of flow of the constant amplitude (DC) ‘pump’ currents, so it is possible that these ‘pump’ currents are actually a composite of Na+/K+-ATPase activity and other unspecified tonic and slowly gated conductances (see Discussion).
The MEMFIT function (Bostock, 2006) within the QtracP software was used to fit objectively the model parameters to the motor excitability data. The parameters of this model were altered iteratively to reproduce the extended motor data recorded in this study. The fitting of these extended excitability data presented some unique challenges that needed to take into account the large variation between subjects in the responses to strong hyperpolarization. The model optimisation uses a least squares approach which aims to minimise the error between the model and the average data. A goodness of fit measure of the ‘discrepancy’ between the model and the recordings was obtained by weighting the errors of the four components of the excitability data as follows: strength–duration data, 0.5; threshold electrotonus, 3; recovery cycle, 1; current–threshold, 1. The optimisation procedure normally takes into account the variation of data within each component by inversely weighting each data point according to its standard deviation, but because of the observed variation in the hyperpolarizing electrotonus data, the optimisation employed here ignored the standard deviations and thereby fitted the mean data as closely as possible.
Having optimised the model to fit the motor excitability data, the model was then adapted to fit optimally the extended sensory (1 ms test width) excitability data. The validity of the new sensory model was then further tested against the 0.5 ms sensory data.
Results
Thirty recordings of nerve excitability with extended electrotonus and current–threshold relationships were obtained in 10 subjects in the same session with stable temperatures (motor 33.9 ± 0.2°C; sensory (1 ms test width) 34.0 ± 0.2°C; sensory (0.5 ms test width) 33.9 ± 0.2°C). There were no significant differences in temperature between any of the recordings (P > 0.7).
Sensory excitability
Accommodation to hyperpolarization
In conventional threshold electrotonus recordings, it may not be appreciated that there is accommodation to a 100 ms long 40% hyperpolarizing current because the increase in threshold does not reverse. This was also the case for the 200 ms long 70% hyperpolarization in the present study (Figs 2A and 3A).
Figure 2. Mean sensory nerve excitability data and best-fit from the mathematical model.
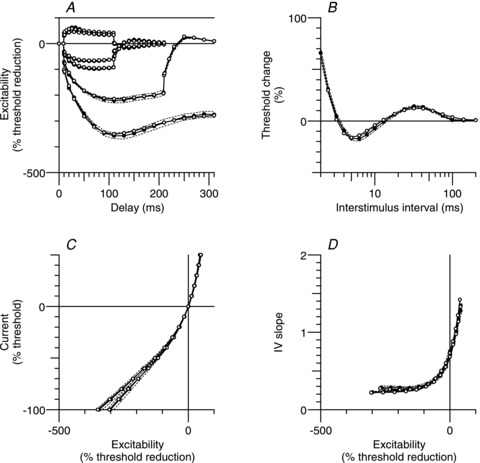
Extended excitability data for sensory axons (•; n = 10; mean ± SEM (dashed lines)) and the mathematical model simulation (○). A, threshold electrotonus for conditioning levels of ±30%, ±40%, −70% and −100% of control threshold. B, recovery cycle. C, current–threshold (I–V) relationship for 100 ms and 200 ms conditioning stimuli. D, I–V slope (threshold conductance) for the data presented in C.
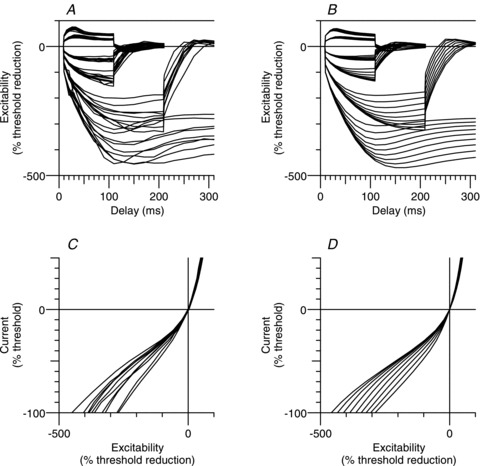
Figure 3. Individual sensory nerve recordings and sensory model.
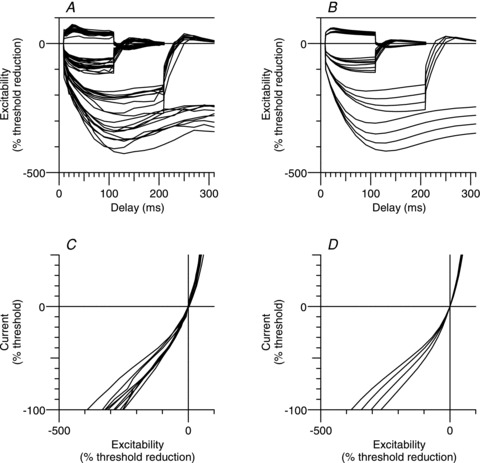
Individual sensory nerve recordings (n = 10; 1 ms test stimulus) of extended threshold electrotonus (A) (conditioning levels of ±30%, ±40%, −70% and −100% of unconditioned threshold), and current–threshold (I–V) (C) (for clarity, only the 200 ms conditioning stimulus data is displayed). Threshold electrotonus (B) and I–V (D) as generated by the sensory axon model with variation of V0.5 for Ih from −89.2 to −104.2 mV in 5 mV steps.
In eight out of the 10 recordings, accommodation appeared complete at the end of a 300 ms 100% hyperpolarization (Fig. 3A). The greatest hyperpolarizing change in threshold occurred 100–110 ms after the conditioning onset and was −359 ± 12% (mean ± SEM; Fig. 2A) with a range of −425% to −304% (Fig. 3A). The extent of accommodation was quite variable, ranging from 57% to 104% (Fig. 3A) with a mean of 85 ± 5% (Fig. 2A), and was not correlated with the hyperpolarizing change in threshold (Pearson product moment correlation, P = 0.44).
Figure 2C shows mean sensory data for the current–threshold relationship at the end of 100 ms (left filled circles) and 200 ms (right filled circles) conditioning stimuli. Excitability (measured as a threshold reduction) is the threshold analogue of membrane potential, and the slope of the current–threshold relationship (Fig. 2D) is therefore an analogue of conductance. Both the 100 ms and 200 ms conditioning stimuli resulted in a hyperpolarization-activated conductance which did not appreciably grow with further hyperpolarization (left-most data points Figs 2D, 4D and 5B).
Figure 4. Mean motor and sensory nerve excitability.
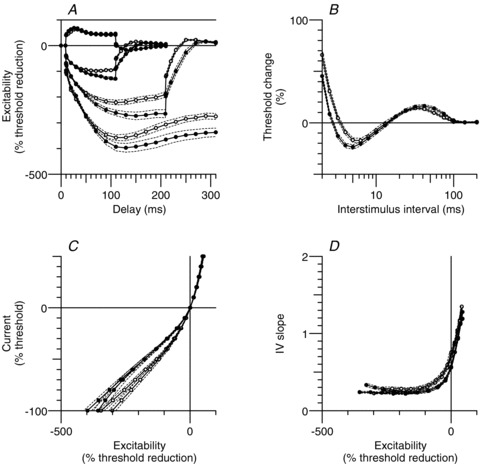
Extended excitability data for motor (•) and sensory (○; same data as in Fig. 2) axons (n = 10; mean ± SEM [dashed lines]), both recorded using 1 ms test stimuli. A, threshold electrotonus for conditioning levels of ± 40%, −70% and −100% of control threshold. B, recovery cycle. C, current–threshold (I–V) relationship for 100 ms and 200 ms conditioning stimuli. The 100 ms conditioning stimuli resulted in a larger decrease in excitability at −100% as less accommodation to hyperpolarization developed over the shorter time span. D, I–V slope (threshold conductance) for the data presented in C.Note the greater accommodation of sensory axons in A, C and D. Also note that in motor axons the longer polarizing currents produce a delayed increase in accommodation (C) and increase in I–V slope (threshold conductance; D), comparable with that of sensory axons.
Figure 5. Detailed comparison of I–V slope (threshold conductance) for motor and sensory axons.
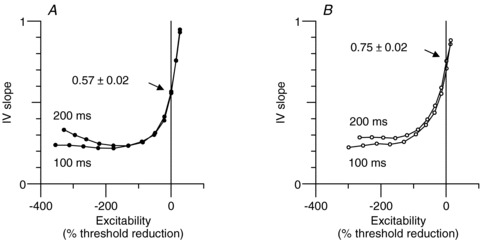
Detail of the most hyperpolarized portion of the current–threshold relationship data in Fig. 4D. A, I–V slope (threshold conductance) for motor axons (•; mean data; n = 10) for 100 ms and 200 ms conditioning stimuli. B, threshold conductance for sensory axons (○; mean data; same subjects as in A). Mean values of resting I–V slope indicated by the arrows.
The recovery cycle
The recovery of excitability after an action potential, tested here with 1 ms stimuli, did not differ significantly from the normative values established by Kiernan & colleagues (2001) using 0.5 ms stimuli. Refractoriness at 2.5 ms was 31 ± 4%, the relative refractory period was 3.5 ± 0.1 ms and superexcitability was −16 ± 2% (Fig. 2B).
Strength–duration time constant
The mean strength–duration time constant of 561 ± 49 μs for sensory axons in the present study is in good agreement with the value of 527 μs obtained by Kiernan and colleagues (2001), and these data are compared in Fig. 6.
Figure 6. Strength–duration time constant.
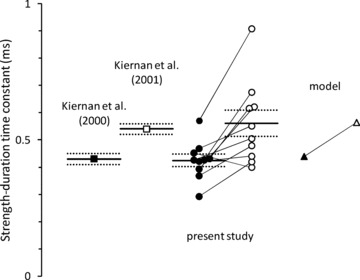
Strength–duration time constants for motor (filled symbols) and sensory (open symbols) studies. Means (continuous lines) ± SEM (dotted lines). Data from the first published normal control studies are presented for comparison (squares). Data from the 10 subjects in the present study (circles; lines link the same subject). Strength–duration time constants as estimated by the mathematical model for sensory and motor axons (triangles).
Comparison with conventional sensory recordings
As expected control thresholds were lower with 1 ms test stimuli, 2.9 ± 0.3 mA, than with the conventional 0.5 ms studies, 3.7 ± 0.4 mA (P < 0.008). The amplitude of the maximal CSAPs produced by supramaximal stimuli were not significantly different (1 ms, 78.3 ± 13.9 μV; 0.5 ms, 79.9 ± 13.7 μV; P = 0.37), suggesting that differences in dispersion of the CSAPs were minor. Not surprisingly, the latency to half-peak was longer for the 1 ms recordings (1 ms, 3.6 ± 0.1 ms; 0.5 ms, 3.4 ± 0.1 ms, P < 2 × 10⁻⁶).
Motor excitability
Motor axons were studied here in the same session using the 1 ms test stimulus width (except for measurements of SDTC as stated above) and with the extended hyperpolarizing conditioning stimuli.
Accommodation to hyperpolarization
Previous studies have assumed that the difference in accommodation to hyperpolarization between motor and sensory axons is due to a lower expression of HCN channels in motor axons (Bostock et al. 1994; Lin et al. 2002; Tomlinson et al. 2010). This difference in accommodation is clearly seen in the mean threshold electrotonus data presented in Fig. 4A. The current–threshold relationship, however, suggests an additional (slower) conductance. This becomes apparent at the most hyperpolarized levels of the 200 ms conditioning stimulus as a steepening of the curve in Fig. 4C, seen more clearly in the I–V slope plot (Fig. 4D). Figure 5 compares the hyperpolarizing portion of the current–threshold relationship for sensory and motor axons, where, for motor axons, an additional conductance appears for conditioning levels hyperpolarized by more than 40%.
Excitability measures sensitive to membrane potential
The studied measures of axonal excitability are sensitive to changes in membrane potential (Kiernan & Bostock, 2000). The most reliable parameters that are sensitive to polarization are: TEd90–100 (threshold reduction at the end of a 100 ms depolarization); resting I–V slope (an analogue of the resting input conductance); and superexcitability (largely due to the effect of the depolarizing after-potential). Motor axons had significantly greater TEd90–100 (motor, 45.7 ± 0.7%; sensory, 41.3 ± 1.2%, P < 0.002); significantly lower resting I–V slope (motor, 0.57 ± 0.02; sensory, 0.75 ± 0.07, P < 0.02, indicated by the arrows in Fig. 5); and greater superexcitability (motor, −22.0 ± 2.2%; sensory, −16.0 ± 2.2%, P < 0.002). A factor in these differences could be that sensory axons are probably more depolarized than motor axons (see Modelling, below).
Other excitability measures
The present study confirmed earlier findings of a shorter strength–duration time constant in motor axons (425 ± 23 μs, P < 0.005; Fig. 6; see Mogyoros et al. 1996; Kiernan et al. 2000, 2001). There were significant differences in the recovery of excitability following discharge (Fig. 4B). Refractoriness was significantly lower (8.5 ± 2.9% at 2.5 ms, P < 0.0004) and the relative refractory period significantly shorter (2.8 ± 0.1 ms; P < 3 × 10⁻⁵) in motor than sensory axons. Although there was greater superexcitability in motor axons (−22 ± 2%; P < 0.002; as in Kiernan et al. 1996), late subexcitability was not found to be significantly different (16 ± 1%; P = 0.12; unlike Kiernan et al. 1996) between motor and sensory axons.
Modelling
The adaptation of the Bostock model to the extended data for motor axons required neither additional ion channel types nor any changes to those properties primarily reflecting axon morphology. Further, no such changes were required when the model was modified to fit the sensory data. The equations underlying the model are given in the Appendix, and the key parameters giving the greatest error reduction are listed in Table 1.
Motor axons
Increases in the nodal slow K+ and the internodal fast K+ conductances over those in the Bostock model contributed the most to the nodal resting membrane potential of −84.4 mV (3.0 mV hyperpolarized). Although not directly measurable, this resting membrane potential is within the range of previous studies on myelinated nerve (Chiu et al. 1979, −80 mV, rabbit; Brismar, 1980, −80 mV, rat; Neumcke & Stämpfli, 1982, −78 mV, rat; Bostock et al. 1991, −86.7 mV, human; Halter & Clark, 1991, −78 mV, mammalian model; Schwarz et al. 1995, −84 to −86 mV, human; Stephanova & Bostock, 1995, −86.7 mV, human model).
Strong and long-lasting hyperpolarization revealed a lesser role for the modelled Ih conductance and a greater role for the leak conductance across the internodal axolemma than in the Bostock model. The internodal leak conductance probably incorporates a contribution due to slower HCN isoforms, the activity of which would have remained fairly constant, even for the longer conditioning used in this study. All voltage activation and kinetics parameters associated with the Ih conductance were allowed to vary (Table 1), and the most sensitive parameter was Bq (the voltage of half-activation, which was more hyperpolarized than in the Bostock model, by 4.2 mV; comparable to the hyperpolarization of the internodal RMP by 3.1 mV). Variation of Bq from the value obtained for the group data by −20 mV to +20 mV accounted for the variation in response to hyperpolarization seen in the recordings for different subjects (see Fig. 7B and D).
Figure 7. Individual motor nerve recordings and motor model.
Individual motor nerve recordings (n = 10) of extended threshold electrotonus (A) (conditioning levels of ±20%, ±40%, −70% and −100% of unconditioned threshold), and I–V (C) (for clarity, only the 200 ms conditioning stimulus data is displayed). Threshold electrotonus (B) and I–V (D) as generated by the motor axon model with variation of V0.5 for Ih from −87.3 to −127.3 mV in 5 mV steps.
Sensory axons
A model of sensory nerve was achieved by adjusting the parameters of the new motor model in order to minimise the weighted least squares error between the model and the 1 ms sensory data (see Methods). The overall reduction in discrepancy between the model and the sensory data was 98.8%, made up of reductions in discrepancy of 99.9% for strength–duration time constant, 98.5% for threshold electrotonus, 91.4% for recovery cycle, and 99.6% for current–threshold relationship. The fit of this new sensory model to the mean data is shown in Fig. 2 (open circles) and Fig. 6 (right-most triangle, open). Varying Bq (the voltage of half-activation of the Ih conductance) from the value obtained for the group data (by −10 mV to +5 mV) again mirrored the variation in excitability seen in the individual recordings from different subjects (Fig. 3).
The sensory model, derived from the 1 ms data, was then tested against the 0.5 ms sensory data recorded in the same session, yielding an overall reduction in discrepancy of 95.8% compared to the motor model. Additionally, the range of responses to hyperpolarization was again suitably modelled by varying Bq by −10 mV to +5 mV.
The time constants of activation were calculated from the modelling and correspond closely to the kinetics of the fastest HCN isoform, HCN1 (motor, 36 ms at −140 mV, 79 ms at RMP; sensory, 12 ms at −140 mV, 162 ms at RMP) confirming earlier findings (Moosmang et al. 2001; Biel et al. 2009).
Unlike earlier studies that proposed a doubling of the expression of Ih between sensory and motor axons (Bostock et al. 1994; Lin et al. 2002), the present study found that the increased activity of Ih in sensory axons is better explained by a combination of a modest increase in the maximal conductance of Ih of 39% and more importantly a 13.1 mV depolarizing shift in Bq, the voltage activation of the conductance underlying Ih (see Table 1).
There was a lower expression of nodal slow K+ channels in the sensory model which alone depolarizes the RMP by 2.1 mV, and this is consistent with earlier studies that have hypothesised that reduced K+ channel expression contributes to increased susceptibility to ectopic activity in sensory axons (Kocsis et al. 1986; Baker et al. 1987).
The nodal and internodal pump currents are modelled here as constant (DC) currents. The modelled currents are clearly not solely due to hyperpolarizing Na+/K+-ATPase activity as they are in the opposite direction, that is, depolarizing (shifting RMP by +1.8 mV). The combined effect of the reduction in slow K+ channel expression, the increased Ih current and the depolarizing ‘pump’ current is to depolarize the nodal RMP of sensory above motor axons by +4.1 mV.
The modelling in the present study found no differences between sensory and motor axons in the overall expression of Na+ channels, nor in the percentage of channels that are in a persistent state, in contrast with the 2.5:1 ratio proposed by Bostock & Rothwell (1997). This may in part be due to the relative depolarization of the resting membrane potential of the sensory model in this study. Differences in the kinetics of the transient (fast) Na+ channels, namely slower activation and faster inactivation in sensory axons counteract any broadening of the action potential width due to a lower expression of nodal slow K+, and also support the hypothesis that the reduced superexcitability in sensory axons is due to a narrower action potential (Mitrovićet al. 1993; Honmou et al. 1994; Kiernan et al. 2001; McIntyre et al. 2002).
Can the differences between sensory and motor axons be explained by the consequences of changing a single parameter?
To test whether the difference in RMP was the key factor, we determined how well the sensory data were fitted by the motor model depolarized by 4.1 mV (Table 1). This lengthened the strength–duration time constant (as in sensory axons; error improved by 95%), but the error for all other measures was greater (threshold electrotonus, recovery cycle, and current–threshold relationship; error worse by 22%, 125% and 4%, respectively). Similarly hyperpolarizing the sensory model failed to reproduce the motor findings.
To test whether the difference in slow potassium current (and the consequent difference in resting membrane potential) was the key factor, we reduced the nodal slow potassium conductance (GKsN) in the motor model from 56.7 nS to 29.1 nS (Table 1). Again strength–duration time constant lengthened (94% reduction in discrepancy), but the error for all the other measures was greater (threshold electrotonus, 58%; recovery cycle 52171% (much broader action potential); current–threshold relationship, 31.6%).
Discussion
This study compared the accommodative responses of sensory and motor axons to strong and long-lasting hyperpolarization for the first time, recorded in the same session, using the same control test stimulus width, and has documented the variability in accommodation seen between subjects. The results indicate that, while sensory axons accommodate to hyperpolarization more efficiently, motor axons can ‘catch up’ with longer and stronger hyperpolarization. The Bostock model of a motor axon was adapted to incorporate the new Ih data, and a model of human sensory nerve was developed. The modelling was used to quantify differences in various excitability indices for sensory and motor axons, and suggests that differences in channel gating may be as important as differences in channel expression in explaining the behaviour of sensory and motor axons.
Technical issues
Even though minimising the impedance of the skin electrode interface gave lower conditioning current intensities, unintended stimulation occurred in some axons within the first 20 ms of strong hyperpolarization. This often occurs for the strongest hyperpolarization levels in current–threshold relationships (unpublished observations), though its effect on the excitability tested some 200 ms later is probably small, and is most likely the consequence of virtual cathodic stimulation (Basser & Roth, 2000; Holsheimer, 2003).
Insights from mathematical modelling
The new models of axonal excitability were used to clarify the basis of Ih activity in sensory and motor axons. Figure 8A, shows the modelled Ih currents during hyperpolarizing threshold electrotonus. The Ih currents for 40% hyperpolarization qualitatively agree with the traditional view that sensory axons have a larger Ih conductance (Bostock et al. 1994; Lin et al. 2002). At the end of the 70% hyperpolarization, however, the magnitude of Ih is approximately the same for motor and sensory axons, and for the 100% hyperpolarization, Ih in motor axons exceeds that in sensory. Ih is modelled here using a Hodgkin–Huxley formulation style and, in accordance with Ohm's law, the current is simply the product of the instantaneous conductance (Fig. 8B) and the electrochemical driving force (Fig. 8C) for HCN channels (Hodgkin & Huxley, 1952). Figure 8B suggests that the number of channels conducting Ih in sensory axons is greater than in motor axons, at least for these hyperpolarization levels. Because motor axons hyperpolarize more they are subjected to a greater electrochemical driving force and thereby a larger Ih current flows with strong hyperpolarization (Fig. 8C).
Figure 8. Modelled changes in Ih and internodal leak current during hyperpolarization.
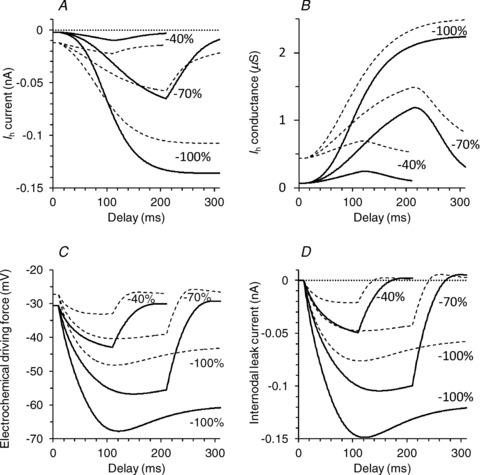
Mathematical model simulation of changes in Ih (A), conductance of HCN channels (B), electrochemical driving force for HCN channels (i.e. the difference between internodal membrane potential and the equilibrium potential) (C), and leak current across the internodal membrane (D), during threshold electrotonus (for conditioning levels of −40%, −70% and −100% of control threshold) in motor (continuous line) and sensory (dashed line) models.
Figure 8D demonstrates that the leak current across the internodal axolemma is considerably larger in the motor axons. Much as for Ih, this is due to both a larger maximal conductance and a larger driving electromotive force (difference between the instantaneous and resting internodal membrane potentials) in motor axons. It is likely that a component of this leak current is due to slower otherwise unmodelled HCN isoforms. Interestingly, unlike the situation in voltage-clamped studies, the time course of the current flowing through slowly gated channels is largely determined by the instantaneous membrane potential. If indeed the leak current partially represents ‘slow’ HCN channels, it can be seen in Fig 8D that this current will parallel the degree of hyperpolarization. A similar logic underpinned our suggestion in a previous report that slow K+ currents make a significant contribution to the extent and duration of refractoriness and of superexcitability following a discharge (Burke et al. 2009).
Similarly, the depolarizing nature of the ‘pump’ currents as modelled here is likely to be due to a tonic depolarization not otherwise modelled. Again this is suggestive of a very slowly gated depolarizing current active at rest, such as one of the slower isoforms of HCN channels.
This study suggests that, leak and pump currents aside, the differences in response to hyperpolarization between motor and sensory axons are best explained by modulation of the voltage activation of the fastest HCN isoform, presumably HCN1. However, the differences in Bq (the voltage of half-activation) between motor and sensory axons and the range of modulation of Bq required to replicate the variability in accommodation seen in different subjects are greater than can be explained by cAMP alone. It is possible that the mechanism behind regulation of Ih function involves an allosteric activator such as the phospholipid PIP2 (phosphatidylinositol 4,5-bisphosphate; Pian et al. 2006, 2007), which may also be required to bring the voltage activation of HCN channels into a physiological range (Zolles et al. 2006).
In summary, more of the ‘fast’ HCN isoform underlying Ih appears to be open at rest in sensory than in motor axons, and is thus able to participate more readily in limiting further hyperpolarization. In contrast motor axons appear to have a greater internodal leak conductance, which may be due to slowly activated HCN isoforms.
Other mechanisms that influence the action potential and the depolarizing afterpotential
Bostock & Rothwell (1997) concluded that the difference in latent addition between sensory and motor axons is due to a greater persistent Na+ current in sensory axons, and they modelled this by an increase in the fraction of Na+ channels functioning in the persistent mode. However, they noted that: ‘latent addition in depolarized motor fibres was indistinguishable from that in normal sensory fibres, both in our model and in vivo, so that although we have modelled the motor-sensory difference by a difference in density of threshold channels, our results are also compatible with the sensory fibres being relatively depolarized …’ . Persistent sodium currents can be recorded in DRG neurones and motoneurones and in their axons (Baker & Bostock, 1997; Tokuno et al. 2003; Li et al. 2004), but there are no comparative data on the relative numbers of channels operating in a persistent mode. The present results favour the alternative suggestion by Bostock & Rothwell (1997), though relative depolarization is insufficient to explain all the differences between sensory and motor axons.
The modelling indicates a reduction in the maximum slow K+ conductance of sensory axons which would broaden the action potential. However this broadening is more than compensated for by a slowing of the activation of and an acceleration of the inactivation of transient Na+ channels (Mitrovićet al. 1993; Honmou et al. 1994). This overall narrowing of the sensory action potential was suggested by McIntyre and colleagues (2002) as a means of explaining the apparent paradox of reduced superexcitability (after an action potential) despite an increased persistent Na+ current in sensory fibres. Stephanova & Mileva (2000) proposed an increased expression of nodal fast K+ channels as a mechanism for a smaller depolarizing afterpotential in sensory axons. In contrast our modelling suggests no difference in the expression or kinetics of fast K+ channels between modalities. It is worth noting, however, that this model requires a small stabilising population of ‘nodal’ fast K+ channels. Although there is no evidence for their existence at the node, fast K+ channels could still participate in the dynamics of nodal excitability through pathways which access juxtaparanodally located K+ channels (Barrett & Barrett, 1982; Kocsis et al. 1986; Mierzwa et al. 2010).
Functional implications
This study supports the view that resting membrane potential is more depolarized in sensory axons, the model suggesting by 4.1 mV. Factors in this depolarizing shift of RMP are the reduction in nodal slow K+ (+2.1 mV), a further depolarization of the ‘pump’ current (+1.8 mV, probably due to slowly gated HCN channels), and increased expression and depolarization of the voltage dependence of Ih (+0.5 mV). In turn, the relative depolarization can explain the previously reported differences in INaP, then attributed to a difference in the percentage of Na+ channels that inactivate slowly, if at all. In addition this shift in resting membrane potential is a factor in the longer strength–duration time constant, decreased superexcitability, increased resting I–V slope and the lower TEd90–100 of sensory axons. However, the modelling suggests that the differences between sensory and motor axons cannot be explained by this change in RMP, or a change in other single properties, and the secondary consequences thereof.
It is often stated that the lower electrical threshold for sensory axons than motor is related to size. The present data provide no support for this view and, instead, suggest that the greater excitability reflects properties such as the currents active at rest (slow K+, persistent Na+ and Ih) and their influence on RMP.
There are at present no localisation data on HCN isoforms on human peripheral axons, and scant data for other mammals. The present findings implicate HCN1 in both sensory and motor axons but, in addition, raise the distinct possibility of ‘slow’ isoforms on both motor and sensory axons.
Acknowledgments
This research was supported by the National Health and Medical Research Council of Australia.
Glossary
Abbreviations
- Bq
voltage of half-activation for HCN channels
- CMAP
compound muscle action potential
- CSAP
compound sensory action potential
- HCN
hyperpolarization-activated cyclic nucleotide-gated
- Ih
hyperpolarization-activated cation current
- INaP
persistent sodium current
- RMP
resting membrane potential
- SDTC
strength–duration time constant
- TEd90–100
threshold reduction at the end of a 100 ms depolarization
- V0.5
voltage of half-activation
Appendix
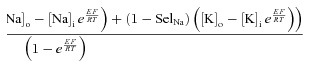
Membrane Potentials:
Currents:
 |
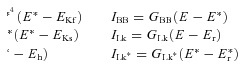 |
Reversal potentials:
Channel selectivities:
Ion concentrations:
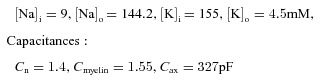 |
Channel gating:
and similarly for mp, h, n, s, n*, s*, q
The rate constants (A) and the voltage dependent parameters (B,C) are listed in Table 2.
Table 2.
Voltage and time dependent parameters for the rate constants, α and β for motor and sensory (bracketed values) axons
| A (ms−1, at 36°C) | Q10 | B (mV) | C (mV) | |
|---|---|---|---|---|
| αm | 6.54 (6.25) | 2.2 | −18.5 (−18.3) | 10.3 |
| βm | 0.302 (0.289) | −22.8 (−22.6) | 9.16 | |
| αmp | 3.27 (3.13) | −36.5 (−36.3) | 10.3 | |
| βmp | 0.151 (0.145) | −40.8 (−40.6) | 9.16 | |
| αh | 0.126 (0.153) | 2.9 | −115.1 (−113.8) | 15.6 (11.9) |
| βh | 8.60 (10.5) | −32.9 (−31.6) | 19.0 (14.5) | |
| αn | 0.0221 | 3.0 | −90.8 | 7.7 |
| βn | 0.0393 | −73.6 | 7.35 | |
| αs | 0.00563 | −23.5 | 12.7 | |
| βs | 0.00341 | −91.1 | 11.7 | |
| αq,βq | 0.00522 | −107.3 (−94.2) | −12.2 |
The key differences (bold) between sensory and motor axons are: (i) slowing of the Na+ activation gate (α↓m, β↓m), (ii) acceleration of the Na+ inactivation gate (α↓h, β↓h) and (iii) depolarization of the Ih voltage activation (α↓q, β↓q).
Author contributions
J.H. designed and built the isolated low-noise amplifier. All of the authors contributed to all aspects of the study, and have approved the final version of the manuscript. The experiments were performed at the University of Sydney.
Disclosures
H.B. receives royalties from the sales of the QTRAC software.
References
- Baker MD, Bostock H. Low-threshold persistent sodium current in rat large dorsal root ganglion neurons in culture. J Neurophysiol. 1997;77:1503–1513. doi: 10.1152/jn.1997.77.3.1503. [DOI] [PubMed] [Google Scholar]
- Baker M, Bostock H, Grafe P, Martius P. Function and distribution of three types of rectifying channel in rat spinal root myelinated axons. J Physiol. 1987;383:45–67. doi: 10.1113/jphysiol.1987.sp016395. [DOI] [PMC free article] [PubMed] [Google Scholar]
- Barrett EF, Barrett JN. Intracellular recording from vertebrate myelinated axons: Mechanism of the depolarizing afterpotential. J Physiol. 1982;323:117–144. doi: 10.1113/jphysiol.1982.sp014064. [DOI] [PMC free article] [PubMed] [Google Scholar]
- Basser PJ, Roth BJ. New currents in electrical stimulation of excitable tissues. Annu Rev Biomed Eng. 2000;2:377–397. doi: 10.1146/annurev.bioeng.2.1.377. [DOI] [PubMed] [Google Scholar]
- Biel M, Wahl-Schott C, Michalakis S, Zong X. Hyperpolarization-activated cation channels: From genes to function. Physiol Rev. 2009;89:847–885. doi: 10.1152/physrev.00029.2008. [DOI] [PubMed] [Google Scholar]
- Bostock H. MEMFIT: A computer program to aid interpretation of multiple excitability measurements on human motor axons. Clin Neurophysiol. 2006;117:S85. [Google Scholar]
- Bostock H, Baker M, Reid G. Changes in excitability of human motor axons underlying post-ischaemic fasciculations: evidence for two stable states. J Physiol. 1991;441:537–557. doi: 10.1113/jphysiol.1991.sp018766. [DOI] [PMC free article] [PubMed] [Google Scholar]
- Bostock H, Burke D, Hales JP. Differences in behaviour of sensory and motor axons following release of ischaemia. Brain. 1994;117:225–234. doi: 10.1093/brain/117.2.225. [DOI] [PubMed] [Google Scholar]
- Bostock H, Rothwell JC. Latent addition in motor and sensory fibres of human peripheral nerve. J Physiol. 1997;498:277–294. doi: 10.1113/jphysiol.1997.sp021857. [DOI] [PMC free article] [PubMed] [Google Scholar]
- Brismar T. Potential clamp analysis of membrane currents in rat myelinated nerve fibres. J Physiol. 1980;298:171–184. doi: 10.1113/jphysiol.1980.sp013074. [DOI] [PMC free article] [PubMed] [Google Scholar]
- Burke D, Howells J, Trevillion L, Kiernan M, Bostock H. Inflections in threshold electrotonus to depolarizing currents in sensory axons. Muscle Nerve. 2007;36:849–852. doi: 10.1002/mus.20862. [DOI] [PubMed] [Google Scholar]
- Burke D, Howells J, Trevillion L, McNulty PA, Jankelowitz SK, Kiernan MC. Threshold behaviour of human axons explored using subthreshold perturbations to membrane potential. J Physiol. 2009;587:491–504. doi: 10.1113/jphysiol.2008.163170. [DOI] [PMC free article] [PubMed] [Google Scholar]
- Chaplan SR, Guo H-Q, Lee DH, Luo L, Liu C, Kuei C, Velumian AA, Butler MP, Brown SM, Dubin AE. Neuronal hyperpolarization-activated pacemaker channels drive neuropathic pain. J Neurosci. 2003;23:1169–1178. doi: 10.1523/JNEUROSCI.23-04-01169.2003. [DOI] [PMC free article] [PubMed] [Google Scholar]
- Chiu SY, Ritchie JM, Rogart RB, Stagg D. A quantitative description of membrane currents in rabbit myelinated nerve. J Physiol. 1979;292:149–166. doi: 10.1113/jphysiol.1979.sp012843. [DOI] [PMC free article] [PubMed] [Google Scholar]
- Erlanger J, Blair EA. Comparative observations on motor and sensory fibers with special reference to repetitiousness. Am J Physiol. 1938;121:431–453. [Google Scholar]
- Halter JA, Clark JW., Jr A Distributed-parameter model of the myelinated nerve fiber. J Theor Biol. 1991;148:345–382. doi: 10.1016/s0022-5193(05)80242-5. [DOI] [PubMed] [Google Scholar]
- Hodgkin AL, Huxley AF. A quantitative description of membrane current and its application to conduction and excitation in nerve. J Physiol. 1952;117:500–544. doi: 10.1113/jphysiol.1952.sp004764. [DOI] [PMC free article] [PubMed] [Google Scholar]
- Holsheimer J. Principles of neurostimulation. In: Simpson BA, editor. Electrical Stimulation and the Relief of Pain, vol. 15, Pain Research and Clinical Management. Amsterdam: Elsevier Science; 2003. pp. 17–36. [Google Scholar]
- Honmou O, Utzschneider DA, Rizzo MA, Bowe CM, Waxman SG, Kocsis JD. Delayed depolarization and slow sodium currents in cutaneous afferents. J Neurophysiol. 1994;71:1627–1637. doi: 10.1152/jn.1994.71.5.1627. [DOI] [PMC free article] [PubMed] [Google Scholar]
- Horn S, Quasthoff S, Grafe P, Bostock H, Renner R, Berthold S. Abnormal axonal inward rectification in diabetic neuropathy. Muscle Nerve. 1996;19:1268–1275. doi: 10.1002/mus.880191002. [DOI] [PubMed] [Google Scholar]
- Jankelowitz SK, Howells J, Burke D. Plasticity of inwardly rectifying conductances following a corticospinal lesion in human subjects. J Physiol. 2007;581:927–940. doi: 10.1113/jphysiol.2006.123661. [DOI] [PMC free article] [PubMed] [Google Scholar]
- Kiernan MC, Bostock H. Effects of membrane polarization and ischaemia on the excitability properties of human motor axons. Brain. 2000;123:2542–2551. doi: 10.1093/brain/123.12.2542. [DOI] [PubMed] [Google Scholar]
- Kiernan MC, Burke D, Andersen KV, Bostock H. Multiple measures of axonal excitability: A new approach in clinical testing. Muscle Nerve. 2000;23:399–409. doi: 10.1002/(sici)1097-4598(200003)23:3<399::aid-mus12>3.0.co;2-g. [DOI] [PubMed] [Google Scholar]
- Kiernan MC, Isbister GK, Lin CS-Y, Burke D, Bostock H. Acute tetrodotoxin-induced neurotoxicity following ingestion of puffer fish. Ann Neurol. 2005;57:339–348. doi: 10.1002/ana.20395. [DOI] [PubMed] [Google Scholar]
- Kiernan MC, Lin CS-Y, Andersen KV, Murray NMF, Bostock H. Clinical evaluation of excitability measures in sensory nerve. Muscle Nerve. 2001;24:883–892. doi: 10.1002/mus.1085. [DOI] [PubMed] [Google Scholar]
- Kiernan MC, Lin CS-Y, Burke D. Differences in activity-dependent hyperpolarization in human sensory and motor axons. J Physiol. 2004;558:341–349. doi: 10.1113/jphysiol.2004.063966. [DOI] [PMC free article] [PubMed] [Google Scholar]
- Kiernan MC, Mogyoros I, Burke D. Differences in the recovery of excitability in sensory and motor axons of human median nerve. Brain. 1996;119:1099–1105. doi: 10.1093/brain/119.4.1099. [DOI] [PubMed] [Google Scholar]
- Kocsis JD, Bowe CM, Waxman SG. Different effects of 4-aminopyridine on sensory and motor fibers: Pathogenesis of paresthesias. Neurology. 1986;36:117–120. doi: 10.1212/wnl.36.1.117. [DOI] [PubMed] [Google Scholar]
- Li Y, Gorassini MA, Bennett DJ. Role of persistent sodium and calcium currents in motoneuron firing and spasticity in chronic spinal rats. J Neurophysiol. 2004;91:767–783. doi: 10.1152/jn.00788.2003. [DOI] [PubMed] [Google Scholar]
- Lin CS-Y, Kuwabara S, Cappelen-Smith C, Burke D. Responses of human sensory and motor axons to the release of ischaemia and to hyperpolarizing currents. J Physiol. 2002;541:1025–1039. doi: 10.1113/jphysiol.2002.017848. [DOI] [PMC free article] [PubMed] [Google Scholar]
- Lin CS-Y, Krishnan AV, Lee M-J, Zagami AS, You H-L, Yang C-C, Bostock H, Kiernan MC. Nerve function and dysfunction in acute intermittent porphyria. Brain. 2008;131:2510–2519. doi: 10.1093/brain/awn152. [DOI] [PubMed] [Google Scholar]
- McIntyre CC, Richardson G, Grill WM. Modeling the excitability of mammalian nerve fibers: influence of afterpotentials on the recovery cycle. J Neurophysiol. 2002;87:995–1006. doi: 10.1152/jn.00353.2001. [DOI] [PubMed] [Google Scholar]
- Mierzwa A, Shroff S, Rosenbluth J. Permeability of the paranodal junction of myelinated nerve fibers. J Neurosci. 2010;30:15962–15968. doi: 10.1523/JNEUROSCI.4047-10.2010. [DOI] [PMC free article] [PubMed] [Google Scholar]
- Mitrović N, Quasthoff S, Grafe P. Sodium channel inactivation kinetics of rat sensory and motor nerve fibres and their modulation by glutathione. Pflugers Arch. 1993;425:453–461. doi: 10.1007/BF00374872. [DOI] [PubMed] [Google Scholar]
- Mogyoros I, Bostock H, Burke D. Mechanisms of paresthesias arising from healthy axons. Muscle Nerve. 2000;23:310–320. doi: 10.1002/(sici)1097-4598(200003)23:3<310::aid-mus2>3.0.co;2-a. [DOI] [PubMed] [Google Scholar]
- Mogyoros I, Kiernan MC, Burke D. Strength-duration properties of human peripheral nerve. Brain. 1996;119:439–447. doi: 10.1093/brain/119.2.439. [DOI] [PubMed] [Google Scholar]
- Momin A, Cadiou H, Mason A, McNaughton PA. Role of the hyperpolarization-activated current Ih in somatosensory neurons. J Physiol. 2008;586:5911–5929. doi: 10.1113/jphysiol.2008.163154. [DOI] [PMC free article] [PubMed] [Google Scholar]
- Momin A, McNaughton PA. Regulation of firing frequency in nociceptive neurons by pro-inflammatory mediators. Exp Brain Res. 2009;196:45–52. doi: 10.1007/s00221-009-1744-2. [DOI] [PubMed] [Google Scholar]
- Moosmang S, Stieber J, Zong X, Biel M, Hofmann F, Ludwig A. Cellular expression and functional characterization of four hyperpolarization-activated pacemaker channels in cardiac and neuronal tissues. Eur J Biochem. 2001;268:1646–1652. doi: 10.1046/j.1432-1327.2001.02036.x. [DOI] [PubMed] [Google Scholar]
- Neumcke B, Stämpfli R. Sodium currents and sodium-current fluctuations in rat myelinated nerve fibres. J Physiol. 1982;329:163–184. doi: 10.1113/jphysiol.1982.sp014296. [DOI] [PMC free article] [PubMed] [Google Scholar]
- Pape HC. Queer current and pacemaker: The hyperpolarization-activated cation current in neurons. Annu Rev Physiol. 1996;58:299–327. doi: 10.1146/annurev.ph.58.030196.001503. [DOI] [PubMed] [Google Scholar]
- Pian P, Bucchi A, DeCostanzo A, Robinson RB, Siegelbaum SA. Modulation of cyclic nucleotide-regulated HCN channels by PIP2 and receptors coupled to phospholipase C. Pflugers Arch. 2007;455:125–145. doi: 10.1007/s00424-007-0295-2. [DOI] [PubMed] [Google Scholar]
- Pian P, Bucchi A, Robinson RB, Siegelbaum SA. Regulation of gating and rundown of HCN hyperpolarization-activated channels by exogenous and endogenous PIP2. J Gen Physiol. 2006;128:593–604. doi: 10.1085/jgp.200609648. [DOI] [PMC free article] [PubMed] [Google Scholar]
- Reid G, Scholz A, Bostock H, Vogel W. Human axons contain at least five types of voltage-dependent potassium channel. J Physiol. 1999;518:681–696. doi: 10.1111/j.1469-7793.1999.0681p.x. [DOI] [PMC free article] [PubMed] [Google Scholar]
- Scholz A, Reid G, Vogel W, Bostock H. Ion channels in human axons. J Neurophysiol. 1993;70:1274–1279. doi: 10.1152/jn.1993.70.3.1274. [DOI] [PubMed] [Google Scholar]
- Schwarz JR, Reid G, Bostock H. Action potentials and membrane currents in the human node of Ranvier. Pflugers Arch. 1995;430:283–292. doi: 10.1007/BF00374660. [DOI] [PubMed] [Google Scholar]
- Stephanova DI, Bostock H. A distributed-parameter model of the myelinated human motor nerve fibre: temporal and spatial distributions of action potentials and ionic currents. Biol Cybern. 1995;73:275–280. doi: 10.1007/BF00201429. [DOI] [PubMed] [Google Scholar]
- Stephanova DI, Bostock H. A distributed-parameter model of the myelinated human motor nerve fibre: temporal and spatial distributions of electrotonic potentials and ionic currents. Biol Cybern. 1996;74:543–547. doi: 10.1007/BF00209425. [DOI] [PubMed] [Google Scholar]
- Stephanova DI, Mileva K. Different effects of blocked potassium channels on action potentials, accommodation, adaptation and anode break excitation in human motor and sensory myelinated nerve fibres: computer simulations. Biol Cybern. 2000;83:161–167. doi: 10.1007/s004220000151. [DOI] [PubMed] [Google Scholar]
- Tokuno HA, Kocsis JD, Waxman SG. Noninactivating, tetrodotoxin-sensitive Na+ conductance in peripheral axons. Muscle Nerve. 2003;28:212–217. doi: 10.1002/mus.10421. [DOI] [PubMed] [Google Scholar]
- Tomlinson SE, Burke D, Hanna M, Koltzenburg M, Bostock H. In vivo assessment of HCN channel current (Ih) in human motor axons. Muscle Nerve. 2010;41:247–256. doi: 10.1002/mus.21482. [DOI] [PubMed] [Google Scholar]
- Trevillion L, Howells J, Bostock H, Burke D. Properties of low-threshold motor axons in the human median nerve. J Physiol. 2010;588:2503–2515. doi: 10.1113/jphysiol.2010.190884. [DOI] [PMC free article] [PubMed] [Google Scholar]
- Trevillion L, Howells J, Burke D. Outwardly rectifying deflections in threshold electrotonus due to K+ conductances. J Physiol. 2007;580:685–696. doi: 10.1113/jphysiol.2006.126003. [DOI] [PMC free article] [PubMed] [Google Scholar]
- Wickenden AD, Maher MP, Chaplan SR. HCN pacemaker channels and pain: A drug discovery perspective. Curr Pharm Des. 2009;15:2149–2168. doi: 10.2174/138161209788489122. [DOI] [PubMed] [Google Scholar]
- Zolles G, Klöcker N, Wenzel D, Weisser-Thomas J, Fleischmann BK, Roeper J, Fakler B. Pacemaking by HCN channels requires interaction with phosphoinositides. Neuron. 2006;52:1027–1036. doi: 10.1016/j.neuron.2006.12.005. [DOI] [PubMed] [Google Scholar]