

Abstract
Involuntary motor unit activity at low rates is common in hand muscles paralysed by spinal cord injury. Our aim was to describe these patterns of motor unit behaviour in relation to motoneurone and motor unit properties. Intramuscular electromyographic activity (EMG), surface EMG and force were recorded for 30 min from thenar muscles of nine men with chronic cervical SCI. Motor units fired for sustained periods (>10 min) at regular (coefficient of variation ≤ 0.15, CV, n = 19 units) or irregular intervals (CV > 0.15, n = 14). Regularly firing units started and stopped firing independently suggesting that intrinsic motoneurone properties were important for recruitment and derecruitment. Recruitment (3.6 Hz, SD 1.2), maximal (10.2 Hz, SD 2.3, range: 7.5–15.4 Hz) and derecruitment frequencies were low (3.3 Hz, SD 1.6), as were firing rate increases after recruitment (∼20 intervals in 3 s). Once active, firing often covaried, promoting the idea that units received common inputs. Half of the regularly firing units showed a very slow decline (>40 s) in discharge before derecruitment and had interspike intervals longer than their estimated afterhyperpolarisation potential (AHP) duration (estimated by death rate and breakpoint analyses). The other units were derecruited more abruptly and had shorter estimated AHP durations. Overall, regularly firing units had longer estimated AHP durations and were weaker than irregularly firing units, suggesting they were lower threshold units. Sustained firing of units at regular rates may reflect activation of persistent inward currents, visible here in the absence of voluntary drive, whereas irregularly firing units may only respond to synaptic noise.
Key points
Muscles below a human spinal cord injury start to contract involuntarily a few weeks after trauma. The basis for this spontaneous activity is still unclear.
We show motor units in these muscles exhibited regular or irregular activity for several minutes. The regularly firing motor units had longer estimated afterhyperpolarisation potentials, higher mean firing rates and generated weaker forces.
These observations suggest that regularly firing motor units are more excitable than those that fire irregularly.
Spontaneous firing of motor units at regular rates may reflect active properties (such as persistent currents) within motoneurones, visible here in the absence of voluntary drive.
This basic motor unit firing behaviour may underlie the firing patterns typically recorded during voluntary contractions.
Introduction
Muscles paralysed by spinal cord injury are not always quiescent. These muscles start to contract involuntarily a few weeks after the injury. Many of the contractions are weak, occur in response to no obvious stimuli and involve spontaneous firing of motor units for long times at low frequencies. This kind of involuntary muscle contraction is commonly seen in hand muscles (Stein et al. 1990; Thomas & Ross, 1997; Zijdewind & Thomas, 2001; Gorassini et al. 2004; Zijdewind et al. 2012).
In our earlier study, two distinct patterns of spontaneous motor unit activity occurred in thenar motor units paralysed by spinal cord injury. Some units only fired sporadically during 2 min records. Other units fired at a mean steady rate of 6 Hz, with either low or high firing variability (Zijdewind & Thomas, 2001). This mean firing rate is low compared with those typically seen during weak, steady voluntary contractions (Matthews, 1996; Bawa & Murnaghan, 2009). The minimum firing frequency of a unit during steady firing is mainly determined by the duration of the post-spike afterhyperpolarisation (AHP) (Kernell, 1965, 2006, see discussion p. 110) and it is known to closely match the duration of the motor unit twitch (Bakels & Kernell, 1993). Whether there are changes in the intrinsic properties of spontaneously active motoneurones and motor units after human spinal cord injury is unclear. It is also unknown how often unit firing occurs at interspike intervals that are longer than the afterhyperpolarisation, rates at which the motoneurone is largely excited by synaptic noise (Person & Kudina, 1972; Matthews, 1996).
In the present study, our aim was to record long periods (30 min) of motor unit activity in thenar muscles paralysed by spinal cord injury. These extended recordings allowed us to analyse the long-term firing behaviour of these units, including the ways in which units started and stopped firing. If a unit began to fire without changing the activity of already active units, and stopped firing similarly, the intrinsic properties of its motoneurone must strongly influence unit recruitment and derecruitment. These data also make it possible to examine how units adapted their activity, and whether the firing of simultaneously active units covaried. The latter would suggest that units received common inputs. Further, we have used this long-term unit activity to estimate the time course of the post-spike afterhyperpolarisation of different motoneurones, as well as the force and contraction time of the same motor units. These data provide insight into basic motor unit firing behaviour that may underlie what is typically recorded during voluntary contractions.
Methods
Ethical approval
The University of Miami Institutional Review Board approved this study, which conformed to standards set by the Declaration of Helsinki (2008). Each subject gave informed written consent prior to participation. Thenar muscles of nine male spinal cord-injured subjects (mean age: 38 years, 12 SD) were studied. Injury details are given in Table 1. One hand of each subject was studied (n = 3 right, n = 6 left). When a subject had some voluntary control of the thenar muscles in both hands, the hand studied had the weakest thenar voluntary strength, as judged manually by an experimenter. If the thenar muscles in both hands were paralysed, the thenar muscles evaluated were those the subject reported were most likely to contract involuntarily.
Table 1.
Subject history
| Subject | Age (years) | Injury duration (years) | Cause | Level | Thenar voluntary control |
|---|---|---|---|---|---|
| 1 | 31 | 6 | Diving | C4 | − |
| 2 | 30 | 1 | Diving | C5 | − |
| 3 | 41 | 2 | Gunshot | C5 | − |
| 4 | 20 | 1 | Sport | C6 | − |
| 5 | 40 | 1 | Other | C6 | + |
| 6 | 27 | 5 | MVA | C6 | − |
| 7 | 55 | 9 | Diving | C6 | + |
| 8 | 42 | 7 | MVA | C7 | + |
| 9 | 53 | 15 | Fall | C7 | + |
Experimental set-up
As described previously (Thomas, 1997; Zijdewind & Thomas, 2001), the subject sat in their wheelchair with the test forearm supinated and supported in a vacuum cast. To stabilise the hand, thera-putty was molded around the hand and fingers and a metal plate was laid over the hand and strapped down with Velcro. The thumb was positioned against a custom-built transducer that registered isometric abduction and flexion forces. Braided, silver-coated, copper wire electrodes were used to record bipolar surface EMG from the thenar muscles. The common electrode was placed across the middle of the thenar muscles. The proximal electrode was placed across the base of the thenar eminence, while the distal electrode was placed across the metacarpal–phalangeal joint of the thumb. A ground electrode was situated proximal to the wrist. Intramuscular EMG was recorded using a custom-made monopolar tungsten microelectrode (0.2 mm diameter, 10–15 μm exposed tip, electrolytically sharpened to a diameter of 1–5 μm (Hagbarth & Vallbo, 1969).
Protocol
Each subject was given audio-visual feedback of the thenar EMG signals and they were asked to stop the firing of any active units. A motor unit that continued to fire after 10 s was considered to be spontaneously active. Throughout the experiment, subjects were instructed to remain relaxed and the EMG activity and force were recorded for 30 min (3 min samples, ∼10 s between recordings).
Data collection and analysis
Proximal and distal surface EMG, intramuscular EMG, DC force and AC force were filtered (0.03–1 kHz, 0.1–10 kHz, DC –100 Hz, 0.01–100 Hz, respectively) and sampled online (3.2 kHz, 12.8 kHz, 400 Hz, 400 Hz, respectively) using a SC/Zoom system (Umeå University, Sweden).
Motor unit firing patterns
Single motor units were identified based on the characteristic shapes of their potentials using amplitude and duration criteria. Motor unit identification was first performed automatically (Zoom software, Umeå University, Sweden). Thereafter, all motor unit potentials were visually checked and corrected manually. To verify that the recordings were from the same single motor unit, all the potentials for a given unit were overlaid to confirm the similar shapes. The proximal and distal surface EMGs associated with the potentials of a motor unit were averaged over ∼60 s and the different averages compared to verify motor unit identity further.
The time between potentials of a motor unit was measured and the instantaneous frequency was calculated as the inverse of the interspike interval (ISI). The mean, median, standard deviation and range of the interspike intervals were also calculated for each unit. The coefficient of variation (CV: SD of ISI/mean ISI) was calculated for a 60 s period during stationary firing (i.e. data within 30 s of recruitment and derecruitment were excluded). In addition, we calculated a measure of firing variability that only depends on adjacent intervals to avoid effects from slow differences in firing rate (Cv2, Holt et al. 1996). Cv2 equals the absolute ISI difference of two adjacent ISIs divided by the mean ISI of these two ISIs. Mean Cv2 was calculated for each unit.
For units that started and stopped firing during the recording, recruitment and derecruitment frequencies were calculated from the first and last interspike intervals, respectively. A unit was considered to be recruited at the first interspike interval shorter than 500 ms (Fuglevand et al. 2006). With time, some units continued to fire with interspike intervals >500 ms. Therefore, a unit was considered derecruited at the last interspike interval <1000 ms.
To quantify the increase in firing frequency after unit recruitment, we calculated: (1) the difference between recruitment frequency and the highest frequency in the first five ISIs (ISI 1–5); (2) the difference between the highest frequency in the first (ISI 1–5) and second five ISIs (ISI 6–10); and (3) the difference between the highest frequency in the first 10 (ISI 1–10) and second 10 ISIs (ISI 11–20). In addition, the time constant of the frequency–time plot was determined because firing frequency tended to plateau some time after recruitment.
Multiple units were active in some recordings. To assess the presence of common synaptic drive to co-active units, the mean firing frequency of each unit was calculated over consecutive 500 ms intervals. When firing was stationary, data from different units were plotted against each other. A significant association between the mean firing frequencies of two units indicated common drive (De Luca et al. 1982; Semmler et al. 1997; Gorassini et al. 2002; Mottram et al. 2009, 2010). To examine whether a common input initiated recruitment of a second unit, we calculated the mean firing rate of a regularly firing unit over 2 and 10 interspike intervals just before and after recruitment of a second motor unit. If recruitment of the new unit was caused by common input one would expect that the firing frequency of the regularly firing unit would be increased at and just after recruitment. The same analysis was done after derecruitment. If a decline in common input resulted in derecruitment of a unit, we expected that a concurrently active unit would also show a decline in firing frequency.
Estimation of motoneurone afterhyperpolarisation duration
The duration of the afterhyperpolarisation (AHP) of regularly firing motoneurones was estimated in two ways, with the interval histogram transform method (Matthews, 1996, 2002; MacDonell et al. 2007) and with the breakpoint method (Person & Kudina, 1972; Piotrkiewicz et al. 1999; Powers & Binder, 2000; Piotrkiewicz & Hausmanowa-Petrusewicz, 2011).
To estimate the AHP duration by the method described by Matthews (2002), interspike interval histograms were converted into an interval death rate plot. A death rate plot shows the probability that an interspike interval is ended by the initiation of a new spike. The plot grows with time because the size of the AHP declines with time, increasing the probability that a new action potential is initiated with time. Growth of the death rate plot stops at the end of the AHP because the membrane potential is in a steady state. The probability of initiating a new spike is then constant over time.
Two sets of calculations were used to estimate AHP duration using the breakpoint method. First, a running mean of nine ISIs was calculated during stationary firing. By slicing the interspike intervals from different times and combining intervals with similar mean intervals (bin size 10 ms, with 5 ms overlap) it was possible to increase the number of intervals for each bin. The plot of the mean firing frequency versus the standard deviation for all bins was fitted with two linear regression lines, one for data that showed low firing variability, the other when firing variability was high. The point at which the regression lines intersected gave an estimation of the AHP duration (Piotrkiewicz et al. 1999, 2007). Second, based on a technique described by Holt & colleagues (1996) as well as Piotrkiewicz & Hausmanowa-Petrusewicz (2011), the absolute difference between two adjacent ISIs and the mean ISI interval of the same two intervals were calculated. Similar mean interspike intervals were grouped (10 ms interval, with 5 ms overlap), the mean absolute difference for each 10 ms interval calculated, then plotted against the corresponding mean interval. The data were fitted with two linear regression lines and the intersection of these lines used to estimate the afterhyperpolarisation duration (for details see Piotrkiewicz & Hausmanowa-Petrusewicz, 2011).
Estimation of unit force
Spike triggered averaging was used to measure the abduction and flexion forces for each unit (Stein et al. 1972; Milner-Brown et al. 1973). Data only contributed to the average when the interspike intervals were longer than 200 ms. Use of long interspike intervals minimized the amount of force summation and thus errors in the estimate of the motor unit twitch force. Abduction and flexion forces were measured from onset to peak force and the resultant twitch force was calculated. Contraction time was the time from force onset to peak. For some of the units the force was too weak to be measured accurately (n = 6).
Statistics
Associations between the AHP duration estimates using different methods, as well as the contraction time and mean interspike intervals, were analysed using linear regression analysis. Common drive to simultaneously active units was evaluated by looking for significant associations between the mean firing frequencies of pairs of units over 500 ms intervals. To assess whether common drive contributed to a unit starting to fire and stopping, firing rates of active units were compared before and after recruitment (derecruitment) of a new unit using paired t tests. Differences in the mean, median firing frequency and estimated AHP duration for regularly and irregularly firing motor units were assessed with a unpaired Student's t test; differences in maximal firing frequency and motor unit force were assessed with a Mann–Whitney U test (distribution of the data was significantly different from a normal distribution). Statistical significance was set at P ≤ 0.05. The firing rate (Y)–time (X) relation after unit recruitment was fitted with an exponential function (exponential rise to max; Y = a(1 − e−bX). The relation between unit firing rate (Y) and time (X) before derecruitment was fitted with a linear function (Y = a + bX).
Results
Motor unit activity was either sporadic (a few spikes dispersed amongst long periods of rest) or sustained over a long time. For 33 units that showed sustained firing, we analysed unit firing for more than 500 spikes or 10 min. The average number of identified action potentials per unit was 3690 (3366 SD, median 3026). Motor unit firing variability was very different between units (Fig. 1). Motor units were arbitrarily divided into two groups on the basis of their firing variability (see Zijdewind & Thomas, 2001). This division corresponded to the first break in the distribution of both CV and Cv2 (Fig. 1E). Use of CV and Cv2 gave similar results with one exception. All motor units with a Cv2 >0.16 also had a CV >0.16 (Zijdewind & Thomas, 2001) and were labelled as units showing irregular firing (median Cv2 and CV: 0.6, n = 14). Most units having a Cv2 ≤0.15 (n = 19) also had a CV ≤0.15 (n = 18) and were labelled as regularly firing units. One unit had a Cv2 of 0.11 but a CV of 0.158. This unit was also labelled as a regularly firing unit (median Cv2 0.07; range, range 0.03–0.11; median CV 0.08; range, 0.05–0.158, n = 19).
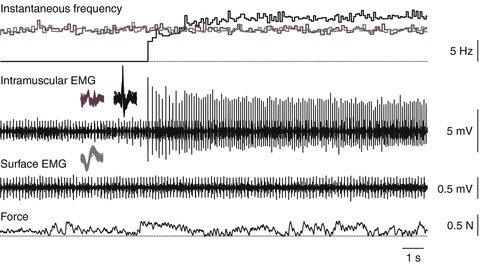
Figure 1. Regular and irregular sustained motor unit firing.
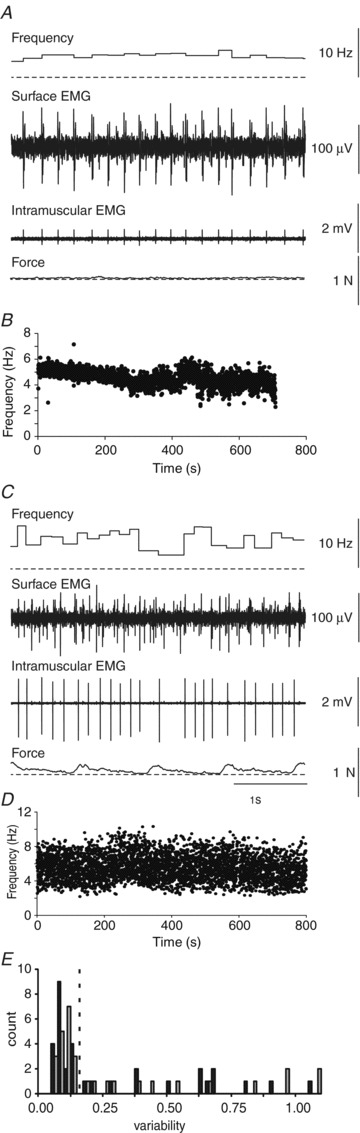
Instantaneous firing frequency, surface EMG, intramuscular EMG and force from a regularly (A) and irregularly firing unit (C) from subject 6 who had completely paralysed thenar muscles. B and D show motor unit firing frequencies for the respective units for more than 10 min. Note the highly variable firing frequency of the second unit (D, CV 0.27, Cv2 0.26) compared with the first unit (B, CV 0.12, Cv2 0.07). E, distribution of two measures of unit firing variability: CV (SD of ISIs/mean ISIs; open bars); and mean Cv2: (2*[ISIi+1– ISIi])/[ISIi+1+ ISIi]) for all units that could be followed for more than 500 spikes or 10 min. The dashed line represents the separation between regularly and irregularly firing units.
Regularly firing units had low recruitment and derecruitment frequencies and slow frequency increases
Units were activated by a spasm, by contraction of muscles other than thenar muscles (e.g. by the subject changing their hand position or repositioning in their wheelchair) or by no obvious trigger. Units that started firing had low recruitment frequencies (mean 3.6 Hz, 1.2 SD; n = 7, see Table 2) compared with voluntarily recruited units in individuals with SCI (mean, 5.6 Hz; 2.7 SD; Zijdewind & Thomas, 2003). Relatively slow increases in firing frequency occurred after unit recruitment (Fig. 2A–D). The time constant of the frequency–time plot varied between 0.5 and 3.2 s (mean 1.5, 0.8 SD). The largest increase in frequency occurred in the first five ISIs (2.1 pps, 1.4 SD), followed by smaller increases (second 5 ISIs: 1.1 pulses s−1, 1.0 SD). Thus, the frequency almost doubled in the first 10 ISIs (3.3 pulses s−1, 1.2 SD) with more gradual increases in the next 10 ISIs (11–20: 1.7 pulses s−1, 1.2 SD) when a plateau in firing rate was reached (increase in next ISIs 21–30: –0.4 pulses s−1, 1.2 SD). Of interest, units that were activated several times during an experiment reached remarkably similar plateaus in firing frequency (Fig. 2B–D). The average firing rate of the regularly firing units was 6.7 Hz with a mean maximal firing frequency of 10.2 Hz (see Table 2).
Table 2.
Motor unit firing behaviour and properties
| Regularly firing units Mean, SD median (range) | Irregularly firing units Mean, SD median (range) | ||
|---|---|---|---|
| Overall mean firing frequency (Hz) | 6.7, 1.5 6.7 (4.6–9.4) | 5.1, 2.0 4.9 (1.1–8.8) | P = 0.01 |
| Median firing frequency (Hz) | 6.7, 1.5 6.6 (4.6–9.4) | 4.6, 2.2 4.2 (0.5–8.5) | P = 0.002 |
| Firing frequency, 25 percentile (Hz) | 6.1, 1.3 6.1 (4.1–8.7) | 3.0, 2.1 2.2 (0.2–6.7) | P < 0.001 |
| Firing frequency, 75 percentile (Hz) | 7.3, 1.9 7.1 (5.0–10.4) | 6.6, 2.2 7.0 (1.4–10.5) | n.s. |
| Maximum frequency (Hz) | 10.2, 2.3 9.5 (7.5–15.4) | 26.9, 24.6 15.8 (10.3–86.5) | P = 0.001 (Wilcoxen) |
| Recruitment frequency (Hz) | 3.6, 1.2 3.8 (2.1–5.5) | * | |
| Derecruitment frequency (Hz) | 3.3, 1.6 2.9 (1.6–7.2) | * | |
| CV | 0.08, 0.03 0.08 (0.05–0.158) | 0.71, 0.5 0.58 (0.2–2.14) | |
| Cv2 | 0.07, 0.02 0.07 (0.03–0.11) | 0.55, 0.2 0.62 (0.16–1.05) | |
| Estimated AHP duration (ms) | |||
| Death rate plot | 158, 35 115 (105–240) | * | |
| Breakpoint analysis | 161, 28 162 (120–205) | 132, 27 127 (100–195) | P = 0.016 |
| Adapted breakpoint analysis | 160, 27 167 (117–210) | 132, 31 132 (97–195) | P = 0.022 |
| Unit force (mN) | 11.4, 14.1 4.9 (2.7–50.1) | 99.6, 107.0 27.5 (13.1–302.9) | P = 0.001 (Wilcoxen) |
Recruitment and derecruitment frequency could not be obtained for the irregularly firing units. Often interspike intervals exceeded 1000 ms for only 2–3 intervals, then were followed by shorter intervals.
Figure 2. The first 30 s of motor unit activity.
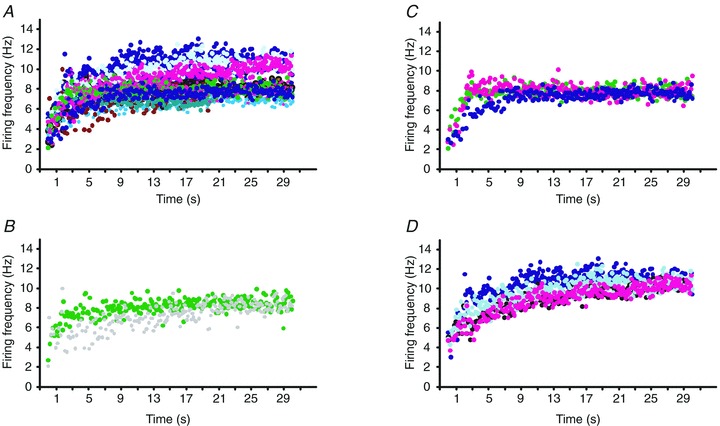
A, all contractions (n = 13) from one subject in which the start of unit firing could be followed in different units (each contraction a different colour in the online version). Three different units, from this subject, in which the start of firing could be followed during several contractions (B, unit 1 during 2 contractions, each contraction shown in a different colour in the online version; C, unit 2 during 3 contractions; and D, unit 3 during 4 contractions). Note the similar time–frequency plots for a given unit.
Units stopped firing in one of two ways. After reaching a plateau in firing, half of the units (7/14 units) showed a slow but progressive decline in firing rate until derecruitment (Fig. 3A), whereas the other units fired at a more constant rate and only decreased their firing rate within 20 s of derecruitment (Fig. 3B). At derecruitment, firing frequencies were low ((3.3, 1.6 Hz SD, n = 15; see Table 2, Fig. 3) compared with the rates of units that were under voluntary control after SCI (5.2 Hz, 2.0 SD; Zijdewind & Thomas, 2003).
Figure 3. Derecruitment of motor units.
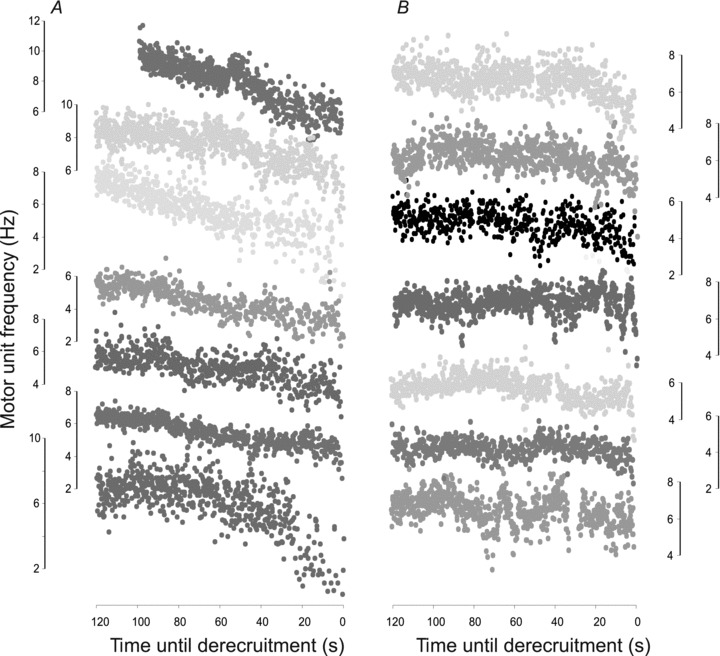
A, all units that showed a progressive decline in firing rate before derecruitment (n = 7). B, all units that maintained their firing frequency until 20 s before derecruitment. X-axes are time-shifted such that units are derecruited at 0 s. The frequency scale (Y-axis) for each unit is presented beside the corresponding data.
Independent initiation and termination of activity in pairs of regularly firing units
Units were active for different times (128–1577 s). Figure 4 shows the progressive recruitment of four units that exhibited sustained firing. One unit started firing three times, either before or after the other three units began to fire. Similarly, this same unit stopped firing before, and in some cases after, the other units. This reversal of motor unit recruitment and derecruitment order was seen often. A change in recruitment and derecruitment order was observed in more than half of the nine pairs (n = 5) in which we could follow both recruitment and derecruitment.
Figure 4. Initiation, termination and sustained firing of units.
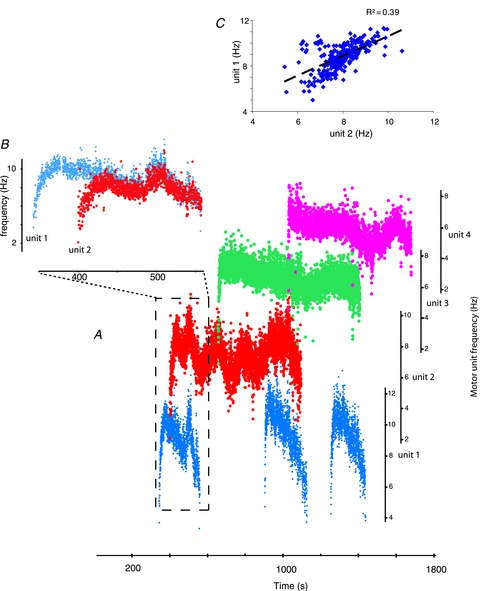
A, recruitment of 4 units. Note that the recruitment order of the first and second unit is changed during the second period of simultaneous activation whereas derecruitment order changes for the first and third unit during the second period of coactivation. B, enlarged time scale of recruitment of unit 1 and 2 from boxed area in A. Note that no increase in the firing frequency of the first unit was seen during recruitment of the second unit but the firing rate of both units declined simultaneously suggesting common inputs drive coactive units. C, rate–rate plot for all periods when the two units shown in B were coactive.
Figure 5 shows sustained firing for three units. The firing behaviour of two of the units was unchanged when the third unit began to fire. For 16 motor unit pairs the start and/or stop of sustained activity was probably not due to common input because the mean firing rate over 2 or 10 ISIs before and after recruitment of a second unit was not significantly different (n = 13; before recruitment, 8.5 Hz (1.7 SD; 2 ISI) and 8.3 Hz (1.4 SD; 10 ISI); after recruitment, 8.2 Hz (1.6 SD, 2 ISI) and 8.0 Hz (1.3 SD, 10 ISI)). Similarly, no significant difference was observed in the mean firing frequency before versus after derecruitment of a unit (n = 16; before derecruitment, 6.5 Hz (1.5 SD) and 6.6 Hz (1.5 SD); after derecruitment, 6.7 Hz (1.6 SD) and 6.6 Hz (1.5 SD)). However, once active for sustained periods, most pairs of units shared common inputs because the firing frequencies were positively related (n = 9/16; e.g. Fig. 4C). Of the unit pairs that showed a positive correlation, three pairs showed a strong correlation (R2 > 0.5), and six pairs a medium correlation (0.1 > R2 < 0.45, all P < 0.001). One unit pair showed a negative correlation. The other pairs showed no significant correlation (R2 < 0.1).
Figure 5. Coactive units.
Instantaneous frequency, intramuscular EMG, surface EMG and force (top to bottom) to show sustained firing of three motor units. Two units fire regularly at 7.2 Hz, both before and after recruitment of a third unit that gradually increased its firing rate over several seconds to fire regularly at 10.3 Hz.
Behaviour of irregularly firing units
Irregularly firing units had lower mean and median firing rates, but higher maximal firing rates than regularly firing units (see Table 2). The five pairs of irregularly firing units that were coactive showed weak or no correlation between their firing frequencies (R2 < 0.1), suggesting lack of common inputs.
Estimated AHP analysis
To estimate the afterhyperpolarisation duration of the motoneurones with the method described by Matthews (1996), units have to fire relatively regularly at different rates. Thus, only regularly firing units were included in this analysis. The estimated AHP duration averaged 158 ms (35 SD, n = 16 units). The estimated AHP durations were strongly correlated to the median ISI of the spontaneously active units (R2= 0.89; P < 0.001, Fig. 6D). As recordings also have to include units firing close to their threshold for spike initiation, which will result in a frequency distribution with a tail of longer interspike intervals, two regularly firing units were excluded from AHP analysis because their frequency distribution was close to normal (skew for the other units >1.0, see Powers & Binder, 2000). One unit had too few data points for the AHP analysis.
Figure 6. Motoneurone properties.
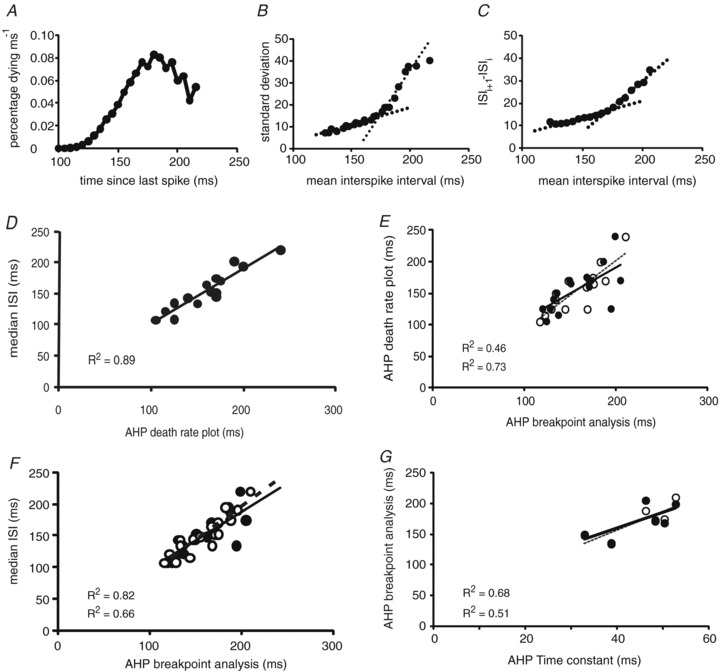
A–C, example of the different analysis used to estimate the afterhyperpolarisation duration (AHP) for the same unit (A, death rate plot, estimated AHP: 170 ms; B, breakpoint analysis, estimated AHP: 173.2 ms; C, adapted breakpoint analysis: 171.3 ms). D, relation between median interspike intervals and estimated AHP duration using death rate analysis (see A for example). E, relation between AHP duration estimates using death rate and breakpoint analysis (filled circles and continuous line (R2= 0.46), data determined according to Piotrkiewicz et al. 1999, see B for example; open circles and dashed line (R2= 0.73) represent data obtained using the adapted analysis of Piotrkiewicz & Hausmanowa-Petrusewicz, 2011, see C for example). F, relation between median interspike intervals and estimated AHP duration using breakpoint analysis (R2= 0.66 and R2= 0.82 for the breakpoint analysis and the adapted breakpoint analysis, respectively; for symbols and lines, see E). G, AHP duration estimates (for symbols and lines, see E) in relation to the estimated AHP time constant (R2= 0.51 and R2= 0.68 for the breakpoint analysis and the adapted breakpoint analysis). Several data points overlap.
With the breakpoint analysis the mean values for the AHP estimates for regularly firing units were 161 ± 28 ms (Piotrkiewicz et al. 1999) and 160 ± 27 ms (adapted method, Piotrkiewicz & Hausmanowa-Petrusewicz, 2011). These estimated AHP durations also showed a strong correlation with the median ISI (R2= 0.66 and R2= 0.82 (adapted method); P = 0.001, Fig. 6F). AHP durations estimated using the death rate and breakpoint analyses were significantly correlated with each other (R2= 0.46 and R2= 0.73 (adapted method); P < 0.01, Fig. 6E). As an example, estimated AHP duration for one unit was 170 ms, 173 ms and 171 ms for the death rate plot, breakpoint and adapted breakpoint analysis, respectively (Fig. 6A–C).
Interestingly, unit firing behaviour varied with estimated AHP duration. Units in which the firing rate declined progressively before derecruitment (Fig. 3A) had median ISIs that were longer than the estimated AHP duration (mean difference: estimated AHP – median ISI: –4 ms, range: –1 to –9 ms, death rate analysis). These units also had a long time constant for the frequency–time relation at recruitment (1.4, SD 0.3). In comparison, units that fired at a constant frequency and reduced their firing rates just before derecruitment (Fig. 3B) had median ISIs that were shorter than the estimated AHP duration (mean difference: estimated AHP – median ISI: 15 ms, range: 5–26 ms) and a shorter time constant (0.7, SD 0.2; P = 0.03) at recruitment.
The firing behaviour of most irregularly firing units was too erratic to estimate the AHP duration. For the seven units where estimation was possible using conventional breakpoint analysis, firing variability was still large compared with the regularly firing units which probably resulted in an overestimation of the AHP. Yet the mean AHP estimate for the irregularly firing units was significantly shorter (see Table 2) than that for the regularly firing units.
Motor unit forces
The twitch forces of regularly firing units were usually weaker than those of irregularly firing units (Fig. 7A and B). On average, the irregularly firing units were the strongest units (Table 2, Fig. 7C).
Figure 7. Motor unit forces.
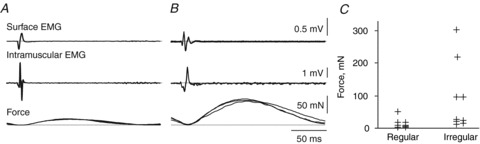
Overlays (n = 3) of averaged surface EMG, intramuscular EMG and force (top to bottom) of a regularly firing unit (A) and irregularly firing unit (B). Reproducibility of the data for each unit is shown by averages of all traces or every alternate trace (A, average of 210 or 105 traces; B, average of 18 or 9 traces). C, twitch forces for regularly and irregularly firing units.
In one subject, recruitment frequency was inversely related to the twitch contraction time (R2= 0.70, P = 0.07, n = 5 units). This result, and the estimated AHP duration and force differences for units with regular versus irregular firing, demonstrate some of the expected relationships between the firing properties of the motoneurones and the mechanical properties of the motor units.
Discussion
Our data show that thenar motor units fired regularly or irregularly for long periods of time without conscious voluntary drive after SCI. These units started and stopped firing independently of each other, suggesting the importance of intrinsic motoneurone properties in recruitment and derecruitment. However, once active, most units shared some common inputs as their firing frequencies often covaried. The subset of regularly firing units that showed a progressive decline in discharge rate before derecruitment fired steadily with interspike intervals that were longer than their estimated AHP duration. The converse was found for regularly firing units with more abrupt frequency decreases before derecruitment. Their interspike intervals were shorter than their estimated AHP duration, which may reflect receipt of additional inputs. Overall, regularly firing units had longer estimated AHPs and were weaker than irregularly firing units, properties expected of lower threshold units.
Regular motor unit firing probably reflects persistent currents in motoneurones
The regular firing behaviour of units may reflect activation of persistent inward currents, as suggested by data from Bennett and colleagues (Li et al. 2004). They showed that 5-HT2C (serotonin) receptors on rat motoneurones are upregulated after injury, and increase spinal excitability (Harvey et al. 2006; Li et al. 2007). Serotonin is an important neurotransmitter that brings the motoneurone close to threshold for action potential generation. 5-HT also amplifies synaptic current by adding persistent sodium and calcium currents (Hounsgaard et al. 1988; Hultborn et al. 2003; Li et al. 2004). Additional depolarising synaptic currents then easily induce motoneurone activation that is long lasting because of slowly inactivating calcium currents (Li et al. 2004) (see for reviews: Heckmann et al. 2003, 2005). This sustained firing behaviour may be facilitated by long-duration excitatory post-synaptic potentials in motoneurones after spinal cord injury (Norton et al. 2008), or by constitutive activation of 5-HT2C receptors after injury in the absence of 5-HT (Murray et al. 2010). Descending brainstem fibres that commonly provide 5-HT to spinal motoneurons (Okado et al. 1991) probably also contribute to the maintenance of sustained motor unit activity in those subjects that retain some voluntary control over their thenar muscles after injury.
A slow decline in motor unit firing frequency distinguishes some regularly firing units
We suggest that our regularly firing motor units have relatively low recruitment thresholds but exhibit different long-term firing behaviour. The subset of units that showed a slow progressive decline in frequency before derecruitment had regular interspike intervals that were longer than their afterhyperpolarisation and had a slow increase in frequency at recruitment (mean time constant, 1.4, 0.3 SD). Similar slow firing rates (ISI longer than the afterhyperpolarisation) with low rate variability have been observed in rat motoneurones after chronic spinal injury (Li et al. 2004). This slow firing was shown to be related to repeated activation of a persistent sodium current at subthreshold levels. Deactivation of the sodium current by the afterhyperpolarisation was followed by reactivation of the sodium current. This behaviour could still be seen after blockage of persistent calcium currents (Li et al. 2004). If our regularly firing units with slow declines in rate are also repeatedly activated on the basis of this sodium current, our data suggest that this current is progressively declining with time. The origin of the reactivating current is unclear. It could be a persistent calcium current or a lingering synaptic current, as suggested for stroke patients (Mottram et al. 2010). The other half of the regularly firing units probably received extra input as they maintained a steady firing rate until just before derecruitment. Their ISIs were shorter than their estimated AHP duration, and their frequency–time constant at recruitment was also shorter (mean time constant 0.7, 0.2 SD).
We propose that the irregularly firing motor units are higher threshold units. It must be stressed that these units do continue to fire for long periods of time but with highly variable interspike intervals (Fig. 1D). These units may not receive enough synaptic input to activate persistent currents or to bring the motoneurone above threshold consistently. Thus, these units probably fire on the basis of synaptic noise such that the occasional input brings them just above threshold for spike initiation without enabling them to fire steadily with low variability. It is possible that mechanisms such as sprouting of central axons induces relative large excitatory postsynaptic potentials (Norton et al. 2008), resulting in a few action potentials but the duration of the input is too short to fully activate persistent inward currents and regular firing. The strong forces produced by these irregularly firing units (Fig. 7) are also consistent with the properties of higher threshold motor units (see for reviews: Henneman & Mendell, 1981; Kernell, 2006).
Unit recruitment and derecruitment probably depends on intrinsic motoneurone properties
Units generally started and stopped firing independently of each other, in support of the idea that the initiation of sustained firing relies more on intrinsic motoneurone properties than common synaptic inputs. We consider the ability to generate persistent currents (i.e. the presence of the appropriate ion channels) an example of an intrinsic motoneurone property. However, modulation of these currents depends on extrinsic sources, such as monoamines. In rats, constitutive activation of 5-HT2C receptors also occurs after spinal cord damage (Murray et al. 2010).
Reversals of recruitment and derecruitment occurred frequently between units close in threshold (Fig. 4). This behaviour may be elicited by activation or deactivation of persistent currents at different rates, or may reflect time-related differences in intrinsic motoneurone properties such as spike frequency adaptation or accommodation (see Revill & Fuglevand, 2011 for simulation of how these properties contribute to motor unit firing).
Furthermore, synaptic input is likely to be important. A modest increase in synaptic drive may recruit a new unit, and prevent any reduction in the firing frequency of already active units due to spike-frequency adaptation (Bawa & Murnaghan, 2009).
In 5 out of 9 motor unit pairs (56%) evaluated here, the unit that was recruited first was also derecruited first (see also Fig. 4). In comparison, reanalysis of data obtained from SCI subjects by Zijdewind & Thomas (2001) showed that these reversals were less common in motor units under voluntary control (25% of the unit pairs). However, if we also included units that could be activated voluntarily but could not be deactivated voluntarily (i.e. units that showed sustained activation after the contraction), 45% (15/33 pairs) of the motor unit pairs showed reversals (i.e. the earlier recruited unit was derecruited first). These data illustrate that intrinsic motoneurone properties are an important determinant of motor unit derecruitment.
Once active, units were still responsive to additional synaptic input, as are rat motoneurones that fire on the basis of a persistent current (Li et al. 2004). Most pairs of regularly firing units showed covariation in firing rates (Fig. 4), which is indicative of common inputs (Semmler et al. 1997; De Luca & Erim, 2002; Mottram et al. 2009, 2010). It is possible that the covariation in firing rates is also due to local changes in monoamines. The amount of covariation during the involuntary contractions evaluated here was less (maximal R2= 0.59) than reported for control subjects (R2= 0.78, 0.06 SD; Mottram et al. 2009) during voluntary ramp contractions. However, the range of motor unit firing frequencies is larger during voluntary contractions, which will result in an increased correlation coefficient.
Comparison of motoneurone and motor unit properties
Two different methods provided similar estimates for the AHP durations of the motoneurones. The values we obtained from the death rate analysis were equivalent or larger than data from soleus units (Matthews, 1996) or first dorsal interosseus muscle (Gossen et al. 2003) in control subjects. The breakpoint analysis also resulted in longer estimates for the AHP durations than obtained for hand or upper arm muscles in control subjects (Tokizane & Shimazu, 1964; Piotrkiewicz et al. 2007; Piotrkiewicz & Hausmanowa-Petrusewicz, 2011). All of these results suggest that the properties of the motoneurones have changed towards slower type after SCI.
The low recruitment frequencies of all units also raise the issue of whether the properties of the muscle fibres have slowed. This suggestion is consistent with the slowing of muscle contractile properties that results from extra periods of stimulation (Kernell et al. 1987; Czeh et al. 1978) and the slower contraction times (but not relaxation times) of chronically paralysed whole thenar muscles and motor units (Thomas, 1997; Yang et al. 1990; Hager-Ross et al. 2006) or spastic plantar flexor muscles (Hidler et al. 2002). Changes in calcium regulation or chronic use of baclofen may also contribute to these differential effects on contractile speed (Baar, 2005; Thomas et al. 2010).
Our data also show that units firing for sustained periods exhibit motoneurone and motor unit properties that are appropriate for their firing behaviour. Irregularly firing units were stronger than regularly firing units, and had shorter estimated AHP durations and frequency–time constants. Irregularly firing units were also stronger than paralysed motor units in SCI subjects that were not active involuntarily (2.0–69.7 mN, data obtained by intraneural motor axon stimulation (Hager-Ross et al. 2006) and units of control subjects (2.5–31.8 mN, Thomas et al. 1990)). Part of the increase in unit strength after spinal cord injury may reflect increases in muscle stiffness, changes in calcium regulation and/or motor axon sprouting subsequent to motoneurone death (Yang et al. 1990; Howell et al. 1997; Griffin et al. 2002; Thomas et al. 2002). It is unlikely that the force differences reflect issues with spike triggered averaging. Only recordings in which the interspike intervals of a motor unit were longer than 200 ms were included in our force averages. Thus, force reductions due to twitch fusion were minimal (Häger-Ross et al. 2006). Furthermore, the forces produced by the strong units were evident without averaging.
Sustained motor unit firing is involuntary
Several observations indicate that the sustained motor unit activity was involuntary. Units in completely paralysed muscles fired regularly or irregularly for sustained periods (Fig. 1). The unit firing could not be stopped voluntarily even though all subjects were instructed to relax and to stop the unit activity. Units started and stopped firing at very low firing rates, behaviour not observed in units under voluntary control (Kiehn & Eken, 1997; Matthews, 2002; Zijdewind & Thomas, 2003; Bawa & Murnaghan, 2009). The start and stop of motor unit firing was not correlated with changes in the firing rate of other active motor units. Changes in recruitment order were seen more often than expected in units under voluntary control. Furthermore, the gradual increase in firing rate over 20 ISIs (∼3 s) is not seen when able-bodied subjects activate motor units voluntarily unless they are provided with feedback of the unit activity (Kiehn & Eken, 1997; Hornby et al. 2002; Mottram et al. 2009).
Spontaneous, involuntary motor unit activity is distinct from muscle spasms
Spontaneous motor unit activity typically involves weak contractions (often unnoticed by subjects) that have no obvious trigger, although the sustained firing can be activated by spasms or voluntary contractions. In some cases the sustained unit firing can also be affected by stimuli (Zijdewind & Thomas, 2001). In contrast, spasms often involve strong contractions. They usually vary much more in intensity and duration. Spasms are easy to initiate using various stimuli such as light touch of the skin or passive movement of a limb. Furthermore, spasms can be dampened or stopped to some extent by various manoeuvres like a change in joint angle (Kawamura et al. 1989; Little et al. 1989; Thomas & Ross, 1997).
Functional implications
Our data show that thenar motor units fire regularly or irregularly for long periods after cervical SCI. These firing patterns probably represent intrinsic motoneurone properties and provide a baseline output on which afferent and descending inputs are superimposed. This activity largely goes unnoticed because most the contractions are weak. Nevertheless, the maximal firing rates of the spontaneously active units were higher than those recorded during maximal voluntary contractions for three SCI subjects who participated in both this study and a previous one (13.6 ± 6.4 Hz versus 10.7 ± 3.6 Hz, respectively; Zijdewind & Thomas, 2003). Therefore the factors driving spontaneous unit firing after spinal cord injury are more effective at increasing the firing rate than maximal voluntary drive. In terms of force, estimates from intraneural stimulation data suggest that the spontaneously active units would produce 67% of their maximal force at 13 Hz, on average, whereas the voluntarily activated units would generate only 58% of their maximal force at 11 Hz (Hager-Ross et al. 2006). Muscle properties may be maintained better with more use (Pierotti et al. 1991) although it is also feasible that this sustained firing of units may weaken and slow muscles (Kernell et al. 1987; Gordon et al. 1997). That the motor units remain excitable means they could be stimulated electrically to produce functional behaviours. It is also clear that more input is needed to activate the stronger spontaneously active units that fire irregularly. This may trigger spasms and disrupt function. However, if activation of these stronger units could be coupled with voluntary drive (Zijdewind et al. 2012), the increase in force may facilitate use of hand muscles, a function that most people with cervical SCI want to improve (Anderson, 2004).
Acknowledgments
The authors thank Dr Daniel Kernell for comments on the manuscript. This research was funded by the University Medical Centre Groningen, National Institutes of Health grant NS-30226, and The Miami Project to Cure Paralysis.
Glossary
Abbreviations
- AHP
afterhyperpolarisation
- CV
coefficient of variation
- Cv2
coefficient of variation of 2 adjacent interspike intervals
- ISI
interspike interval
- MVC
maximal voluntary contraction
- SCI
spinal cord injury
Author contributions
Experiments were performed at The Miami Project to Cure Paralysis. Both authors contributed to the design of the experiments, data collection, analysis and writing the article, and both approved the final version.
References
- Anderson KD. Targeting recovery: priorities of the spinal cord-injured population. J Neurotrauma. 2004;21:1371–1383. doi: 10.1089/neu.2004.21.1371. [DOI] [PubMed] [Google Scholar]
- Baar K. New dimensions in tissue engineering: possible models for human physiology. Exp Physiol. 2005;90:799–806. doi: 10.1113/expphysiol.2005.031377. [DOI] [PubMed] [Google Scholar]
- Bakels R, Kernell D. Matching between motoneurone and muscle unit properties in rat medial gastrocnemius. J Physiol. 1993;463:307–324. doi: 10.1113/jphysiol.1993.sp019596. [DOI] [PMC free article] [PubMed] [Google Scholar]
- Bawa P, Murnaghan C. Motor unit rotation in a variety of human muscles. J Neurophysiol. 2009;102:2265–2272. doi: 10.1152/jn.00278.2009. [DOI] [PubMed] [Google Scholar]
- Czeh G, Gallego R, Kudo N, Kuno M. Evidence for the maintenance of motoneurone properties by muscle activity. J Physiol. 1978;281:239–252. doi: 10.1113/jphysiol.1978.sp012419. [DOI] [PMC free article] [PubMed] [Google Scholar]
- De Luca CJ, Erim Z. Common drive in motor units of a synergistic muscle pair. J Neurophysiol. 2002;87:2200–2204. doi: 10.1152/jn.00793.2001. [DOI] [PubMed] [Google Scholar]
- De Luca CJ, LeFever RS, McCue MP, Xenakis AP. Behaviour of human motor units in different muscles during linearly varying contractions. J Physiol. 1982;329:113–128. doi: 10.1113/jphysiol.1982.sp014293. [DOI] [PMC free article] [PubMed] [Google Scholar]
- Fuglevand AJ, Dutoit AP, Johns RK, Keen DA. Evaluation of plateau-potential-mediated ‘warm up’ in human motor units. J Physiol. 2006;571:683–693. doi: 10.1113/jphysiol.2005.099705. [DOI] [PMC free article] [PubMed] [Google Scholar]
- Gorassini M, Yang JF, Siu M, Bennett DJ. Intrinsic activation of human motoneurons: reduction of motor unit recruitment thresholds by repeated contractions. J Neurophysiol. 2002;87:1859–1866. doi: 10.1152/jn.00025.2001. [DOI] [PubMed] [Google Scholar]
- Gorassini MA, Knash ME, Harvey PJ, Bennett DJ, Yang JF. Role of motoneurons in the generation of muscle spasms after spinal cord injury. Brain. 2004;127:2247–2258. doi: 10.1093/brain/awh243. [DOI] [PubMed] [Google Scholar]
- Gordon T, Tyreman N, Rafuse VF, Munson JB. Fast-to-slow conversion following chronic low-frequency activation of medial gastrocnemius muscle in cats. I. Muscle and motor unit properties. J Neurophysiol. 1997;77:2585–2604. doi: 10.1152/jn.1997.77.5.2585. [DOI] [PubMed] [Google Scholar]
- Gossen ER, Ivanova T, Garland SJ. The time course of the motoneurone afterhyperpolarization is related to motor unit twitch speed in human skeletal muscle. J Physiol. 2003;552:657–664. doi: 10.1113/jphysiol.2003.048132. [DOI] [PMC free article] [PubMed] [Google Scholar]
- Griffin L, Godfrey S, Thomas CK. Stimulation pattern that maximizes force in paralyzed and control whole thenar muscles. J Neurophysiol. 2002;87:2271–2278. doi: 10.1152/jn.2002.87.5.2271. [DOI] [PubMed] [Google Scholar]
- Hagbarth K-E, Vallbo AB. Single unit recordings from muscle nerves in human subjects. Acta Physiol Scand. 1969;76:321–334. doi: 10.1111/j.1748-1716.1969.tb04475.x. [DOI] [PubMed] [Google Scholar]
- Hager-Ross CK, Klein CS, Thomas CK. Twitch and tetanic properties of human thenar motor units paralyzed by chronic spinal cord injury. J Neurophysiol. 2006;96:165–174. doi: 10.1152/jn.01339.2005. [DOI] [PubMed] [Google Scholar]
- Harvey PJ, Li X, Li Y, Bennett DJ. 5-HT2 receptor activation facilitates a persistent sodium current and repetitive firing in spinal motoneurons of rats with and without chronic spinal cord injury. J Neurophysiol. 2006;96:1158–1170. doi: 10.1152/jn.01088.2005. [DOI] [PMC free article] [PubMed] [Google Scholar]
- Heckmann CJ, Gorassini MA, Bennett DJ. Persistent inward currents in motoneuron dendrites: implications for motor output. Muscle Nerve. 2005;31:135–156. doi: 10.1002/mus.20261. [DOI] [PubMed] [Google Scholar]
- Heckman CJ, Lee RH, Brownstone RM. Hyperexcitable dendrites in motoneurons and their neuromodulatory control during motor behavior. Trends Neurosci. 2003;26:688–695. doi: 10.1016/j.tins.2003.10.002. [DOI] [PubMed] [Google Scholar]
- Henneman E, Mendell LM. Handbook of Physiology. 1981. Functional organization of motoneuron pool and its inputs; pp. 423–507. section I, volume II; section editors JM Brookhart, VB Mountcastle, volume editor: VB Brooks Americal Physiological Society, Bethesda, Maryland. [Google Scholar]
- Hidler JM, Harvey RL, Rymer WZ. Frequency response characteristics of ankle plantar flexors in humans following spinal cord injury: relation to degree of spasticity. Ann Biomed Eng. 2002;30:969–981. doi: 10.1114/1.1500409. [DOI] [PubMed] [Google Scholar]
- Holt GR, Softky WR, Koch C, Douglas RJ. Comparison of discharge variability in vitro and in vivo in cat visual cortex neurons. J Neurophysiol. 1996;75:1806–1814. doi: 10.1152/jn.1996.75.5.1806. [DOI] [PubMed] [Google Scholar]
- Hornby TG, McDonagh JC, Reinking RM, Stuart DG. Motoneurons: a preferred firing range across vertebrate species? Muscle Nerve. 2002;25:632–648. doi: 10.1002/mus.10105. [DOI] [PubMed] [Google Scholar]
- Hounsgaard J, Hultborn H, Jespersen B, Kiehn O. Bistability of alpha-motoneurones in the decerebrate cat and in the acute spinal cat after intravenous 5-hydroxytryptophan. J Physiol. 1988;405:345–367. doi: 10.1113/jphysiol.1988.sp017336. [DOI] [PMC free article] [PubMed] [Google Scholar]
- Howell S, Zhan WZ, Sieck GC. Diaphragm disuse reduces Ca2+ uptake capacity of sarcoplasmic reticulum. J Appl Physiol. 1997;82:164–171. doi: 10.1152/jappl.1997.82.1.164. [DOI] [PubMed] [Google Scholar]
- Hultborn H, Denton ME, Wienecke J, Nielsen JB. Variable amplification of synaptic input to cat spinal motoneurones by dendritic persistent inward current. J Physiol. 2003;552:945–952. doi: 10.1113/jphysiol.2003.050971. [DOI] [PMC free article] [PubMed] [Google Scholar]
- Kawamura J, Ise M, Tagami M. The clinical features of spasms in patients with a cervical cord injury. Paraplegia. 1989;27:222–226. doi: 10.1038/sc.1989.33. [DOI] [PubMed] [Google Scholar]
- Kernell D. The limits of firing frequency in cat lumbosacral motoneurones possessing different time course of afterhyperpolarization. Acta Physiol Scand. 1965;65:87–100. [Google Scholar]
- Kernell D. The Motoneurone and its Muscle Fibres. Oxford: Oxford University Press; 2006. [Google Scholar]
- Kernell D, Eerbeek O, Verhey BA, Donselaar Y. Effects of physiological amounts of high- and low-rate chronic stimulation on fast-twitch muscle of the cat hindlimb. I. Speed- and force-related properties. J Neurophysiol. 1987;58:598–613. doi: 10.1152/jn.1987.58.3.598. [DOI] [PubMed] [Google Scholar]
- Kiehn O, Eken T. Prolonged firing in motor units: evidence of plateau potentials in human motoneurons? J Neurophysiol. 1997;78:3061–3068. doi: 10.1152/jn.1997.78.6.3061. [DOI] [PubMed] [Google Scholar]
- Li X, Murray K, Harvey PJ, Ballou EW, Bennett DJ. Serotonin facilitates a persistent calcium current in motoneurons of rats with and without chronic spinal cord injury. J Neurophysiol. 2007;97:1236–1246. doi: 10.1152/jn.00995.2006. [DOI] [PMC free article] [PubMed] [Google Scholar]
- Li Y, Gorassini MA, Bennett DJ. Role of persistent sodium and calcium currents in motoneuron firing and spasticity in chronic spinal rats. J Neurophysiol. 2004;91:767–783. doi: 10.1152/jn.00788.2003. [DOI] [PubMed] [Google Scholar]
- Little JW, Micklesen P, Umlauf R, Britell C. Lower extremity manifestations of spasticity in chronic spinal cord injury. Am J Phys Med Rehabil. 1989;68:32–36. doi: 10.1097/00002060-198902000-00009. [DOI] [PubMed] [Google Scholar]
- MacDonell CW, Ivanova TD, Garland SJ. Reliability of the interval death rate analysis for estimating the time course of the motoneurone afterhyperpolarization in humans. J Neurosci Methods. 2007;162:314–319. doi: 10.1016/j.jneumeth.2007.01.020. [DOI] [PubMed] [Google Scholar]
- Matthews PB. Relationship of firing intervals of human motor units to the trajectory of post-spike after-hyperpolarization and synaptic noise. J Physiol. 1996;492:597–628. doi: 10.1113/jphysiol.1996.sp021332. [DOI] [PMC free article] [PubMed] [Google Scholar]
- Matthews PB. Measurement of excitability of tonically firing neurones tested in a variable-threshold model motoneurone. J Physiol. 2002;544:315–332. doi: 10.1113/jphysiol.2002.024984. [DOI] [PMC free article] [PubMed] [Google Scholar]
- Milner-Brown HS, Stein RB, Yemm R. The contractile properties of human motor units during voluntary isometric contractions. J Physiol. 1973;228:285–306. doi: 10.1113/jphysiol.1973.sp010087. [DOI] [PMC free article] [PubMed] [Google Scholar]
- Mottram CJ, Suresh NL, Heckman CJ, Gorassini MA, Rymer WZ. Origins of abnormal excitability in biceps brachii motoneurons of spastic-paretic stroke survivors. J Neurophysiol. 2009;102:2026–2038. doi: 10.1152/jn.00151.2009. [DOI] [PMC free article] [PubMed] [Google Scholar]
- Mottram CJ, Wallace CL, Chikando CN, Rymer WZ. Origins of spontaneous firing of motor units in the spastic-paretic biceps brachii muscle of stroke survivors. J Neurophysiol. 2010;104:3168–3179. doi: 10.1152/jn.00463.2010. [DOI] [PMC free article] [PubMed] [Google Scholar]
- Murray KC, Nakae A, Stephens MJ, Rank M, D’Amico J, Harvey PJ, et al. Recovery of motoneuron and locomotor function after spinal cord injury depends on constitutive activity in 5-HT2C receptors. Nat Med. 2010;16:694–700. doi: 10.1038/nm.2160. [DOI] [PMC free article] [PubMed] [Google Scholar]
- Norton JA, Bennett DJ, Knash ME, Murray KC, Gorassini MA. Changes in sensory-evoked synaptic activation of motoneurons after spinal cord injury in man. Brain. 2008;131:1478–1491. doi: 10.1093/brain/awn050. [DOI] [PMC free article] [PubMed] [Google Scholar]
- Okado N, Matsukawa M, Noritake S, Ozaki S, Hamada S, Arita M, Kudo N. Species differences in the distribution and coexistence ratio of serotonin and substance P in the monkey, cat, rat and chick spinal cord. Neurosci Lett. 1991;132:155–158. doi: 10.1016/0304-3940(91)90290-a. [DOI] [PubMed] [Google Scholar]
- Person RS, Kudina LP. Discharge frequency and discharge pattern of human motor units during voluntary contraction of muscle. Electroencephalogr Clin Neurophysiol. 1972;32:471–483. doi: 10.1016/0013-4694(72)90058-2. [DOI] [PubMed] [Google Scholar]
- Pierotti DJ, Roy RR, Bodine-Fowler SC, Hodgson JA, Edgerton VR. Mechanical and morphological properties of chronically inactive cat tibialis anterior motor units. J Physiol. 1991;444:175–192. doi: 10.1113/jphysiol.1991.sp018872. [DOI] [PMC free article] [PubMed] [Google Scholar]
- Piotrkiewicz M, Hausmanowa-Petrusewicz I. Motoneuron afterhyperpolarisation duration in amyotrophic lateral sclerosis. J Physiol. 2011;589:2745–2754. doi: 10.1113/jphysiol.2011.204891. [DOI] [PMC free article] [PubMed] [Google Scholar]
- Piotrkiewicz M, Hausmanowa-Petrusewicz I, Mierzejewska J. Motoneurons are altered in muscular dystrophy. J Physiol Paris. 1999;93:167–173. doi: 10.1016/s0928-4257(99)80147-8. [DOI] [PubMed] [Google Scholar]
- Piotrkiewicz M, Kudina L, Mierzejewska J, Jakubiec M, Hausmanowa-Petrusewicz I. Age-related change in duration of afterhyperpolarization of human motoneurones. J Physiol. 2007;585:483–490. doi: 10.1113/jphysiol.2007.142356. [DOI] [PMC free article] [PubMed] [Google Scholar]
- Powers RK, Binder MD. Relationship between the time course of the afterhyperpolarization and discharge variability in cat spinal motoneurones. J Physiol. 2000;528:131–150. doi: 10.1111/j.1469-7793.2000.t01-1-00131.x. [DOI] [PMC free article] [PubMed] [Google Scholar]
- Revill AL, Fuglevand A. Effects of persistent inward currents, accomodation, and adaptation on motor unit behavior: a simulation study. J Neurophysiol. 2011;106:1467–1479. doi: 10.1152/jn.00419.2011. [DOI] [PMC free article] [PubMed] [Google Scholar]
- Semmler JG, Nordstrom MA, Wallace CJ. Relationship between motor unit short-term synchronization and common drive in human first dorsal interosseous muscle. Brain Res. 1997;767:314–320. doi: 10.1016/s0006-8993(97)00621-5. [DOI] [PubMed] [Google Scholar]
- Stein RB, Brucker BS, Ayyar DR. Motor units in incomplete spinal cord injury: electrical activity, contractile properties and the effects of biofeedback. J Neurol Neurosurg Psychiatr. 1990;53:880–885. doi: 10.1136/jnnp.53.10.880. [DOI] [PMC free article] [PubMed] [Google Scholar]
- Stein RB, French AS, Mannard A, Yemm R. New methods for analysing motor function in man and animals. Brain Res. 1972;40:187–192. doi: 10.1016/0006-8993(72)90126-6. [DOI] [PubMed] [Google Scholar]
- Thomas CK. Contractile properties of human thenar muscles paralyzed by spinal cord injury. Muscle Nerve. 1997;20:788–799. doi: 10.1002/(sici)1097-4598(199707)20:7<788::aid-mus2>3.0.co;2-3. [DOI] [PubMed] [Google Scholar]
- Thomas CK, Hager-Ross CK, Klein CS. Effects of baclofen on motor units paralysed by chronic cervical spinal cord injury. Brain. 2010;133:117–125. doi: 10.1093/brain/awp285. [DOI] [PMC free article] [PubMed] [Google Scholar]
- Thomas CK, Johansson RS, Westling G, Bigland-Ritchie B. Twitch properties of human thenar motor units measured in response to intraneural motor-axon stimulation. J Neurophysiol. 1990;64:1339–1346. doi: 10.1152/jn.1990.64.4.1339. [DOI] [PubMed] [Google Scholar]
- Thomas CK, Nelson G, Than L, Zijdewind I. Motor unit activation order during electrically evoked contractions of paralyzed or partially paralyzed muscles. Muscle Nerve. 2002;25:797–804. doi: 10.1002/mus.10111. [DOI] [PubMed] [Google Scholar]
- Thomas CK, Ross BH. Distinct patterns of motor unit behavior during muscle spasms in spinal cord injured subjects. J Neurophysiol. 1997;77:2847–2850. doi: 10.1152/jn.1997.77.5.2847. [DOI] [PubMed] [Google Scholar]
- Tokizane T, Shimazu H. Functional Differentiation of Human Skeletal Muscle. Springfield: Charles G Thomas; 1964. [Google Scholar]
- Yang JF, Stein RB, Jhamandas J, Gordon T. Motor unit numbers and contractile properties after spinal cord injury. Ann Neurol. 1990;28:496–502. doi: 10.1002/ana.410280405. [DOI] [PubMed] [Google Scholar]
- Zijdewind I, Gant K, Bakels R, Thomas CK. Do additional inputs change maximal voluntary motor unit firing rates after spinal cord injury? Neurorehabil Neural Repair. 2012;26:58–67. doi: 10.1177/1545968311417449. [DOI] [PubMed] [Google Scholar]
- Zijdewind I, Thomas CK. Spontaneous motor unit behavior in human thenar muscles after spinal cord injury. Muscle Nerve. 2001;24:952–962. doi: 10.1002/mus.1094. [DOI] [PubMed] [Google Scholar]
- Zijdewind I, Thomas CK. Motor unit firing during and after voluntary contractions of human thenar muscles weakened by spinal cord injury. J Neurophysiol. 2003;89:2065–2071. doi: 10.1152/jn.00492.2002. [DOI] [PubMed] [Google Scholar]