

Abstract
A distinctive property of the cerebellar system is olivocerebellar modules, where synchronized electrical activity in neurons in the inferior olivary nucleus (IO) evokes organized activity in the cerebellar cortex. However, the exact function of these modules, and how they are developed, is still largely unknown. Here we show that the IO in in vitro slices from postnatal mice spontaneously generates clusters of neurons with synchronous Ca2+ transients. Neurons in the principal olive (PO), and the vestibular-related dorsomedial cell column (dmcc), showed an age-dependent increase in spontaneous calcium transients. The spatiotemporal activity pattern was occasionally organized in clusters of co-active neighbouring neurons, with regular (16 min−1) and irregular (2–3 min−1) repeating cluster activity in the dmcc and PO, respectively. IO clusters had a diameter of 100–170 μm, lasted ∼1 s, and increased in occurrence from postnatal day P5.5 to P12.5, followed by a sharp drop to near zero at P15.5. IO clusters were overlapping, and comprised nearly identical neurons at some time points, and a varied subset of neurons at others. Some neurons had hub-like properties, being co-active with many other neighbours, and some were co-active with separate clusters at different times. The coherence between calcium transients in IO neurons decreased with Euclidean distance between the cells reaching low values at 100–200 μm distances. Intracellular recordings from IO neurons during cluster formation revealed the presence of spikelet-like potentials, suggesting that electrical coupling between neighbouring IO neurons may serve as a synchronizing mechanism. In conclusion, the IO shows spontaneous cluster activity under in vitro conditions, coinciding with a critical postnatal period in olivocerebellar development. We propose that these clusters may be forerunners of the ensembles of IO neurons shown to be co-active in adult animals spontaneously and during motor acts.
Key points
The cerebellum is organized in modules, where groups of neurons in the inferior olivary nucleus (IO) are connected to elongated bands of Purkinje neurons in the cerebellar cortex; it is still largely unknown what the specific function of these modules is, and how they are formed.
Here we show that IO neurons spontaneously generate clusters of co-active neurons in in vitro brain slice preparations from newborn mice, in an age window ranging from birth to two weeks old.
Intracellular recordings revealed that electrical coupling between neighbouring IO neurons may contribute to the synchronization.
The dorsomedial cell column, which is a subregion in the IO involved in the control of balance and posture, showed a high frequency of regular repeating clusters compared to the rest of the IO, suggesting that this system may be on a fast developmental track.
These results increase our understanding of how the circuitry of the cerebellar system develops in the early postnatal period, where animals acquire the ability to produce finely controlled motor acts.
Introduction
The organization of the cerebellar system is modular, but the functional significance of cerebellar modules is still unclear (Apps & Hawkes, 2009; Ruigrok, 2011). Behavioural experiments point to a role in coordination of specific motor acts (Cerminara & Apps, 2011; Horn et al. 2010), but the relationship between modular activity and execution of motor acts has yet to be determined. Currently the smallest recognized modules are composed of clusters of IO neurons that send climbing fibres to the cerebellum innervating longitudinal microzones of Purkinje cells, which in turn project to specific regions of the vestibular and cerebellar nuclei (Groenewegen et al. 1979; Sugihara et al. 2001; Apps & Garwicz, 2005; Pijpers et al. 2005; Sugihara & Shinoda, 2007). Recent data suggest that mossy fibre projections adhere to this modular organization (Ruigrok, 2011). The presence of cerebellar modules has also been demonstrated in physiological experiments, such as spontaneous or sensory-evoked co-active microzones of adjacent Purkinje cells in rats (Ozden et al. 2009; Schultz et al. 2009), eyeblink-related microzones in the rabbit (Mostofi et al. 2010), and microzones of co-active Purkinje cells that have stable anatomical boundaries across behavioural states such as locomotion and alert rest in mice (Mukamel et al. 2009).
One way of approaching the functional role of cerebellar modules is to study the development of the underlying neural circuits. In the mouse, embryonic Purkinje cells are derived from the ventricular zone at embryonic day (E)10.5 to E12.5. IO neurons are derived from the Ptf1a neuroepithelial domain in the caudal hindbrain and migrate towards their ventral location in the brainstem in the period E10.5 to E13.5 (Sotelo, 2004; Yamada et al. 2007; Namba et al. 2011). The olivocerebellar system is formed when climbing fibres begin to make contact with Purkinje cells around E18 (Chedotal & Sotelo, 1992; Wassef et al. 1992), probably guided by diffusible chemoattractants in the cerebellum (Zhu et al. 2003). A gross topographic organization in the olivocerebellar projection appears to be in place already at E15 (Paradies & Eisenman, 1993), but it is still unclear when exactly the microzonal organization is completed. It may happen during an important postnatal period where a drastic reshaping of each of the climbing fibres reduces the number of terminal arbors from ∼100 to ∼7, which each become focused on a single Purkinje cell at the end of the third postnatal week (Nishiyama & Linden, 2004; Sugihara, 2006). This process is activity dependent and involves competition between parallel and climbing fibres, between climbing fibres, and possibly between inhibitory interneurons and climbing fibres (Bosman & Konnerth, 2009). Formation of gap junctions between IO neurons is also taking place in this postnatal period, with electron microscopic evidence for neuro-neuronal gap junctions in the rat IO starting at P10 (Bourrat & Sotelo, 1983). In mouse, connexin45 and connexin36 are found in IO neurons already at P1, with a marked increase in connexin36 during the first three postnatal weeks (Van Der Giessen et al. 2006). Thus, activity in the IO during a critical period encompassing the first postnatal weeks appear to be an important determinant of the proper development of cerebellar modules, and gap junctional coupling of IO neurons. Electrical coupling is essential for proper timing of IO action potentials and thereby for learning-dependent timing in cerebellar motor control (Van Der Giessen et al. 2008). Here we studied the spontaneous spatiotemporal activity patterns of IO neurons in an in vitro brainstem slice preparation from postnatal mice in this critical period, and find that IO neurons spontaneously generate clusters of co-active neurons. These clusters resemble the previously described stimulus-evoked ensemble of subthreshold neuronal oscillations in the IO in postnatal rats (Leznik et al. 2002; Leznik & Llinás, 2005), and may be forerunners of the ensembles of IO neurons shown to be co-active in adult animals during motors acts (Smith, 1998).
Methods
Ethical approval
All experiments and procedures were approved by the Department of Experimental Medicine, and according to procedures laid out by the Danish Ministry of Justice and the Danish National Committee for Ethics in Animal Research, and conform to the principles of UK regulations, as described in Drummond (2009).
In vitro preparations, and Fluo-8,AM loading
Postnatal (day 0.5–15.5) US Naval Medical Research Institute (NMRI) mice were anaesthetized with isoflurane, and killed with a cut across the thorax and removal of the heart and lungs. The neuraxis was removed by dissection in an ice-cold, oxygenated (95% O2, 5% CO2) solution containing (in mm): 250 glycerol (Ye et al. 2006), 3 KCl, 5 KH2PO4, 36 NaHCO3, 10 d-(+)-glucose, 2 MgSO4 and 0.7 CaCl2. Large vessels and the pia mater were removed from the ventral brainstem surface, the brainstem spinal cord was glued (using cyanoacrylate) to a piece of filter paper, and mounted upright on an agar block at a ventrodorsal tilt of 25 deg. A rostral cut was placed at the level of the rostral 1/3 of the IO containing the dmcc, which was reached by cutting and inspecting sequential 150 μm sections starting at the facial nucleus, using a vibratome (Microm HM 650 V, Walldorf, Germany). A second cut was placed 950 μm caudally to the rostral cut producing a thick transverse slice preparation, which was glued to a piece of filter paper, and loaded with the acetoxymethyl ester form of the Ca2+-sensitive dye Fluo-8 (Fluo-8,AM) (AAT Bioquest, Sunnyvale, CA, USA) by placing the preparation in a loading solution for 1–1.5 h at room temperature and bubbling with 95% O2, 5% CO2. The loading solution was prepared by dissolving 50 μg Fluo-8,AM in 50 μl DMSO, combining 20 μl of this solution with 5 μl cremophore EL (Fluka, USA) and 5 μl 20% Pluronic F-127 in DMSO (AAT Bioquest), adding these 30 μl to 1 ml ACSF with 100 mm d-mannitol (improving dye diffusion into the tissue; Funke et al. 2007, Sigma, USA), and 100 μm MK-571 (a multidrug resistance transport blocker improving calcium indicator dye uptake (Manzini et al. 2008), Sigma, USA). The final Fluo-8,AM concentration was 20 μm. The calcium affinity and buffer capacity of Fluo-8 is relatively high (Kd 389 nm, AAT Bioquest), and the final intracellular concentration of Fluo-8 after loading is unknown. Combined, these parameters will affect the kinetics of calcium transients, which will probably appear much slower than the underlying intracellular changes in [Ca2+]. In particular the slow off-rate will increase the duration of the transients substantially. Following loading with Fluo-8,AM the preparation was transferred to a recording chamber, mounted with the rostral surface up and stabilized by placing a silver frame on the filter paper.
Calcium imaging
Optical recordings commenced 30 min after the preparation was placed in the recording chamber. The recording chamber had a volume of 2 ml, a temperature of 29.0°C and was constantly superfused at a rate of 2 ml min−1 with preheated oxygenated (95% O2, 5% CO2) artificial cerebrospinal fluid solution (ACSF). The ACSF solution contained (in mm): 129 NaCl, 3 KCl, 5 KH2PO4, 22 NaHCO3, 30 d-(+)-glucose, 0.4 MgSO4 and 0.7 CaCl2. The surface of the preparation was illuminated by high-luminosity light-emitting diodes (LEDs; HLV series, CCS LED Spotlight, Kyoto, Japan) and visualized by a fluorescence stereo microscope (Leica MZ16 FA, Wetzlar, Germany). For detection of Fluo-8 fluorescence, a metal halide light source (Leica EL6000, Wetzlar, Germany or PhotoFluor II, 89North, Burlington, VT, USA) was coupled to the stereo microscope via a liquid light guide, and appropriate optical filters (Leica GFP3: excitation, 470 nm/40 nm; barrier, 525 nm/50 nm) were used. Live image stacks were captured by an EMCCD camera (Andor LucaEM S DL-658M, 658 × 496 pixels, Andor Technology, Belfast, UK), controlled by the SOLIS software (Andor Technology). Imaging was done using magnification ×40 to ×115, at sampling rates of 10 frames s−1 (faster sampling rates on this microscope did not allow enough light into the camera for single cell visualization of calcium transients), in image sessions lasting 45–90 s. Substantial bleaching of the Fluo-8 fluorescence was noted throughout the longer imaging session, which was partially corrected for during the analysis using a running background subtraction (1 s back in time). An Olympus BX51 (Olympus, Tokyo, Japan) was also used for calcium imaging, visualizing individual IO neurons using ×20 or ×63 water immersion objectives (imaging: 10–128 frames s−1, 10 frames s−1 un-binned, 70 frames s−1 2 × 2 binning, 128 frames s−1 4 × 4 binning), a standard BX51 mercury fluorescent lamp, optical filters (Olympus U-MWIB: excitation, 460–490 nm; dichroic, 505 nm; emission, 515 nm long pass), and a similar EMCCD camera.
Whole-cell recordings
For whole-cell recordings, neurons located in the IO were visualized using an Olympus BX51 (upright, modified to be a fixed stage, mounted on an XY platform) with a ×2.5 and a ×63 objective. The ×2.5 objective was used to visualize the entire cut surface of the preparation. The ×63 water immersion objective was used in conjunction with oblique illumination optics to visualize the soma of individual neurons and the recording pipette tip. The preparation was illuminated from below using a 100 W halogen lamp, and the image was acquired by the EMCCD camera, software contrast enhanced (SOLARIS, Andor Technology), and displayed on a PC monitor. Glass micropipettes were pulled from filamented glass tubes (outer diameter 1.5 mm, inner diameter 0.86 mm, Harvard Apparatus, Holliston, MA, USA) using a PUL-100 micropipette puller (World Precision Instruments, Sarasota, USA) and filled with a solution containing (in mm): 145 potassium d-gluconate, 10 NaCl, 1 MgCl2, 0.01 CaCl2, 0.1 BAPTA (tetra K+ salt), 10 Hepes, 3 ATP (Mg2+), 0.3 GTP (Na+), pH 7.3. For dual recordings pipettes were mounted in two HS-2 headstages (gain 0.01) and current clamp recordings performed with two separate AxoClamp 2B amplifiers (Molecular Devices, Sunnyvale, CA, USA). Pipette resistance before seal formation was typically 1–3 MΩ and after the whole-cell configuration was achieved series resistance was 3–10 MΩ. Membrane potentials were calculated as the difference between the intracellular potential and the potential measured at the end of the recording session when the electrode was retracted to the extracellular space.
Analysis and statistics
Analysis of optical recordings and patch clamp data was done offline using Igor Pro v. 6.2 (Wavemetrics, Lake Oswego, OR, USA), Clampex (Molecular Devices), and ImageJ (Open Source, National Institutes of Health, Bethesda, MD, USA, http://rsbweb.nih.gov/ij/). Raw image stacks were partially corrected for bleaching of the Fluo-8 dye, and turned into image stacks showing relative changes in fluorescence (ΔF) by subtracting the image 1 s before each frame in the stack. This method was used instead of calculating ΔF/F due to the relatively long recording sessions, which gave a highly non-linear quenching of the dye over time. Image stacks were Kalman filtered, and colour coded (rainbow RGB: black, small ΔF; red to white, large ΔF (dark–light in monochrome images), 2- to 10-point mean-filtered (mean of adjacent 2 × 2 to 10 × 10 points), and brightness and contrast enhanced using ImageJ. In some experiments regions of interest (ROIs) were defined and average ΔF values within the ROI were plotted versus time. It should be noted that the fluorescence output from Fluo-8,AM-labelled tissue is dependent on loading time, age of the animal, light exposure time, and quenching – all variables that changed substantially from experiment to experiment. For these reasons amplitude calibration bars on ΔF images have little meaning, and have been omitted from the figures, except Fig. 1A, where the colour code ranging from minimal to maximal values is indicated. However, the relative changes in the data within one experiment have meaning, and can be distinguished as changes in colour code in single images. Contrast and colour range was kept constant when showing several images from the same experiment. Statistical determination of co-activity between two spontaneously active neurons was based on a test comparing the variance of the time difference between calcium transients in two neurons and between the first neuron and a surrogate random dataset. This rather crude method was chosen because quenching of the calcium dye made long-duration recordings difficult, and more powerful co-activity algorithms consequently were difficult to implement. Thus, co-activity between two neurons in the IO was revealed by: (1) detecting the event times of calcium transients (time of the fastest rise of the transient) in ΔF traces from individual IO neurons, based on threshold crossings in differentiated traces and forward peak finding; (2) calculating the time difference between a given calcium transient event in an IO neuron and a second event (if present) in all other neurons in the ROI map within a time window of 500 ms; (3) comparing these data to a surrogate dataset of random calcium transient events in the same time window using an F test. The result declares two given neurons to be co-active if the time difference between multiple calcium transient events is significantly smaller than randomly occurring multiple calcium transients. Semi-automated cluster demarcation identified co-active neighbouring IO neurons using the following algorithm. (1) Identification of spontaneously active IO neurons in a ½-IO slice using a Z-projection (projection type: standard deviation) of the image stack. (2) Calculating the Euclidean distance between all identified IO neurons. (3) Plotting ΔF waveforms from each IO neuron in a nearest-neighbour plot using the Euclidean distance data. (4) Automated detection of image particles that include three or more neighbouring IO neurons (interneuron distance <100 μm) showing co-active calcium transients within a time window of 2 s. (5) Manually counting the identified particles (clusters), with repeating clusters counted as one. Human observer demarcation of clusters of co-active IO neurons was performed by manually inspecting image stacks in ImageJ identifying circumscribed regions of co-active neighbouring neurons over 5–20 frames (at 10 frames s−1). Coherence was calculated as the normalized (0–1) cross-power spectrum of two ΔF waveforms, using custom written code in Igor Pro. The duration of calcium transients and cluster activity was calculated as the difference between times of the rising and falling phases at the half-amplitude points of individual calcium transients or ΔF from ROIs encompassing entire clusters. To construct a cycle-triggered-averaged image of an IO cluster the waveform from a ROI encompassing the entire repeating cluster was used to pull out an image from the stack corresponding to the peak of the ROI waveform, and an image 1 s prior to this was subtracted from this image. An averaged image was constructed by averaging 5–40 of these baseline-subtracted cluster-related images. Statistical values are given as mean ± SD, and Student's t test was used for statistical comparisons unless otherwise stated.
Figure 1. IO neurons show spontaneous calcium transients with an age-dependent increase in frequency.
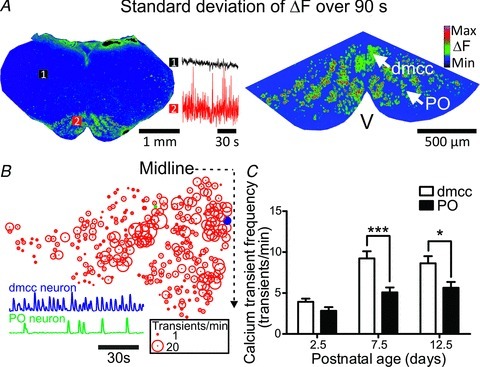
A, Z-projection image (900 frames) showing the standard deviation (dark:low, light:high (blue:low, red:high in online figure)) of ΔF from two brainstem regions (left panel: 1, reticular formation; 2, IO; P9.5 mouse) and IO at higher magnification (right panel, P10.5 mouse). Upper and lower traces on the left panel are summated ΔF from regions 1 and 2; V, ventral surface; dmcc, dorsomedial cell column; PO, principle olive. The greyscale calibration scale in the right panel shows the relative intensities associated with the ΔF range from minimal to maximal (colour calibration scale online), and applies to all plots in figures showing ΔF images. B, bubble-plot showing the calcium transient frequency of 299 neurons contained in the right inferior olive, taken from experiment shown in A, right panel. Examples of ΔF waveforms from a dmcc and PO cell are shown as insets. C, group data plot of the calcium transient frequency in dmcc and PO in preparations from different postnatal ages. Note the difference in frequency between dmcc and PO at P7.5 and P12.5.
Results
We used calcium imaging in thick (950 μm) slices of the brainstem from P0.5 to P15.5 mice to reveal spontaneous spatiotemporal activity patterns in the IO. Transversely cut brainstem slices, cut at the level of the upper IO, were loaded with Fluo-8,AM and the fluorescence changes from specific IO regions or single neurons at the cut surface were recorded at 10–128 frames s−1.
Spontaneous calcium transients in neurons located in the IO
Calcium imaging of the entire surface of brainstem slices revealed that the IO contained numerous neurons that showed strong fluctuations in ΔF compared to the rest of the brainstem surface (Fig. 1). Rectangular regions of interest (200 μm × 200 μm ROIs) over the IO showed a 20 ± 12% larger fluctuation in ΔF compared to ROIs placed over the reticular formation (RF, Fig. 1A, left panel, P < 0.05, n = 5, (RMS-IO/RMS-RF) since is a division between RMS-IO and RMS-RF for ΔF signals over 90 s time series). The composition of the ACSF was tuned to increase neuronal excitability (increased extracellular potassium, decreased calcium), but the relatively larger fluctuation in ΔF was not due to the high potassium concentration in the ACSF (8 mm), since reduced potassium concentrations (3 mm) did not change the (RMS-IO/RMS-RF) ratio (3 mm K+: 1.20 ± 0.13, 8 mm K+: 1.20 ± 0.15, n = 5). However, increasing extracellular calcium decreased the fluctuation in ΔF over the IO (0.7 mm Ca2+: 1.18 ± 0.04, 2 mm Ca2+: 1.10 ± 0.06, P < 0.01, n = 4). When viewed at higher optical magnification the morphological characteristics of the IO were apparent (Fig. 1A, right panel). In particular, the dmcc was visible as an oval group of neurons located close to the midline, and the tortuous principal olive (PO) was also visible in Fluo-8,AM-labelled slices. The somata of individual neurons could be resolved and ΔF waveforms recorded (Fig. 1B lower traces). Signals from neurons located deeper in the tissue sometimes contributed to the signal from a presumed single neuron (lower amplitude calcium transients in the ΔF), but the threshold of the detection algorithm was set as high as possible to minimize this problem. The frequency of calcium transients differed markedly among neurons throughout the inferior olive (Fig. 1B) and ranged from 0.6 to 47 transients min−1 (n = 486 neurons in 3 preparations, P9.5 to P10.5). The duration of the calcium transients was 960 ± 48 ms (in the dmcc), and 980 ± 47 ms (in the PO, n = 12 neurons in 3 preparations, P9.5 to P10.5). There was a clear age-dependency with an increase from 3.4 ± 1.4 to 7.3 ± 3.3 calcium transients min−1 in the entire IO between P2.5 and P7.5 (P < 0.0001, n = 10). Notably, dmcc neurons in older (P7.5 to P12.5) preparations showed a ∼50–80% higher frequency of calcium transients than PO neurons (Fig. 1C, P < 0.001 and P < 0.05, n = 8).
Spontaneous cluster activity in dmcc and PO
When the spatiotemporal patterns of calcium transients were inspected in stacks of images acquired at 10 frames s−1 it became clear that neighbouring IO neurons occasionally showed simultaneous activity (Fig. 2; and see Supplemental Movie, available online only). These clusters of co-active neurons were present throughout the IO and involved the majority of neurons in the dmcc (Fig. 2A) or smaller groups of neurons in the PO (Fig. 2B). Clusters were also present at 34°C, i.e. closer to the normal mouse body temperature, but activity ran down more quickly (n = 4 of 4 preparations). Some clusters, in particularly in the dmcc, occurred repeatedly (Fig. 2A); however, others occurred only once during a 90 s recording session. The outline of IO clusters, demarked as co-active neighbouring neurons using the semi-automated method or by a human observer, showed round to elongated shapes with clear overlaps during a 90 s recording session (Fig. 2C). The duration of the clusters was 955 ± 53 ms (in the dmcc) and 988 ± 33 ms (in the PO, n = 12 neurons in 3 preparations, P9.5 to P10.5). The maximal cluster diameter in dmcc was 166 ± 47 μm, which was larger than the PO cluster diameter of 107 ± 35 μm (Fig. 2D, P < 0.001, n = 10 dmcc clusters, 134 PO clusters in 4 preparations from P9.5 to P11.5 animals). The total area of dmcc clusters was also larger than PO clusters (Fig. 2D, 15,772 ± 8786 μm2versus 5285 ± 3150 μm2, P < 0.0001). The human observer-based demarcation of clusters was compared to an automated method of identification of co-active neurons (Fig. 2E). Co-activity between two neurons in a ½-IO slice was revealed by calculating the time difference between a given calcium transient event in an IO neuron and a second event (if present) in all other neurons in the ROI map within a time window of 500 ms, and comparing these data to a surrogate dataset of random calcium transient events in the same time window using an F test. When statistically significant (P < 0.05) pairs of co-active neurons were plotted (Fig. 2E, dark lines (red lines online) superimposed on the cluster map (Fig. 2E, black lines) a partial overlap was observed (n = 25 ½-IO slices from P7.5 to P13.5 preparations). However, some human observer-demarked clusters were not detected by the automated co-activity algorithm, probably due to the fact that some clusters only occur once during the recording session. Some pairs of co-active neurons were detected in regions where the human observer identified no clusters (e.g. Fig. 2E, rightmost pair in the ROI plot). The mean distance between connected pairs in the automated co-activity test was 43 ± 22 μm (range: 18–87 μm) in the dmcc, and 46 ± 28 μm (range: 12–120 μm) in the PO (n = 923 neuron pairs in 25 ½-IO slices from P7.5 to P13.5 preparations). The number of clusters per ½-IO slice showed a marked age-dependent increase at ages P5 to P11, followed by a sharp drop to almost zero at P15.5 (Fig. 2F). Spontaneous calcium transients were still present at P15.5, albeit at a lower frequency compared to P12.5 (4.4 ± 2.2 calcium transients min−1, P < 0.01, n = 3).
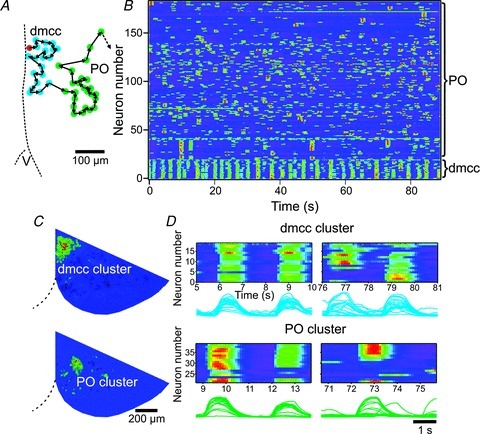
Figure 2. IO neurons show spontaneous cluster activity.
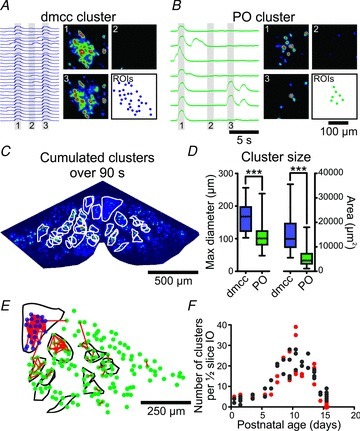
A, ΔF waveforms (left) from 30 dmcc neurons with associated Z-projection images (standard deviation over 10 frames) at different times indicated by 1, 2, 3. ROIs in lower right panel outline the locations of the 30 neurons, which formed a cluster of co-active neurons twice at times 1 and 3. B, ΔF traces (left) from 7 PO neurons with associated Z-projection images (standard deviation over 10 frames) at different times indicated by 1, 2, 3. ROIs in lower right panel outline the locations of the 7 neurons. Calibrations in B also apply to A. Note that calcium transients occur simultaneously in all neighbouring neurons at time 1, thereby creating cluster activity. C, outline (white lines) of spontaneous clusters over 90 s demarked by human observer. D, cluster size in the dmcc and PO regions expressed in maximal diameter (μm) and area (μm2), with indications of lower quartile, median, upper quartile, and max and min values. E, outline of human observer-demarked clusters (black lines) from ½-IO slice (left side in C) overlaid with dmcc ROIs (dark dots (blue dots online)), PO ROIs (light dots (green dots online)), and statistically significant co-activity lines (dark lines (red lines online)). Note the partial overlap between the human observer-demarked clusters and the clusters based on automated statistical co-activity analysis. F, group-data plot of the number of clusters per ½-IO slice in preparations from different postnatal ages (light circles (red online): semi-automated cluster demarcation; black circles: human observer cluster demarcation). Note the increase in number of clusters between P5 and P11, followed by a sharp drop.
Coherence, and calcium transient coincidence decrease with Euclidean distance
To estimate how well individual calcium transients in neurons within a cluster were synchronized we first calculated the coherence between ΔF waveforms from pairs of IO neurons. Coherence was calculated as the cross-power spectral density of 90 s duration ΔF waveforms from two different IO neurons. Each waveform was divided into 10 segments and the mean coherence was calculated, which then gives a normalized dimensionless measure (ranging from 0 to 1) of how similar two waveforms are. Waveforms from two IO neurons showed high coherence when many calcium transients occurred nearly simultaneously in the two neurons (Fig. 3A, top traces), and low coherence was found when the two waveforms showed little superposition (Fig. 3A, lower traces, n = 210,783 neuron pairs (3123 neurons) in 29 ½-IO slice preparations from P1.5 to P13.5 animals). There was a striking correlation between the coherence and Euclidean distance between pairs of IO neurons within both the dmcc and PO (Fig. 3B). In the dmcc, coherence decreased with a triangular spread reaching low values at ∼200 μm Euclidean distance between neuron pairs; in the PO, low coherence values were reached at ∼100 μm (n = 29 ½-IO slices). Coherence increased with increasing postnatal age exemplified in three plots from the dmcc from P1.5, P5.5 and P7.5 animals (Fig. 3C), and quantified by calculating the mean coherence in both dmcc and PO (including only coherence values above 0.1 and below 200 μm) across different postnatal ages (Fig. 3D, n = 29 ½-IO slices).
Figure 3. Coherence decreases with Euclidean distance.
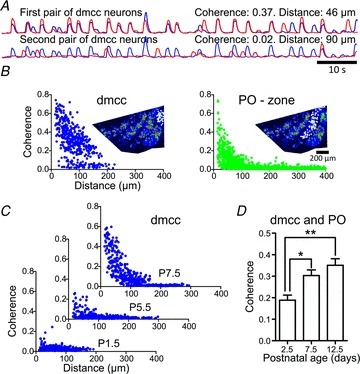
A, ΔF waveforms from two dmcc neurons located at 46 μm Euclidean distance from each other (upper traces), and two dmcc neurons at 90 μm distance (lower traces). Note the near-simultaneous calcium transients in the top two neurons, which give rise to a high coherence value (0.37). B, coherence versus Euclidean distance for neuron pairs in the dmcc (left panel, insert: ½-IO slice with white circles indicating 29 dmcc neurons used in the plot), and a PO-zone (right panel, 79 PO neurons) in a P10.5 preparation. Note the decrease in coherence as neurons pairs are separated by increasing distance. The lower ‘isolated’ population in the left dmcc plot may possibly result from PO neurons at the border of the dmcc. C, coherence versus Euclidean distance in the dmcc in P1.5, P5.5 and P7.5 preparations. D, group data plot of the mean coherence (mean of data below 200 μm Euclidean distance and above 0.1 coherence, dmcc and PO combined) in preparations from different postnatal ages (n = 29). Note the age-dependent increase in mean coherence.
Next, we determined the variation in the calcium transient coincidence in statistically significant (F test) co-active pairs of IO neurons (Fig. 4A and B) based on data from 90 s ΔF recordings obtained at 10 frames s−1. The standard deviation of transient–transient times increased with increasing Euclidean distance between pairs of co-active neurons in both the dmcc and PO (Fig. 4B, linear regression slope (line) being different from zero, P < 0.01 for this individual experiment (left and middle panels), and P < 0.0001 for all pairs in 13 ½-IO slices, 618 neuron pairs (right panel), F test). Finally, we determined the variation in the calcium transient coincidence in human observer-demarked clusters, capturing a single bout of co-active neurons at the maximal frame rate possible in our system (70 or 128 frames s−1, at 2 × 2 and 4 × 4 binning, Fig. 4C and D). This analysis showed a weak but significant correlation between calcium transient difference and Euclidean distance among pairs of co-active neurons in the IO (Fig. 4D, linear regression slope (line) being different from zero, P < 0.05 for all pairs in 12 ½-IO slices, 1001 neuron pairs, F test). However, the variation in time difference is only partially explained by the distance between cells as reflected by the low correlation coefficient (r = 0.17).
Figure 4. Calcium transient coincidence decreases with Euclidean distance.
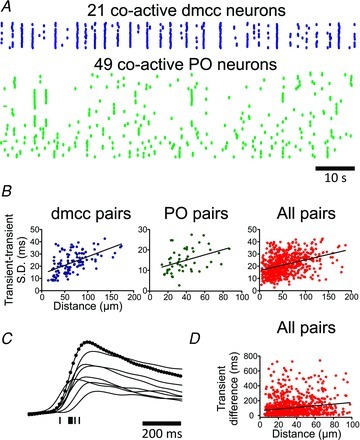
A, raster plot of calcium transients in 21 co-active dmcc, and 49 co-active PO, neurons from the same ½-IO slice (containing 181 spontaneously active neurons). Note the small jitter in the co-incidence of calcium transients in both regions. B, plot of transient–transient standard deviation (SD) versus Euclidean distance for dmcc, and PO pairs in one experiment (left, and middle panel), and group data from low resolution microscopy (right panel). Transient–transient is defined here as the time difference between steepest rate of rise of two calcium transients. C, ΔF waveforms from a human observer-demarked dmcc cluster recorded at high frame rate (70 frames s−1) indicated by black circles in one trace. Individual calcium transient times are indicated by ticks below the traces. Note the variation in transient times. D, plot of transient difference versus Euclidean distance for IO neurons based on data from high resolution microscopy (both dmcc and PO pairs). Note that the slope of the linear regression is increasing in plots in B and D, indicating a decrease in calcium transient coincidence with Euclidean distance.
Clusters repeat, PO contain hub-like neurons, and some PO neurons are co-active with separate clusters at different times
The observed correlation between coherence and Euclidean distance prompted us to plot ΔF waveforms from IO neurons sorted by a nearest-neighbour algorithm (Fig. 5A), which gave a more distinct visualization of clusters over time (Fig. 5B). From these plots it became apparent that the dmcc show regular, and the PO show irregular, repeating clusters. The frequency of repeating dmcc clusters was 16 ± 2 clusters min−1, and the frequency range of irregular repeating clusters in the PO was 2–3 clusters min−1 (n = 4 preparations from P9.5 to P10.5 animals). We did not observe synchronization of the two sides. Furthermore, the repeating clusters in the dmcc and PO are composed of nearly identical neighbouring neurons at some times, whereas subsets of neurons in the cluster are co-active at other times (Fig. 5C and D). When inspecting co-activity maps based on the automated co-activity test it became apparent that some PO clusters contain individual neurons that show co-activity with many other neurons within the cluster, whereas others show co-activity with few other neurons in the cluster (Fig. 6A, black circle). Nearest-neighbour image plots of the cluster activity over time showed that the most probable reason for this observation is that these hub-like neurons are preferentially active in many of the repeating cluster events consisting of a varied number of neurons, thereby reaching statistical significance with several other neurons in the cluster (Fig. 6B). This observation prompted us to perform a complex network analysis (Feldt et al. 2011a) on the entire dmcc and PO dataset drawn from the automated co-activity test (Fig. 6C, n = 4 preparations from P9.5 to P10.5 animals). In complex network theory terminology (nodes: neurons; links: significant co-activity) we found that the node degree histogram, which plots the number of links per node, had a very different shape in the dmcc and PO (Fig. 6C). In the dmcc the relative frequency was increasing with increasing number of links with an average of 7.4 ± 3.1 neighbours per node, whereas it was dramatically decreasing in the PO with an average of 1.6 ± 0.3 neighbours per node (P < 0.005, n = 7 ½-IO slices). The clustering coefficient was higher in the dmcc (0.7 ± 0.1) than in the PO (0.2 ± 0.1, P < 0.005, n = 7 ½-IO slices), but the characteristic path length (the average value of shortest path lengths for all pairs of co-active nodes) was the same (dmcc: 1.7 ± 0.6; PO: 1.5 ± 0.3; n = 7 ½-IO slices). Interestingly, the PO node degree distribution was well fitted with a power law function (Fig. 6C, right graph, line) with γ= 1.7 ± 0.5 (R2= 0.9 ± 01 for the fits, n = 7 ½-IO slices), a characteristic feature that is also found in scale-free networks that include hub nodes (few nodes that have many links).
Figure 5. The dmcc show regular, and the PO show irregular, repeating clusters.
A, diagram illustrating the result of an algorithm sorting dmcc (dark circles (blue circles online)) and PO (light circles (green circles online)) neurons in nearest neighbour order (black arrows) starting with a dmcc neuron (black circle (red circle online)). The rest of the dataset (total: 183 IO neurons in a ½-IO slice) has been omitted for clarity (dotted black arrow). B, nearest-neighbour image plots of the activity over 90 s for all 183 IO neurons. Note that dmcc neurons show regular repeating clusters, whereas the PO neurons show irregular cluster activity. C, cycle-triggered averages of a dmcc (32 cycles) and PO (4 cycles) cluster triggered off the rising phase of the combined ΔF waveform from the region. D, nearest-neighbour image plots of selected dmcc and PO activity, with associated ΔF waveforms from each neuron (below image). Note that the repeating clusters in the dmcc and PO are composed of nearly identical neighbouring neurons at some times (dmcc, PO: left panels), whereas subsets of neurons in the cluster are co-active at other times (dmcc, PO: right panels).
Figure 6. The PO contains hub-like neurons, and some PO neurons are co-active with separate clusters at different times.
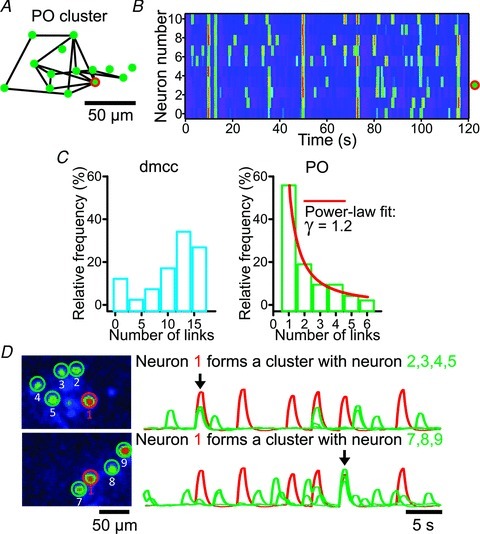
A, diagram illustrating the result of the automated co-activity test for a PO cluster (circles: neurons; black lines: statistically significant co-activity), including a hub-like neuron (many links to neighbouring neurons, black circle (green circle with red outline online). B, nearest-neighbour image plots of the cluster activity over time for the 11 neurons comprising the cluster in A. Note that the hub-like neuron (neuron number 3) is co-active with its neighbours in almost all of the repeating cluster events. C, complex network analysis showing node degree histogram in the dmcc (left plots), and the PO (right plots). The PO histogram was well fitted by a power-law function (line, γ= 1.2, R2= 0.9). D, example of PO neuron (neuron 1, encircled by dark line (red line online), which at one point in time (black arrow in right top traces) was part of one cluster (composed of neuron 1 (dark trace (red online) and neurons 2, 3, 4 and 5; light traces (green traces online)), and ∼15 s later was co-active with a separate set of neighbouring neurons (black arrow in right bottom traces, composed of neurons 1 and 7, 8 and 9).
Visual inspection of co-activity in the PO also revealed the presence of neurons that at one point in time were part of one cluster, and later were co-active with a separate set of neighbouring neurons (Fig. 6D). These neurons did not reach statistical significance in the automated co-activity test since only a few bouts of co-activity (1–3) were recorded in each 90 s recording session. However, the phenomenon of co-activity with separate clusters at different times was found in four other preparations with 2–8 co-active neighbours, 50–150 μm distance to farthest neighbour, 1–3 repetitions of the clusters over 90 s in two different clusters (n = 7 double cluster events, 4 ½-IO slices).
Dual whole-cell patch clamp recordings suggest electrical coupling may underlie cluster formation
To begin to approach the cellular mechanism underlying the spontaneous cluster formation in the IO we performed a series of dual whole-cell recordings from dmcc and PO neurons. Surprisingly, it was also possible to record calcium transients in Fluo-8,AM-loaded neurons for several minutes following break-in, but the ΔF signal eventually ran down (∼15 min) presumably due to diffusion of the dye into the pipette. In dual whole-cell patch recordings co-active action potentials could be observed in synchrony with calcium transients in both cells during spontaneous cluster formation (Fig. 7A and B). Due to the quick run-down of the ΔF signal we focused on acquiring optical data with concurrent spontaneous activity and did not systematically test for the presence of electrical coupling between neurons. Interestingly, small spikelet-like potentials with an amplitude of 1–2 mV were noted in one cell when the other was firing a full action potential (Fig. 7B and C, n = 3 of 13 pairs of dmcc neurons). When both cells fired action potentials during a cluster, a small pre-potential lasting 25–50 ms preceded the action potential in one cell (Fig. 7D). Action potentials recorded from single IO neurons during cluster formation were preceded by a pre-potential lasting 48 ± 17 ms (n = 5 dmcc and 3 PO neurons). Finally, subthreshold spikelet-like potentials were observed in two simultaneously recorded IO neurons during cluster formation (Fig. 7E, n = 2 pairs of dmcc neurons).
Figure 7. Combined whole-cell patch recordings and calcium imaging suggest that cluster-forming IO neurons are electrically coupled.
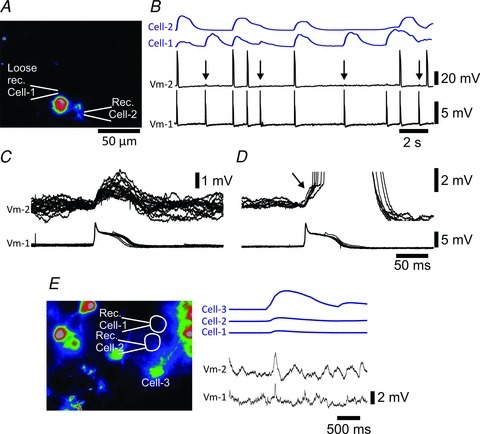
A, image, and position of the recording pipettes, of two simultaneously recorded dmcc neurons corresponding in time to the first pair of action potentials in the traces shown in B. The recording from Cell-1 was accidentally made through a thin drawn-out membrane bridge, which is why the action potential amplitude in Cell-1 (Vm-1) is very small. B, spontaneous action potentials (Vm-1 and -2, lower traces), and associated ΔF waveforms (Cell-1 and -2, upper traces) from the cells shown in A. Note that small spikelet-like potentials are occasionally present in the Vm-2 (arrows) at times where Vm-1 shows action potentials. C, overlaid traces of action potentials in Vm-1 and spikelet-like potentials in Vm-2 from the cell pair in A and B. D, overlaid traces of action potentials in Vm-1 and pre-potentials (arrow) preceding action potentials (truncated) in Vm-2. E, left panel: image, and position of the recording pipettes, of two simultaneously recorded dmcc neurons corresponding in time to the cluster formation in the traces shown to the right. Right panel: spontaneous spikelet-like potentials (Vm-1 and -2, lower traces), and associated ΔF waveforms (Cell-1, -2 and -3, upper traces) from the cells shown in the left panel. Cell-3 showed a strong calcium transient in phase with surrounding neurons, i.e. forming a cluster.
Discussion
Calcium imaging of transverse slices of the rostral part of the IO revealed that dmcc and PO neurons spontaneously form clusters of co-active neurons under in vitro conditions. The dmcc show regular and the PO irregular repeating clusters, and whole-cell patch clamp recordings suggest electrical coupling may underlie cluster formation. Spontaneous clusters were present in P1 to P15 animals, which coincides with an important postnatal developmental period where the olivocerebellar system undergoes considerable maturation. A fundamental unanswered question is whether these spontaneous clusters are present in the intact animals in the same postnatal period.
Spontaneous activity in the IO
The IO region showed a markedly higher spontaneous activity than the rest of the surface of the transversely cut brainstem, and a relatively high and age-dependent calcium transient frequency was recorded in individual IO neurons. IO neurons may have electroresponsive membrane properties that keep them above threshold for spontaneous firing under the experimental conditions used in this study. Control experiments showed that the lowered extracellular calcium, and not the relatively high extracellular potassium concentration used in the normal ACSF, was most likely inducing the relative increase in IO excitability, but other differences in the ACSF composition may also explain why IO neurons in this study show such high spontaneous activity. Relatively high extracellular potassium and low calcium was used to increase the overall excitability of the slice; a similar ACSF produced robust spontaneous respiratory activity in a brainstem slice preparation from newborn mice (Falk & Rekling, 2009). An alternative explanation is that the IO neurons receive spontaneous excitatory or modulatory synaptic input from sources contained in the 950 μm thick slice. The thickness itself may also be a contributory factor, as it is unclear to what depths IO neurons remain functional due to anoxia, and dying neurons may release substances that could affect the activity in surface neurons. Long-distance afferent input to the IO, such as regions above the caudal brainstem, e.g. sensorimotor cortex, and several nuclei in the mesencephalon have obviously been disconnected in this preparation. However, nearby nuclei, such as the dorsal column nuclei, the raphe nuclei, the parasolitary nucleus and the lateral reticular nucleus are contained in the thick slice, and may supply excitatory, inhibitory or modulatory input to the IO under the current experimental in vitro conditions (Brown et al. 1977; Barmack et al. 1998; Placantonakis et al. 2000). Thus, the difference between the spontaneous activity and repetitive cluster formation in the dmcc and PO could also result from differences in the afferent nuclei to each region contained in the thick slice. A third possibility is that the spontaneous calcium transients in the IO appear stronger than transients coming from other neurons at the slice surface because of the peculiar electrophysiological characteristics of the IO action potentials, which are among the broadest among CNS neurons, allowing a substantial amount of calcium in during the spike (Llinás & Yarom, 1981a,b; Mathy et al. 2009). However, similar experimental conditions readily pick up calcium transients from other cyclically active neurons with action potentials of shorter duration in the brainstem at low magnifications (Falk & Rekling, 2009).
Cluster formation in the dmcc and PO
The dmcc and PO showed regular and irregular repeating clusters of co-active neurons with a transverse diameter of approximately 100–200 μm. Bilateral synchrony of climbing fibre activity in the rat cerebellar cortex is suggested to result from dendrodendritic electrotonic coupling between neurons of the left and right dmcc (De Zeeuw et al. 1996), but in the in vitro experiments reported here we did not observe synchronization of cluster activity between the two sides. This lack of bilateral synchrony under in vitro conditions could be due to severed midline-crossing dendrites by the cutting procedure. Several characteristics were different among the dmcc and PO regions: the spontaneous calcium transient frequency in individual neurons was higher in dmcc at ages P7.5 to P12.5; the dmcc cluster size was bigger both in maximal diameter and area; the decrease in coherence with Euclidean distance in the dmcc was less steep, reaching low values at 200 μm versus 100 μm in the PO; the cluster repetition rate was much higher in the dmcc; and complex network analyses showed that the relative frequency in the node degree histogram from the dmcc was increasing with increasing number of links, whereas it was decreasing in the PO. The dmcc is generally believed to be part of the central vestibular system that involves the vestibular nuclei, several IO subnuclei, and the posterior cerebellum, but also incorporates sensory inputs from the optokinetic circuitry, central visual systems and neck proprioceptive systems (Barmack, 2003). Thus, IO neurons in the dmcc convey vestibular information to the cerebellum in the form of complex spikes in Purkinje cells in folia 8–10, but also affect vestibular-modulated simple spike firing, presumably by affecting stellate cells in the cerebellar cortex (Barmack, 2003; Barmack & Yakhnitsa, 2011). Postural response, such as the righting reflex, is one of the first complex motor behaviours to appear postnatally (P2) in mice (Glynn et al. 2007), with obvious advantages to the animal in its new extrauterine environment. The behaviour probably involves vestibular and somatosensory systems, and we propose that the dmcc–cerebellar system may already be functional at this early postnatal age. In this context, it is interesting that a number of molecular markers appear to be distinct to the dmcc and appear early in development (Wassef et al. 1992; Chen et al. 2006). Thus, at P3 in the rat the dmcc shows strong expression of calbindin, whereas the majority of the PO only begins to express calbindin at P12 to P14. A similar pattern is noted in the expression of the AMPA receptor subunit GluR1, which is first expressed at high levels at P7 in rat in the dmcc, and the beta subnucleus, only to be followed by increasing expression levels in the PO up to adulthood. It is tempting to speculate, that these molecular differences, and the dmcc data presented here, are hints of a general scheme where vestibular-related IO neurons are on a fast developmental track because a functional vestibular system early in postnatal life is of critical importance in orienting the animal towards the lactating mother.
The spontaneous dmcc and PO clusters reported here share many similarities to stimulus-evoked ensemble subthreshold neuronal oscillations in the IO (Leznik et al. 2002; Leznik & Llinás, 2005). In these series of elegant studies, voltage-dependent dye-imaging was used to demonstrate stimulus-evoked ensembles composed of closely spaced synchronous subthreshold oscillatory activity throughout the IO of P10 to P20 rats. The size of the stimulus-evoked subthreshold ensembles was comparable to the cluster size reported here (20 × 10−3 mm2versus∼16 × 10−3 mm2), and consisted of a core and a rim of loosely grouped cells. A third study using voltage-dependent dye-imaging in 2- to 3-week-old rats demonstrated that the dorsal cap of Kooy, which is an oculomotor-related IO subnucleus, also shows stimulus-evoked time-coherent activation resembling the cluster formation presented here (Urbano et al. 2006). Spontaneous ensemble activity was not reported in these three studies, but patches of spontaneous oscillatory activity was noted in an voltage-imaging study with low spatial resolution (Devor & Yarom, 2002). Thus, the IO appears to be able to generate both subthreshold and firing synchronicity in neighbouring neurons in clusters that may contain hundreds of neurons.
Mechanisms underlying cluster formation, and developmental implications
Electrical coupling is critical for the generation of stimulus-evoked clusters of subthreshold neuronal oscillations (Leznik & Llinás, 2005), and an important determinant of the proper timing of IO action potentials with important consequences for learning-dependent timing in cerebellar motor control (Van Der Giessen et al. 2008). The exact time when functional gap junctions begin to form in the IO is still unclear. Developmental studies in rat and mouse suggest that it may happen around P10, but the presence of connexin45 and connexin36 earlier (starting at P1) raises the possibility that premature neuronal gap junctions may form before P10 (Van Der Giessen et al. 2006). Data presented here also suggest that electrotonic transfer of current through gap junctions underlies the spike synchronicity during spontaneous cluster formation. Thus, in dual whole-cell recordings we observed spikelet-like potentials in neighbouring neurons during cluster formation, and when two neurons were firing simultaneously during cluster formation one spike was preceded by a pre-potential. We did not directly test for the presence of electrical coupling between neurons, since the concurrent imaging had to be done immediately after break-in before the ΔF signal disappeared in the AM-loaded neurons, and we suspect that long-term whole-cell path recording may interfere with the gap junctional coupling. Thus, the presence of electrical coupling between IO neurons comprising a cluster in these age ranges still needs to be firmly demonstrated. However, we suggest that these observations can be explained by regenerative or passive backpropagating action potentials that in filtered versions pass through dendrodendritic gap junctions and evoke action potentials in electrically coupled neurons. When considering hundreds of neurons within a cluster the timing of the current transfer will be affected by the filtering properties of the dendrites, gap junctional conductances, the somatic membrane capacitance, and a dispersion in spike–spike coincidence is expected. Indeed, a certain amount of jitter was noted in the calcium transient coincidence in both the dmcc and PO, which increased with distance between individual neurons. The current transfer between two IO neurons may also be under modulatory control. Modulation of gap junctions between IO neurons is an idea that has been around for several years (De Zeeuw et al. 1998; Jacobson et al. 2008), with no direct experimental support. Indirect evidence suggests that GABAergic signalling, possibly derived from the deep cerebellar nuclei, and glutamatergic signalling may dynamically change coupling strength between IO neurons by affecting the current transfer in dendritic glomerular structures (Lang et al. 1996; Lang, 2002; Best & Regehr, 2009). However, it is also possible that coupling strength may be affected by intracellular processes in IO neurons. Connexin36, which is one of the connexins present in IO dendrodendritic gap junctions (De Zeeuw et al. 2003; Van Der Giessen et al. 2006, 2008), is strongly regulated by pH and may couple to calcium signalling via interaction with calcium/calmodulin-dependent kinase II (Alev et al. 2008; Gonzalez-Nieto et al. 2008). Blockade of background GABAergic signalling, using picrotoxin, increased the size of stimulus-evoked clusters of subthreshold neuronal oscillations (Leznik et al. 2002), suggesting that electrical coupling may be under tonic GABAergic control. Variation in the level of this tonic inhibition could also affect the number of neurons participating in repeating clusters.
Coherence among dmcc and PO neurons decreased with increasing Euclidean distance, and PO clusters contain hub-like neurons that show co-activity with many other neurons within the cluster. The decrease in coherence could be explained by a decrease in spike coincidence, which could result from a decreasing current transfer through gap junctions the further apart IO neurons are, maybe due to dendritic filtering or a systematic decrease in gap junctional conductances. It may also be the result of a serial cell to cell arrangement within a cluster, i.e. cell-1 is coupled to cell-2, which is coupled to cell-3 etc. Such an arrangement would also be expected to give rise to a lower spike coincidence between cells far apart, but still part of the same cluster. The age-dependent increase in coherence could be the result of maturation of electrical coupling among IO neurons with an increase in coupling strengths. Activity-dependent mechanisms might also play a role in determining the strength of electrical coupling between neighbouring neurons, which in 14- to 18-day-old rats demonstrates a surprisingly large heterogeneity even among individual IO neurons and their immediate neighbours (Hoge et al. 2011). The irregular repeating clusters in the PO may also result from heterogeneity in electrical coupling, since modelling efforts show that non-periodic synchronization in networks of spiking neurons may result from recurrent excitatory positive feedback between heterogeneously coupled cells (Thivierge & Cisek, 2008). The presence of hub-like neurons might result from selective developmental processes, such as those proposed for scale-free networks, where hub-neurons arise by a ‘preferential attachment rule’, i.e. each newcoming neuron in a connected network has a higher probability to link to already highly connected hub-neurons (Feldt et al. 2011b). Thus, building up clusters of electrically coupled IO neurons could be based around hub-like neurons that are the first neurons to demark a given cluster, and the strength of the electrical coupling could follow a principle where the first connected become the strongest coupled. The spontaneous cluster formation reported in these experiments showed a marked age-dependent increase at P5 to P11, followed by a drop to almost zero at P15.5. This period coincides with the developmental window where the terminal arborization of climbing fibres in the cerebellar cortex is reduced so that single Purkinje cells become innervated by a single climbing fibre (Nishiyama & Linden, 2004; Sugihara, 2006). The abrupt drop in cluster formation at P15.5 remains unexplained, and may be an artefact due to an increase in the cellular sensitivity to anoxia in the preparation, but could also be the normal closure of the developmental time window that sustains spontaneous cluster formation. In conclusion, the IO shows spontaneous cluster activity under in vitro conditions. This synchronized activity coincides with a critical postnatal period in olivocerebellar development, and may be involved in reducing redundant synapses in the olivocerebellar projection in an activity-dependent manner (Bosman & Konnerth, 2009), and the construction of olivocerebellar modules.
Acknowledgments
This work was supported by the Danish Medical Council, the NovoNordisk Foundation, Den Owensenke Fond, Lægeforeningens forskningsfond, and Agnes og Pouls Friis Fond. We thank Lis Hansen for technical assistance.
Glossary
Abbreviations
- ACSF
artificial cerebrospinal fluid solution
- dmcc
dorsomedial cell column
- IO
inferior olivary nucleus
- PO
principal olive
- RF
reticular formation
- RMS
root mean square
- ROI
region of interest
Author contributions
J.C.R. and H.J. contributed to the conception and design of the experiments and to the collection, analysis and interpretation of data. K.H.R.J. contributed to the analysis and interpretation of data. All authors contributed to drafting the article or revising it critically for important intellectual content. All authors approved the final version of the manuscript.
References
- Alev C, Urschel S, Sonntag S, Zoidl G, Fort AG, Hoher T, Matsubara M, Willecke K, Spray DC, Dermietzel R. The neuronal connexin36 interacts with and is phosphorylated by CaMKII in a way similar to CaMKII interaction with glutamate receptors. Proc Natl Acad Sci U S A. 2008;105:20964–20969. doi: 10.1073/pnas.0805408105. [DOI] [PMC free article] [PubMed] [Google Scholar]
- Apps R, Garwicz M. Anatomical and physiological foundations of cerebellar information processing. Nat Rev Neurosci. 2005;6:297–311. doi: 10.1038/nrn1646. [DOI] [PubMed] [Google Scholar]
- Apps R, Hawkes R. Cerebellar cortical organization: a one-map hypothesis. Nat Rev Neurosci. 2009;10:670–681. doi: 10.1038/nrn2698. [DOI] [PubMed] [Google Scholar]
- Barmack NH. Central vestibular system: vestibular nuclei and posterior cerebellum. Brain Res Bull. 2003;60:511–541. doi: 10.1016/s0361-9230(03)00055-8. [DOI] [PubMed] [Google Scholar]
- Barmack NH, Fredette BJ, Mugnaini E. Parasolitary nucleus: a source of GABAergic vestibular information to the inferior olive of rat and rabbit. J Comp Neurol. 1998;392:352–372. doi: 10.1002/(sici)1096-9861(19980316)392:3<352::aid-cne6>3.0.co;2-0. [DOI] [PubMed] [Google Scholar]
- Barmack NH, Yakhnitsa V. Microlesions of the inferior olive reduce vestibular modulation of Purkinje cell complex and simple spikes in mouse cerebellum. J Neurosci. 2011;31:9824–9835. doi: 10.1523/JNEUROSCI.1738-11.2011. [DOI] [PMC free article] [PubMed] [Google Scholar]
- Best AR, Regehr WG. Inhibitory regulation of electrically coupled neurons in the inferior olive is mediated by asynchronous release of GABA. Neuron. 2009;62:555–565. doi: 10.1016/j.neuron.2009.04.018. [DOI] [PMC free article] [PubMed] [Google Scholar]
- Bosman LW, Konnerth A. Activity-dependent plasticity of developing climbing fiber-Purkinje cell synapses. Neuroscience. 2009;162:612–623. doi: 10.1016/j.neuroscience.2009.01.032. [DOI] [PubMed] [Google Scholar]
- Bourrat F, Sotelo C. Postnatal development of the inferior olivary complex in the rat. I. An electron microscopic study of the medial accessory olive. Brain Res. 1983;284:291–310. doi: 10.1016/0165-3806(83)90013-5. [DOI] [PubMed] [Google Scholar]
- Brown JT, Chan-Palay V, Palay SL. A study of afferent input to the inferior olivary complex in the rat by retrograde axonal transport of horseradish peroxidase. J Comp Neurol. 1977;176:1–22. doi: 10.1002/cne.901760102. [DOI] [PubMed] [Google Scholar]
- Cerminara NL, Apps R. Behavioural significance of cerebellar modules. Cerebellum. 2011;10:484–494. doi: 10.1007/s12311-010-0209-2. [DOI] [PMC free article] [PubMed] [Google Scholar]
- Chedotal A, Sotelo C. Early development of olivocerebellar projections in the fetal rat using CGRP immunocytochemistry. Eur J Neurosci. 1992;4:1159–1179. doi: 10.1111/j.1460-9568.1992.tb00142.x. [DOI] [PubMed] [Google Scholar]
- Chen LW, Tse YC, Li C, Guan ZL, Lai CH, Yung KK, Shum DK, Chan YS. Differential expression of NMDA and AMPA/KA receptor subunits in the inferior olive of postnatal rats. Brain Res. 2006;1067:103–114. doi: 10.1016/j.brainres.2005.10.054. [DOI] [PubMed] [Google Scholar]
- Devor A, Yarom Y. Generation and propagation of subthreshold waves in a network of inferior olivary neurons. J Neurophysiol. 2002;87:3059–3069. doi: 10.1152/jn.2002.87.6.3059. [DOI] [PubMed] [Google Scholar]
- De Zeeuw CI, Chorev E, Devor A, Manor Y, van der Giessen RS, de Jeu MT, Hoogenraad CC, Bijman J, Ruigrok TJ, French P, Jaarsma D, Kistler WM, Meier C, Petrasch-Parwez E, Dermietzel R, Sohl G, Gueldenagel M, Willecke K, Yarom Y. Deformation of network connectivity in the inferior olive of connexin 36-deficient mice is compensated by morphological and electrophysiological changes at the single neuron level. J Neurosci. 2003;23:4700–4711. doi: 10.1523/JNEUROSCI.23-11-04700.2003. [DOI] [PMC free article] [PubMed] [Google Scholar]
- De Zeeuw CI, Lang EJ, Sugihara I, Ruigrok TJ, Eisenman LM, Mugnaini E, Llinás R. Morphological correlates of bilateral synchrony in the rat cerebellar cortex. J Neurosci. 1996;16:3412–3426. doi: 10.1523/JNEUROSCI.16-10-03412.1996. [DOI] [PMC free article] [PubMed] [Google Scholar]
- De Zeeuw CI, Simpson JI, Hoogenraad CC, Galjart N, Koekkoek SK, Ruigrok TJ. Microcircuitry and function of the inferior olive. Trends Neurosci. 1998;21:391–400. doi: 10.1016/s0166-2236(98)01310-1. [DOI] [PubMed] [Google Scholar]
- Drummond GB. Reporting ethical matters in The Journal of Physiology: standards and advice. J Physiol. 2009;587:713–719. doi: 10.1113/jphysiol.2008.167387. [DOI] [PMC free article] [PubMed] [Google Scholar]
- Falk S, Rekling JC. Neurons in the preBotzinger complex and VRG are located in proximity to arterioles in newborn mice. Neurosci Lett. 2009;450:229–234. doi: 10.1016/j.neulet.2008.11.042. [DOI] [PubMed] [Google Scholar]
- Feldt S, Bonifazi P, Cossart R. Dissecting functional connectivity of neuronal microcircuits: experimental and theoretical insights. Trends Neurosci. 2011a;34:225–236. doi: 10.1016/j.tins.2011.02.007. [DOI] [PubMed] [Google Scholar]
- Feldt S, Bonifazi P, Cossart R. Dissecting functional connectivity of neuronal microcircuits: experimental and theoretical insights. Trends Neurosci. 2011b;34:225–236. doi: 10.1016/j.tins.2011.02.007. [DOI] [PubMed] [Google Scholar]
- Funke F, Dutschmann M, Muller M. Imaging of respiratory-related population activity with single-cell resolution. Am J Physiol Cell Physiol. 2007;292:C508–C516. doi: 10.1152/ajpcell.00253.2006. [DOI] [PubMed] [Google Scholar]
- Glynn D, Sizemore RJ, Morton AJ. Early motor development is abnormal in complexin 1 knockout mice. Neurobiol Dis. 2007;25:483–495. doi: 10.1016/j.nbd.2006.10.011. [DOI] [PubMed] [Google Scholar]
- Gonzalez-Nieto D, Gomez-Hernandez JM, Larrosa B, Gutierrez C, Munoz MD, Fasciani I, O’Brien J, Zappala A, Cicirata F, Barrio LC. Regulation of neuronal connexin-36 channels by pH. Proc Natl Acad Sci U S A. 2008;105:17169–17174. doi: 10.1073/pnas.0804189105. [DOI] [PMC free article] [PubMed] [Google Scholar]
- Groenewegen HJ, Voogd J, Freedman SL. The parasagittal zonation within the olivocerebellar projection. II. Climbing fiber distribution in the intermediate and hemispheric parts of cat cerebellum. J Comp Neurol. 1979;183:551–601. doi: 10.1002/cne.901830307. [DOI] [PubMed] [Google Scholar]
- Hoge GJ, Davidson KG, Yasumura T, Castillo PE, Rash JE, Pereda AE. The extent and strength of electrical coupling between inferior olivary neurons is heterogeneous. J Neurophysiol. 2011;105:1089–1101. doi: 10.1152/jn.00789.2010. [DOI] [PMC free article] [PubMed] [Google Scholar]
- Horn KM, Pong M, Gibson AR. Functional relations of cerebellar modules of the cat. J Neurosci. 2010;30:9411–9423. doi: 10.1523/JNEUROSCI.0440-10.2010. [DOI] [PMC free article] [PubMed] [Google Scholar]
- Jacobson GA, Rokni D, Yarom Y. A model of the olivo-cerebellar system as a temporal pattern generator. Trends Neurosci. 2008;31:617–625. doi: 10.1016/j.tins.2008.09.005. [DOI] [PubMed] [Google Scholar]
- Lang EJ. GABAergic and glutamatergic modulation of spontaneous and motor-cortex-evoked complex spike activity. J Neurophysiol. 2002;87:1993–2008. doi: 10.1152/jn.00477.2001. [DOI] [PubMed] [Google Scholar]
- Lang EJ, Sugihara I, Llinás R. GABAergic modulation of complex spike activity by the cerebellar nucleoolivary pathway in rat. J Neurophysiol. 1996;76:255–275. doi: 10.1152/jn.1996.76.1.255. [DOI] [PubMed] [Google Scholar]
- Leznik E, Llinás R. Role of gap junctions in synchronized neuronal oscillations in the inferior olive. J Neurophysiol. 2005;94:2447–2456. doi: 10.1152/jn.00353.2005. [DOI] [PubMed] [Google Scholar]
- Leznik E, Makarenko V, Llinás R. Electrotonically mediated oscillatory patterns in neuronal ensembles: an in vitro voltage-dependent dye-imaging study in the inferior olive. J Neurosci. 2002;22:2804–2815. doi: 10.1523/JNEUROSCI.22-07-02804.2002. [DOI] [PMC free article] [PubMed] [Google Scholar]
- Llinás R, Yarom Y. Electrophysiology of mammalian inferior olivary neurones in vitro. Different types of voltage-dependent ionic conductances. J Physiol. 1981a;315:549–567. doi: 10.1113/jphysiol.1981.sp013763. [DOI] [PMC free article] [PubMed] [Google Scholar]
- Llinás R, Yarom Y. Properties and distribution of ionic conductances generating electroresponsiveness of mammalian inferior olivary neurones in vitro. J Physiol. 1981b;315:569–584. doi: 10.1113/jphysiol.1981.sp013764. [DOI] [PMC free article] [PubMed] [Google Scholar]
- Manzini I, Schweer TS, Schild D. Improved fluorescent (calcium indicator) dye uptake in brain slices by blocking multidrug resistance transporters. J Neurosci Methods. 2008;167:140–147. doi: 10.1016/j.jneumeth.2007.07.018. [DOI] [PubMed] [Google Scholar]
- Mathy A, Ho SS, Davie JT, Duguid IC, Clark BA, Hausser M. Encoding of oscillations by axonal bursts in inferior olive neurons. Neuron. 2009;62:388–399. doi: 10.1016/j.neuron.2009.03.023. [DOI] [PMC free article] [PubMed] [Google Scholar]
- Mostofi A, Holtzman T, Grout AS, Yeo CH, Edgley SA. Electrophysiological localization of eyeblink-related microzones in rabbit cerebellar cortex. J Neurosci. 2010;30:8920–8934. doi: 10.1523/JNEUROSCI.6117-09.2010. [DOI] [PMC free article] [PubMed] [Google Scholar]
- Mukamel EA, Nimmerjahn A, Schnitzer MJ. Automated analysis of cellular signals from large-scale calcium imaging data. Neuron. 2009;63:747–760. doi: 10.1016/j.neuron.2009.08.009. [DOI] [PMC free article] [PubMed] [Google Scholar]
- Namba K, Sugihara I, Hashimoto M. Close correlation between the birth date of Purkinje cells and the longitudinal compartmentalization of the mouse adult cerebellum. J Comp Neurol. 2011;519:2594–2614. doi: 10.1002/cne.22640. [DOI] [PubMed] [Google Scholar]
- Nishiyama H, Linden DJ. Differential maturation of climbing fiber innervation in cerebellar vermis. J Neurosci. 2004;24:3926–3932. doi: 10.1523/JNEUROSCI.5610-03.2004. [DOI] [PMC free article] [PubMed] [Google Scholar]
- Ozden I, Sullivan MR, Lee HM, Wang SS. Reliable coding emerges from coactivation of climbing fibers in microbands of cerebellar Purkinje neurons. J Neurosci. 2009;29:10463–10473. doi: 10.1523/JNEUROSCI.0967-09.2009. [DOI] [PMC free article] [PubMed] [Google Scholar]
- Paradies MA, Eisenman LM. Evidence of early topographic organization in the embryonic olivocerebellar projection: a model system for the study of pattern formation processes in the central nervous system. Dev Dyn. 1993;197:125–145. doi: 10.1002/aja.1001970206. [DOI] [PubMed] [Google Scholar]
- Pijpers A, Voogd J, Ruigrok TJ. Topography of olivo-cortico-nuclear modules in the intermediate cerebellum of the rat. J Comp Neurol. 2005;492:193–213. doi: 10.1002/cne.20707. [DOI] [PubMed] [Google Scholar]
- Placantonakis DG, Schwarz C, Welsh JP. Serotonin suppresses subthreshold and suprathreshold oscillatory activity of rat inferior olivary neurones in vitro. J Physiol. 2000;524:833–851. doi: 10.1111/j.1469-7793.2000.00833.x. [DOI] [PMC free article] [PubMed] [Google Scholar]
- Ruigrok TJ. Ins and outs of cerebellar modules. Cerebellum. 2011;10:464–474. doi: 10.1007/s12311-010-0164-y. [DOI] [PMC free article] [PubMed] [Google Scholar]
- Schultz SR, Kitamura K, Post-Uiterweer A, Krupic J, Hausser M. Spatial pattern coding of sensory information by climbing fiber-evoked calcium signals in networks of neighboring cerebellar Purkinje cells. J Neurosci. 2009;29:8005–8015. doi: 10.1523/JNEUROSCI.4919-08.2009. [DOI] [PMC free article] [PubMed] [Google Scholar]
- Smith SS. Step cycle-related oscillatory properties of inferior olivary neurons recorded in ensembles. Neuroscience. 1998;82:69–81. doi: 10.1016/s0306-4522(97)00213-3. [DOI] [PubMed] [Google Scholar]
- Sotelo C. Cellular and genetic regulation of the development of the cerebellar system. Prog Neurobiol. 2004;72:295–339. doi: 10.1016/j.pneurobio.2004.03.004. [DOI] [PubMed] [Google Scholar]
- Sugihara I. Organization and remodeling of the olivocerebellar climbing fiber projection. Cerebellum. 2006;5:15–22. doi: 10.1080/14734220500527385. [DOI] [PubMed] [Google Scholar]
- Sugihara I, Shinoda Y. Molecular, topographic, and functional organization of the cerebellar nuclei: analysis by three-dimensional mapping of the olivonuclear projection and aldolase C labeling. J Neurosci. 2007;27:9696–9710. doi: 10.1523/JNEUROSCI.1579-07.2007. [DOI] [PMC free article] [PubMed] [Google Scholar]
- Sugihara I, Wu HS, Shinoda Y. The entire trajectories of single olivocerebellar axons in the cerebellar cortex and their contribution to cerebellar compartmentalization. J Neurosci. 2001;21:7715–7723. doi: 10.1523/JNEUROSCI.21-19-07715.2001. [DOI] [PMC free article] [PubMed] [Google Scholar]
- Thivierge JP, Cisek P. Nonperiodic synchronization in heterogeneous networks of spiking neurons. J Neurosci. 2008;28:7968–7978. doi: 10.1523/JNEUROSCI.0870-08.2008. [DOI] [PMC free article] [PubMed] [Google Scholar]
- Urbano FJ, Simpson JI, Llinás RR. Somatomotor and oculomotor inferior olivary neurons have distinct electrophysiological phenotypes. Proc Natl Acad Sci U S A. 2006;103:16550–16555. doi: 10.1073/pnas.0607888103. [DOI] [PMC free article] [PubMed] [Google Scholar]
- Van Der Giessen RS, Koekkoek SK, van Dorp S, De Gruijl JR, Cupido A, Khosrovani S, Dortland B, Wellershaus K, Degen J, Deuchars J, Fuchs EC, Monyer H, Willecke K, De Jeu MTG, De Zeeuw CI. Role of olivary electrical coupling in cerebellar motor learning. Neuron. 2008;58:599–612. doi: 10.1016/j.neuron.2008.03.016. [DOI] [PubMed] [Google Scholar]
- Van Der Giessen RS, Maxeiner S, French PJ, Willecke K, De Zeeuw CI. Spatiotemporal distribution of Connexin45 in the olivocerebellar system. J Comp Neurol. 2006;495:173–184. doi: 10.1002/cne.20873. [DOI] [PubMed] [Google Scholar]
- Wassef M, Chedotal A, Cholley B, Thomasset M, Heizmann CW, Sotelo C. Development of the olivocerebellar projection in the rat: I. Transient biochemical compartmentation of the inferior olive. J Comp Neurol. 1992;323:519–536. doi: 10.1002/cne.903230405. [DOI] [PubMed] [Google Scholar]
- Yamada M, Terao M, Terashima T, Fujiyama T, Kawaguchi Y, Nabeshima Y, Hoshino M. Origin of climbing fiber neurons and their developmental dependence on Ptf1a. J Neurosci. 2007;27:10924–10934. doi: 10.1523/JNEUROSCI.1423-07.2007. [DOI] [PMC free article] [PubMed] [Google Scholar]
- Ye JH, Zhang J, Xiao C, Kong JQ. Patch-clamp studies in the CNS illustrate a simple new method for obtaining viable neurons in rat brain slices: glycerol replacement of NaCl protects CNS neurons. J Neurosci Methods. 2006;158:251–259. doi: 10.1016/j.jneumeth.2006.06.006. [DOI] [PubMed] [Google Scholar]
- Zhu Y, Khan K, Guthrie S. Signals from the cerebellum guide the pathfinding of inferior olivary axons. Dev Biol. 2003;257:233–248. doi: 10.1016/s0012-1606(03)00061-7. [DOI] [PubMed] [Google Scholar]