

Abstract
Background
Nicotine is known to generate oxidative stress through cytochrome P450 2A6 (CYP2A6)-mediated metabolism in the liver and other organs, including macrophages. This study has been designed to examine the role of CYP2A6 in nicotine metabolism and oxidative stress in SVGA cells, an immortalized human astrocyte cell line.
Methods
SVGA astrocytes were treated with 1μM nicotine, followed by determination of mRNA and protein levels of several CYPs using quantitative RT-PCR and western blot analyses, respectively. Quantitation of nicotine and the nicotine metabolites, cotinine and nicotine-derived nitrosamine ketones (NNK), was performed using an LC-MS/MS method. The generation of reactive oxygen species (ROS) was measured using flow cytometry.
Results
Nicotine significantly upregulated mRNA and protein expression of the most abundantly expressed CYPs in SVGA astrocytes, CYP2A6 and CYP1A1. To characterize the metabolism of nicotine in astrocytes, a highly sensitive LC-MS/MS method was developed which is capable of quantifying very low concentrations of nicotine (0.3ng/ml), cotinine and NNK (0.11ng/ml). The LCMS/MS results showed that nicotine is steadily metabolized to cotinine and NNK from 0.5–4h. Finally, we showed that nicotine initially causes an increase in ROS formation which is then gradually decreased, perhaps due to the increase in superoxide dismutase level. Nicotine metabolism and ROS formation by CYP2A6 were further confirmed by using tryptamine, a selective inhibitor of CYP2A6, which significantly lowered the levels of cotinine and NNK and inhibited ROS formation.
Conclusions
CYP2A6 plays a key role in nicotine metabolism and oxidative stress in astrocytes, and this has implications in nicotine-associated brain toxicity.
Keywords: Nicotine, CYP2A6, astrocytes, LC-MS/MS, oxidative stress
1. Introduction
Nicotine, the major bioactive constituent of tobacco, is metabolized into cotinine and other less abundant metabolites, primarily by liver CYP2A6 and to some extent by CYP2B6 and CYP2D6 (Benowitz, 2009). Some of the nicotine and cotinine metabolites are further metabolized by CYP2A6 into procarcinogenic compounds, including nicotine-derived nitrosamine ketones (NNK). For example, nicotine is directly metabolized by 2′hydroxylation to aminoketone, which is converted into the carcinogen 4-(methylnitrosamino)-1-(3-pyridyl)-1-butanone (Hecht et al., 2000). In addition, nasal and lung CYP2A13 are involved in the biotransformation of NNK into a carcinogen (Benowitz, 2009; Smith et al.,1995; Wong et al., z2005). CYP2A6-mediated nicotine metabolism and the subsequent activation of reactive metabolites into procarcinogens and formation of reactive oxygen species (ROS) have been shown to be involved in liver damage and lung/pancreatic cancers (Benowitz, 2009; Demizu et al., 2008; Kadlubar et al., 2009; Smith et al., 1995). Nicotine and NNK have also been demonstrated to generate oxidative stress in microglia (Ghosh et al., 2009), neurons (Bhagwat et al., 1998), and white blood cells (Chuang and Hu, 2006). However, the mechanism by which nicotine induces oxidative stress in these cells has not been determined.
Recently, we have shown that CYP2A6 is the most abundantly expressed CYP (36% of the total CYPs) in the U937 macrophage cell line (Jin et al., 2011a). Since macrophages are critical HIV-1 reservoirs and migration of these cells into the brain may result in neuroAIDS (Aquaro et al., 2005), we studied the role of CYP2A6 in nicotine metabolism and nicotine-mediated oxidative stress in U937 macrophages (Jin et al., 2011b). Our results clearly demonstrate a role for CYP2A6 in nicotine metabolism and associated oxidative stress in these cells. Nicotine can cross the blood-brain barrier and exert its toxic effects on various brain cells, including astrocytes. Therefore, in the present study we examined the role of CYP2A6 in nicotine metabolism in astrocytes and its involvement in oxidative stress. However, in order to study nicotine metabolism in astrocytes, it was necessary to develop an extremely sensitive analytical technique to measure nicotine metabolites. In recent years, tandem triple quadrupole linear ion Qtrap mass spectrometry (LC-MS/MS) method has been increasingly used for the measurement of nicotine and its metabolites in urine samples and other cell lysates (Byrd et al., 2005; Byrd and Ogden, 2003; Jin et al., 2011b; Marclay and Saugy, 2010; Miller et al., 2010). Since the level of CYP2A6 enzyme is much lower in astrocytes than most other cells, we developed a relatively more sensitive LC-MS/MS method to determine nicotine metabolites than the methods that were available.
2. Materials and methods
2.1. Cell culture and nicotine treatment
The human SVGA astrocytic cell line was generously provided by Dr. Avindra Nath. SVGA astrocytes were cultured in Dulbecco’s modified Eagle’s medium (Cell Grow Mediatech, Inc., Manassas, VA) supplemented with 10% (v/v) fetal bovine serum and 50 μg/ml gentamycin. Astrocytes were treated with 1 μM nicotine (Sigma Aldrich, St. Louise, MO) in triplicate in a 6-well plate containing 2 ml of medium. Each experiment was repeated 2–3 times. The nicotine concentration was optimized by using various concentrations of nicotine ranging from 0.25 – 10 μM. The final concentration of nicotine that was used was 1 μM for subsequent experiments. This concentration was selected based on our preliminary observations that ≤0.5 μM nicotine did not show significant induction of CYP1A1 and CYP2A6, whereas concentrations ≥2.5 μM were unable to further enhance CYP1A1 and CYP2A6 expression levels. In addition, nicotine treatments at ≤0.5 μM showed a very low amount of cotinine and NNK formation in SVGA astrocytes. For inhibition experiments, the cells were preincubated with 20 μM of tryptamine, a specific inhibitor of CYP2A6, for 30 min prior to nicotine treatment. The number of cells used in the inhibition experiment was half of the number of cells used for measurement of nicotine. Since the sensitivity of cotinine and NNK measurements is very high, lowering the amount of the cells does not affect data analysis significantly.
2.2. RNA extraction and qRT-PCR
RNA extraction and quantitative reverse transcription polymerase reaction (qRT-PCR) were performed as described previously (Jin et al., 2011a). Briefly, RNA was extracted from nicotine-treated astrocytes using Qiagen RNeasy Kit (Qiagen, Valencia, CA). RNA (120 ng) from each sample was used for quantitative reverse transcription polymerase reaction (qRT-PCR) using a two-step TaqMan_Gene Expression Kit (Applied Biosystems, Foster City, CA) in an iCycler iQ system (Bio-Rad Laboratories, Hercules, CA). Probes for CYP1A1 (Hs01054794_m1), CYP2A6 (Hs0071162_m1), Catalase (Hs00156308_m1), and SOD1 (Hs00533490_m1) were obtained from Applied Biosystems and used according to the protocol provided by the manufacturer. Relative fold expression of both the genes was calculated using the 2−ΔΔCt method with glyceraldehyde 3-phosphate dehydrogenase (GAPDH) as the internal control.
2.3. Western blotting
Western blotting was performed as described (Jin et al., 2011a). Briefly, total cell lysates were prepared in RIPA Buffer (Boston BioProducts, Ashland, MA) and protein concentration was measured using a Pierce BCA protein assay kit (Pierce). Protein (20 μg) was loaded on an acrylamide gel and electrophoresed, followed by transfer to a PVDF membrane. After blocking the membrane in 5% non-fat dry milk, it was incubated with primary antibody (1:1000 dilution) followed by secondary antibody (1:2000 dilution) (Santa Cruz Biotechnology Inc., Santa Cruz, CA). The blot was visualized by Luminata™ crescendo western HRP substrate (Millipore corporation, Billerica, MA) using the Alpha Innotech FluorChem HD2 gel documentation system (Alpha Innotech, San Leandro, CA), and the densitometric data was analyzed using AlphaEase FC StandAlone software (version 6.0.0.14; Alpha Innotech). β-Actin was used as an internal loading control to normalize the expression of proteins.
2.4. Development of an analytic method for the measurement of nicotine, cotinine, and NNK in SVGA astrocytes
2.4.1. Preparation of standard stocks and spike solutions
Standard stocks, spike solution and samples were prepared as described previously (Earla et al., 2010; Jin et al., 2011b). Briefly, calibration curve and quality control dilutions were prepared and processed as follows: calibration curve standards (0.33–663.14 ng/mL for nicotine and 0.11–663.14 ng/mL for both cotinine and NNK) and quality control standards (0.33–435.26 ng/mL for nicotine and 0.11–435.26 ng/mL for cotinine and NNK). Spike standards dilutions 0.33–663.14ng/mL for nicotine and 0.11–663.14 ng/mL for both cotinine and NNK were made in astrocyte cell matrix samples from untreated cells. The internal standard, ritonavir (15 μg/mL) was prepared in 20% methanol. All the spike standards were stored in a freezer at −80°C until further analysis.
2.4.2. Extraction procedures and sample preparation
The intracellular concentrations of nicotine and its metabolites were determined using invasive method as described here. The SVGA astrocytes were incubated by nicotine as described in section 2.1. The cells were harvested after appropriate time and frozen at −80°C in the freezer. Astrocyte samples were thawed and homogenized in Hepes buffer, 0.1 M, pH 7.4 as described (Jin et al., 2010b). The liquid-liquid extraction technique was optimized for method development and subsequently used for SVGA astrocyte sample analysis. Then, 200 μL was of the samples were aliquoted followed by addition of 25 μL of 15.0 μg/mL freshly prepared internal standard stock. Then, 30 μL of 30 % v/v ammonia solution was added to the samples and vortexed for 1 minute. The samples were extracted by adding 1000 μL of ethyl acetate then vortexed for 2 minutes followed by centrifugation at 12,000 rpm at 4°C for 45 min. Subsequently, 850 μL of the organic layer was withdrawn and evaporated to dryness using a Speed-Vac at 4°C for 60 minutes. The dried samples were redissolved in 200 μL of mobile phase and vortexed for 1 minute. To prepare samples for LC-MS/MS analysis 200 μL calibrator, control, and nicotine-treated astrocytes, 25 μL working internal standard, and 30 μL of 30% ammonium hydroxide were mixed and evaporated to dryness at 40°C and the samples were reconstituted in 0.2 mL of mobile phase for chromatography. The final concentration of working internal standard was 1.5 μg/mL.
2.4.3. HPLC and mass spectrometry
HPLC and mass spectrometry were performed with modifications of our previously described method (Jin et al., 2011b). Briefly, complete column separation was performed on a Hybrid particle organosiloxane Xterra reverse phase carbon 18 HPLC column (50 cm x 4.6 mm (i.d.); 5 μm particle size; 50-Å pore size; Waters Corporation) using a mobile phase consisting of 250 ml HPLC water, 750 mL acetonitrile and 1 mL formic acid (88%). Sample injection volume used was 15 μL and the total analytical run time was 4 min at a flow rate 0.3 mL/min. The HPLC column void volume was approximately 300 μL. Upon running >100 samples of each nicotine, cotinine, and NNK, the variation in retention time among these runs was within 30 sec, which is acceptable for LC-MS/MS analysis. We used relatively shorter HPLC column to develop a rapid and cost-effective method without compromising the data analysis. The HPLC system consisted of a high-pressure liquid pump and autosampler (LC-20AD and SIL-20AST, Shimadzu USA) and a tandem mass spectrometer (API 32000; AB Sciex, Sciex, Faster City, CA). The HPLC column was connected directly to the heated nebulizer source of the liquid chromatography-tandem mass spectrometry (LC-MS/MS) system and the experiment was performed under conditions as described earlier (Jin et al., 2011b).
The mass spectrometry parameters for LC-MS/MS were optimized as follows: curtain and CAD gases (20 psi), gas 1 (45 psi), gas 2 (50 psi), ion spray voltage (4800 V), ionization source temperature (400°C), and dwell time (200 milliseconds). The de-clustering potentials for nicotine, cotinine, and NNK were fixed to 80, 40, and 40 V, respectively, while collision energies for nicotine, cotinine, and NNK were adjusted to 26, 28, and 15 V, respectively. The optimization of MS/MS mass spectra for nicotine, cotinine, NNK, and ritonavir was performed by MRM positive mode using ion mass transitions of m/z 163.2/130.1 for nicotine, m/z 177.4/98.3 for cotinine, m/z 208.4/122.1 for NNK, and 721.6/296.4 for ritonavir (Table 1).
Table 1.
LC-MS/MS method calibration in SVGA astrocytes.
| Compounds | MRM Transitions (m/z) | Retention time (min) | Correlation coefficient equation (y=mx+c)) | Coefficient of determination (r2) | Calibration curve range (ng/mL) | LOQ (ng/mL) |
|---|---|---|---|---|---|---|
| Nicotine | 163.2→130.1 | 1.24 | y = 175.98x + 140.36 | 0.9998 | 0.33 – 663.14 | 0.33 |
| Cotinine | 177.4→98.3 | 1.89 | y = 511.19x − 16.834 | 0.9997 | 0.11 – 663.14 | 0.11 |
| NNK | 208.4→122.1 | 2.10 | y = 215.68x + 21.742 | 0.9935 | 0.11 – 663.14 | 0.11 |
2.4.4. Quantification
The concentration of each analyte was determined by calculating the ratio of each analyte peak response relative to its respective internal standard peak response. Results from calibration analyses were used to create a calibration curve using simple linear regression analysis. The slopes and intercepts from the resulting calibration equations were used to calculate control and specimen results (Table 1). The calibration curves were linear within the concentration range of 0.11–663.1 ng/ml for cotinine (r2 = 0.9998) and NNK (r2 = 0.9935) and 0.3–663.1 ng/ml for nicotine (r2 = 0.9963).
The LC-MS/MS MRM chromatograms of nicotine, cotinine, NNK, and ritonavir in SVGA astrocytes showed no interference in the blank at the retention time of nicotine, cotinine, NNK, and ritonavir (Fig. 1). Similarly, there was a small base line peak at the lower level of quantification of all the analytes, suggesting a low signal to noise ratio (S/N). In addition, the results suggested that this LC-MS/MS method is extremely sensitive, rapid, and robust for quantifying these analytes at very low concentration levels (0.3 ng/mL for nicotine and 0.11 ng/mL for both cotinine and NNK). Finally, the peak response was directly proportional and uniform to concentrations ranging from the lower limit to the upper limit of quantification for all the analytes, demonstrating that the results are highly reproducible (Fig. 1).
Figure 1.


LC-MS/MS MRM chromatograms of nicotine (A), cotinine (B), and NNK (C) along with the internal standard ritonavir in SVGA astrocytes. The level of the blank, the lower limit of quantification, and upper limit of quantification for nicotine (top three panels), cotinine (middle three panels), and NNK (bottom three panels) are shown in the left panels. Ritonavir is shown in the right column except for the blank for each compound. The intensity (cps) is presented in the Y-axis and time (min) is presented in the X-axis. The standard linear curve of nicotine, cotinine, and NNK are shown from top to bottom in the right side of the chromatograms.
2.4.5. Recovery, precision, and accuracy
Recovery of samples was analyzed by preparing six replicates of each of two standard concentrations in human astrocytes. Recovery was performed and reported as the percentage difference between extracted and non-extracted samples as previously described (Earla et al., 2010; Jin et al., 2011b). Precision and accuracy were evaluated by analyzing calibration curve and quality control (QC) samples. Accuracy was determined by analyzing six replicates of each QC sample. Accuracy was reported as the percentage difference between the mean and the nominal concentrations divided by the nominal concentration. Precision was reported using the coefficient of variation (CV) (standard deviation/mean concentration) multiplied by 100. The limit of quantitation was optimized for each analyte, 0.33 ng/mL for nicotine and 0.11 ng/ml for both cotinine and NNK.
The recoveries, accuracy, precision, and coefficient of variation (CV) of nicotine, cotinine, and NNK in astrocytes are presented in Table 2. The recoveries for nicotine, cotinine, and NNK were 97.5%, 85.9%, and 78.4%, respectively. The accuracies for nicotine, cotinine, and NNK were in the range of 82–114%, 89–118%, and 86–117%, respectively. The coefficients of variation for nicotine, cotinine, and NNK were within 14.6%, 11.9%, and 17.0%, respectively. The limits of quantitation accuracy were 115.2 % for nicotine, 96.5 for cotinine and 83.3 for NNK and precision were within 14.9% for nicotine, 4.5% for cotinine and 9.3% for NNK (Table 2).
Table 2.
Validation and stability of nicotine, cotinine, and NNK in SVGA astrocytes. Nicotine and its metabolites standards (CC, n = 4), quantity control validation standards (QCV, n = 18) and stability quality control standards (STQC, n = 6)
| Nicotine | Cotinine | NNK | |||||
|---|---|---|---|---|---|---|---|
|
| |||||||
| Nominal Conc. (ng/mL) | Calculated Conc (ng/mL) | % CV (±) | Calculated Conc. (ng/mL) | % CV (±) | Calculated Conc. (ng/mL) | % CV (±) | |
| CC-1 | 0.11 | 0.105 ± 0.005 | 4.5 | 0.091 ± 0.016 | 17.3 | ||
| CC-2 | 0.33 | 0.28 ± 0.041 | 14.9 | 0.32 ± 0.0091 | 2.8 | 0.29 ± 0.043 | 11.9 |
| CC-3 | 1.09 | 1.12 ± 0.03 | 2.1 | 1.18 ± 0.09 | 7.6 | 1.25 ± 0.16 | 14.0 |
| CC-4 | 10.86 | 12.0 ± 1.135 | 9.4 | 12.02 ± 1.10 | 9.6 | 11.02 ± 0.05 | 0.5 |
| CC-5 | 36.21 | 31.98 ± 3.89 | 12.5 | 35.65 ± 0.89 | 2.5 | 32.65 ± 3.51 | 10.7 |
| CC-6 | 103.45 | 119.21 ± 17.1 | 14.1 | 111.21 ± 7.30 | 6.5 | 121.21 ± 19.3 | 16.0 |
| CC-7 | 258.62 | 278.34 ± 18.63 | 6.6 | 240.34 ± 19.3 | 8.0 | 235.43 ± 22.92 | 9.9 |
| CC-8 | 431.04 | 420.59 ± 14.1 | 3.4 | 430.57 ± 5.0 | 1.1 | 475.59 ± 50.10 | 10.2 |
| CC-9 | 663.14 | 689.92 ± 21.1 | 3.0 | 642.36 ± 55.97 | 8.7 | 672.39 ± 95.59 | 14.3 |
| QCV-1 | 0.11 | 0.091 ± 0.016 | 17.3 | 0.091 ± 0.0082 | 9.0 | ||
| QCV-2 | 0.33 | 0.28 ± 0.041 | 9.6 | 11.7 ± 1.9 | 9.0 | 12.2 ± 2.6 | 1.2 |
| QCV-3 | 10.97 | 11.03 ± 0.06 | 0.6 | 10.4 ± 0.1 | 8.2 | 10.49 ± 0.63 | 9.9 |
| QCV-4 | 36.56 | 37.59 ± 4.1 | 13.8 | 340.9 ± 6.6 | 9.8 | 35.9 ± 21.7 | 9.3 |
| QCV-5 | 104.46 | 120.9 ± 13.1 | 10.5 | 118.3 ± 17.5 | 14.7 | 119.3 ± 23.5 | 19.6 |
| QCV-6 | 435.26 | 470.8 ± 19.7 | 4.1 | 479.7 ± 34.1 | 7.2 | 467.7 ± 35.1 | 7.4 |
| STQC-1 | 0.11 | 0.091 ± 0.016 | 17.3 | 0.095 ± 0.0082 | 8.6 | ||
| STQC-2 | 0.33 | 0.28 ± 0.041 | 9.6 | 0.27 ± 0.04 | 18.5 | 0.36 ± 0.016 | 4.4 |
| STQC--3 | 10.97 | 12.2 ± 2.6 | 1.2 | 10.4 ± 0.1 | 0.96 | 10.49 ± 0.63 | 9.9 |
| STQC--4 | 36.56 | 31.98 ± 3.89 | 12.4 | 34.9 ± 4.6 | 13.4 | 35.9 ± 1.7 | 5.9 |
| STQC--5 | 104.46 | 124.9 ± 23.1 | 18.5 | 100.4 ± 0.1 | 1.2 | 96.3 ± 13.5 | 14.0 |
| STQC--6 | 435.26 | 465.8 ± 17.9 | 3.8 | 479.7 ± 34.1 | 7.5 | 473.7 ± 31.1 | 6.5 |
2.4.6. Stability analysis
In order to evaluate the stability of nicotine, cotinine, and NNK in astrocytes, we prepared six individual specimens of SVGA astrocytes containing nicotine, cotinine, and NNK of each of six concentration levels and we assessed analyte stability at different temperatures (ambient, 4°C, and −80°C), after 34 days. The mean results from six replicates for each replicate, temperature, and concentrations were compared with the standard calibration values and expressed as percentages of accuracy and coefficient of variation (CV). The results are shown in Table 2.
2.5. Measurements of Reactive oxygen Species (ROS)
The production of ROS was measured by flow cytometry using dichlorofluoroscein diacetate (DCFDA; Invitrogen) as described previously (Jin et al., 2011b). Briefly, the astrocytes were treated with nicotine using serum-free medium at different times in a 6-well plate. After nicotine treatment the cells were washed with PBS and incubated with 10 μM DCFDA and 1% glucose in PBS for 30 min at 37°C. Then the cells were harvested and dissolved in 1 ml PBS with 1% FBS to measure the DCF emission at 525 ± 20 nm by flow cytometer (BD Biosciences, San Jose, CA), and Mean Fluorescence Intensity (MFI) was measured and analyzed.
2.6. Statistical analysis
Statistical analysis was performed to determine mean ± SD and a student t-test was applied to determine p values. A p value of ≤ 0.05 was considered significant.
3. Results
3.1. Induction of CYP1A1 and CYP2A6 by nicotine in SVGA astrocytes
First, the basal levels of mRNA of CYP enzymes were determined in the SVGA astrocyte cell line. Interestingly, the relative mRNA expression levels of CYP2A6 and CYP1A1 were 56% and 43% of the total CYPs’ mRNA expression in SVGA. The remaining 1% accounted for CYP1A2, CYP2B6, CYP2C9, CYP2C19, CYP2D6, CYP2E1, CYP3A4, and CYP3A5. Furthermore, exposure of astrocytes to nicotine resulted in significant up regulation of CYP1A1 mRNA at 1h (150%) and CYP2A6 mRNA between 1 and 6 h (~200%) (Fig. 2). Although there was no change in CYP1A1 mRNA level at later time points, CYP2A6 mRNA was down regulated at 12 h nicotine treatment. To ensure that the mRNA induction was consistent with the protein induction, we measured levels of CYP1A1 and CYP2A6 proteins (Fig. 3). Nicotine induced levels of CYP1A1 that were 170% relative to that of control CYP1A1 at 3 h, as well as levels of CYP2A6 that were 140% and 230% relative to that of control at 1 h and 3 h, respectively. Similar to CYP2A6 mRNA, nicotine down regulated CYP2A6 protein at 12 h. However, the mRNA expression of CYP2A6 lasted longer (6 h) than the protein expression (Fig. 2 vs. Fig 3). Our previous study with CYP2B6 in U937 macrophages also showed similar finding (Jin et al., 2010a). It is possible that the turnover rate/degradation of CYP2A6 protein may be relatively higher than CYP1A1 protein in SVGA astrocytes. Overall, our findings that CYP2A6 is the most abundant CYP in astrocytes and that even higher levels of expression are induced by nicotine, suggest its important role in nicotine metabolism and nicotine metabolite-associated oxidative stress in astrocytes.
Figure 2.

Effect of nicotine on mRNA expression of CYP1A1 and CYP2A6 in SVGA astrocytes. The SVGA astrocytes were treated with 1 μM nicotine for 0.5, 1, 3, 6, and 12 h. The percentage mRNA levels were calculated using qRT-PCR, with 100% expression normalized for the control at every time point. Expression of both the CYP genes was normalized to glyceraldehyde 3-phosphate dehydrogenase. In the above figures, the X-axis represents treatment time (hours) and Y-axis represents % mRNA expression. * Represents p ≤ 0.05 compared to respective controls.
Figure 3.

Effect of nicotine on levels of protein expression of CYP1A1 and CYP2A6. The SVGA astrocytes were treated with 1 μM nicotine for 0.5, 1, 3, 6, and 12h and the protein was isolated. The percentage protein expression was calculated by quantifying the immunoblots, with 100% expression normalized to the untreated cells (control) at every time points. Expression of CYP1A1 and CYP2A6 was normalized against β-actin. In the above figures, X-axis represents treatment time (hours) and Y-axis represents % protein expression. * Represents p ≤ 0.05 compared to respective controls.
3.2. Metabolism of nicotine by CYP2A6 in SVGA astrocytes
The metabolism of nicotine in SVGA astrocytes was analyzed using the LC-MS/MS method as described in Materials and Methods and depicted in Figure 4A. Figure 4B shows representative MRM chromatogram profiles of nicotine, cotinine, and NNK. Figure 4C shows the kinetic profile of cotinine and NNK formation. A very low amount of cotinine (5–7 ng/ml) and NNK (1–3 ng/ml) was detected in astrocytes. To ensure that CYP2A6 is involved in nicotine-metabolism, cotinine and NNK levels were measured in the presence of tryptamine, a CYP2A6 specific inhibitor (Zhang et al., 2001). Tryptamine decreased cotinine formation by approximately 80% at both 1 h and 2 h, whereas NNK formation was reduced by 60% at 1h and was almost completely abolished at 2 h (Fig. 5).
Figure 4.


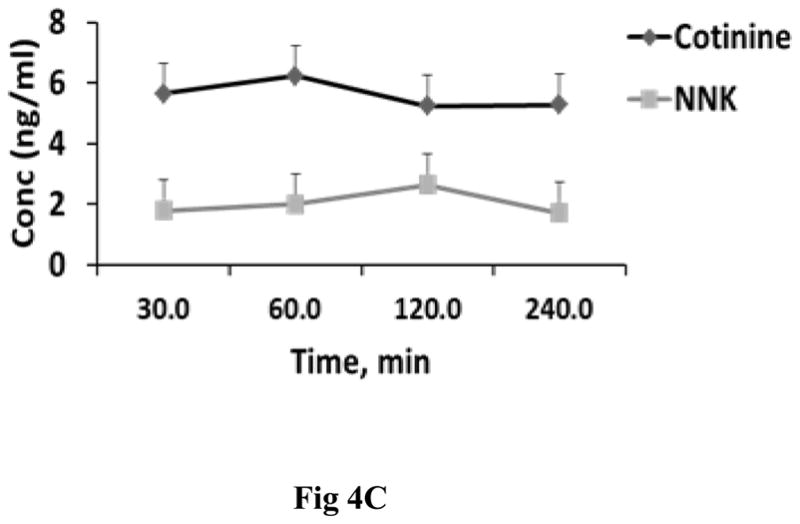
Metabolism of nicotine in SVGA astrocytes. The cells were incubated with 1 μM nicotine for 0.5, 1, 2, and 4h and cotinine and NNK levels were measured using the LC-MS/MS method. A. Diagram depicting the metabolism of nicotine and the metabolic products cotinine and NNK. B. Representative MS2 profiles of nicotine, cotinine, and NNK with parent molecular ion transition and its fragmentation pattern in MS2 of nicotine, cotinine, and NNK. C. Kinetic profiles of cotinine and NNK formation. In the figures, X-axis represents the treatment time (hours) and Y-axis represents concentration of cotinine and NNK. The graphs were plotted as mean ± SD using three replicates for each time point.
Figure 5.

Effect of tryptamine (20 μM), a CYP2A6 selective inhibitor, on the formation of cotinine and NNK in 1 μM nicotine treated SVGA astrocytes. In the figures, percent of cotinine and NNK formation are presented in Y-axis. The time points of nicotine treatment are presented on the X-axis. The graphs were plotted as mean ± SD using three replicates for each time point. * Represents p ≤ 0.05 compared to respective controls.
3.3. Formation of ROS by CYP2A6-mediated nicotine metabolism in SVGA astrocytes
We measured the generation of ROS in nicotine-treated SVGA astrocytes using flow cytometry. Figure 6A shows the mean fluorescence intensity (MFI) of ROS formation in nicotine-treated astrocytes from 15 – 120 min. The results showed a slight decrease in MFI at 15 min, a peak at 30 min, and then a decrease at 90 and 120 min. To ensure that ROS is formed as a result of nicotine metabolism by CYP2A6, we pre-incubated astrocytes with CYP2A6-specific inhibitor tryptamine. The results showed that tryptamine significantly quenched the formation of ROS, suggesting the role of CYP2A6-mediated nicotine metabolism in ROS formation. Since our results showed a decrease in the levels of ROS at later time points (Fig. 6A), we determined the expression level of the antioxidant enzymes superoxide dismutase (SOD) and catalase at 1, 3, 6, and 12 h (Fig. 7). The results showed that nicotine significantly induced SOD, especially at 3 h (~200%). In contrast, nicotine significantly reduced the expression of catalase at 1 and 12 h.
Figure 6.

Effect of nicotine on CYP2A6 mediated oxidative stress in SVGA astrocytes. The ROS production was measured using a flow cytometer from untreated and 1 μM nicotine treated cells from 15, 30, 60, 90, and 120 min. A. Bar graphs representing mean fluorescence intensity (MFI) from control and nicotine-treated cells. MFI is presented in Y-axis and the time points of nicotine treatment are presented in X-axis. The graphs were plotted as mean ± SD from three replicates. B. Effect of 20 μM tryptamine, a CYP2A6 selective inhibitor on the formation of oxidant contents in untreated and 1 μM nicotine treated cells for 30 min. * Represents p value ≤ 0.05 and # represents p value ≤ 0.1.
Figure 7.

Effect of 1 μM nicotine on the mRNA expression of SOD and catalase in SVGA astrocytes. The SVGA astrocytes were treated with 1 μM nicotine for 1, 3, 6, and 12h. The percentage mRNA levels of both the enzymes were calculated using qRT-PCR, with 100% expression normalized to the control. . Expression of both the genes was normalized against glyceraldehyde 3-phosphate dehydrogenase. X-axis represents the treatment time and Y-axis represents % mRNA expression. * Represents p value ≤ 0.05 and # represents p value ≤ 0.1.
4. Discussion
4.1. Abundance of CYP1A1 and CYP2A6 in SVGA astrocytes
The current study demonstrates very high levels of CYP1A1 (43%) and CYP2A6 (56%) in SVGA astrocytes, which account for only 3% and 0.1% of the total CYPs, respectively, in the liver (Rodriguez-Antona et al., 2002). Similarly, our previous studies revealed that CYP2A6 is the second most abundant (30%) CYP enzyme in the U937 macrophage cell line. (Jin et al., 2011a). It should be noted that, in many respects, macrophages are similar to microglia in the CNS. Although CYP2A6 is the most abundant CYP in SVGA astrocytes, its expression level in SVGA astrocytes is approximately 10-fold lower than in U937 macrophages. However, the level of CYP1A1 mRNA in astrocytes was comparable to that of U937 macrophages. This is the first report that demonstrates the presence of CYP2A6 and CYP1A1 in SVGA astrocytes. CYP2A6 is the major enzyme involved in the metabolism of nicotine, whereas CYP1A1 is responsible for the metabolism/activation of other tobacco constituents, such as polycyclic aromatic hydrocarbons (PAH) (Hecht, 1999).
4.2. Induction of CYP2A6 by nicotine in SVGA astrocytes
This is the first report that demonstrates the induction of CYP1A1 and CY2A6 by acute nicotine treatment. To our knowledge, there is no report in the literature that demonstrates the induction of CYP2A6 and CYP1A1 by nicotine in hepatocytes or lungs. Similarly, our recent study did not show an induction of CYP1A1 and CYP2A6 by nicotine in U937 macrophages (Jin et al., 2011b). It is possible that CYP1A1 and CYP2A6 are inducible in astrocytes but not in hepatocytes or macrophages because their levels in astrocytes are much lower than that of hepatocytes (Rodriguez-Antona et al., 2002) and macrophages (Jin et al., 2011a). Thus, CYP2A6 and CYP1A1 in macrophages and liver may already be at maximal expression levels. Alternatively, the inducibility of CYP1A1 and CYP2A6 is a tissue-specific phenomenon. This is quite possible as other CYP’s have been demonstrated to be inducible in a tissue-specific manner. An earlier study showed an induction of rat CYP2B1 in certain regions of the brain upon chronic nicotine treatment (Miksys et al., 2000). Similarly, a recent study showed that while nicotine does not induce hepatic CYP2B1, it induces CYP2B1 in the frontal cortex, brain stem, and olfactory tubercle (Khokhar et al., 2010). Furthermore, chronic nicotine treatment in African green monkeys increased CYP2B6 (homologous to rat CYP2B1) in astrocytes and neurons (frontal cortex, caudate, thalamus) whereas hepatic levels of CYP2B6 were unchanged (Lee et al., 2006). These reports are consistent with another finding that smokers have higher levels of CYP2B6 in the brain (Miksys et al., 2003), which may increase the metabolism of certain drugs such as bupropion and propofol, and lead to a decreased response to these drugs.
We speculate that nicotine induces CYP1A1 and CYP2A6 in astrocytes through nicotine metabolism-mediated oxidative stress, which in turn increases nicotine metabolism and help to clear nicotine from the system. Our speculation is based on a recent report which demonstrated that increased CYP2A6 expression is associated with increased CYP2E1-mediated alcohol metabolism and oxidative stress in the liver (Lu et al., 2011). Additional observations suggest that oxidative stress mediates CYP2A6 induction by alcohol in U937 cell line (Jin et al., unpublished observations). Although the mechanism by which nicotine induces other CYP enzymes, such as CYP2B1 and CYP2B6 is not clear, it has been shown that nicotine induces CYP2B1 and CYP2B6 through transcriptional regulation, and in this way enhances its own metabolism (Khokhar et al., 2010). In contrast to CYP2B6 induction, another study suggests that a non-transcriptional mechanism, perhaps a post-translational modification, is responsible for the induction of CYP2D6 and CYP2E1 by chronic nicotine treatment (Joshi and Tyndale, 2006).
4.3. Development of LC-MS/MS method for concurrent measurements of nicotine, cotinine, and NNK in SVGA astrocyte
We have demonstrated a simple, rapid, highly sensitive and reproducible LC-MS/MS analytical technique for concurrent determination of nicotine, cotinine, and NNK in SVGA astrocytes. Nicotine, cotinine, and NNK achieved requisite recovery by a simple liquid-liquid extraction procedure. This extraction method is efficient, simple, fast, sensitive, and cost-effective and has been developed for the first time for astrocytes. We and other investigators have previously described LC-MS/MS methods in other cell types that because of low sensitivity were inadequate to determine the intracellular concentrations of nicotine, cotinine, and NNK in SVGA astrocytes (Byrd et al., 2005; Byrd and Ogden, 2003; Jin et al., 2011b; Marclay and Saugy, 2010; Miller et al., 2010). Our previously reported LC-MS/MS method for nicotine, cotinine, and NNK in U937 macrophages (Jin et al., 2011b) was not sufficiently sensitive to estimate these analytes in SVGA astrocytes, because astrocytes express a much lower level of CYP2A6 than macrophages. Nicotine metabolism in astrocytes is much lower than the macrophages, thereby the conversions of nicotine to cotinine and NNK levels are very low in SVGA astrocytes. The current method has been successfully applied for determination of intracellular levels of nicotine, cotinine and NNK in astrocytes. This is a very important step towards the determination of very low levels of cotinine and NNK in brain samples, especially in smokers (ex-vivo study), because these compounds may be associated with increased oxidative stress and astrogliosis leading to neuronal damage.
4.4. Nicotine metabolism by CYP2A6 in SVGA astrocytes
The nicotine metabolic profile obtained from SVGA astrocytes is different from those obtained with U937 macrophages, in which cotinine and NNK formation was relatively high and achieved a peak at 2–4h (Jin et al., 2011b). In addition, nicotine was metabolized rapidly (within 30 min) in macrophages (Jin et al., 2011b), whereas the nicotine concentration was decreased by only 25% in 4h in astrocytes (data not shown). These results are consistent with the fact that astrocytes express much lower level of CYP2A6 than do macrophages.
Several CYP enzymes such as CYP2A6, CYP2B6, CYP2C8, CYP2C9, CYP2D6, CYP2E1, CYP2F1 and CYP4B1 (Nakayama et al., 1993) are known to metabolize nicotine to cotinine. However, CYP2A6 plays a major role in metabolizing nicotine to cotinine (~80%) and NNK, as well as to some extent in activating NNK into procarcinogens (Messina et al., 1997; Nakajima et al., 1996). CYP2A13 is another isoform of the CYP2A family which is known to activate NNK into procarcinogens, and is expressed at very high levels in nasal mucosa, lungs, and trachea (Zhang et al., 2007). However CYP2A13 was not detected in astrocytes and other nicotine-metabolizing CYPs were present at very low levels (data not shown). CYP2A5, a homologue of human CYP2A6, is the major enzyme involved in nicotine metabolism in mouse (Zhou et al., 2010). Similarly, CYP2B1 and CYP2B6 are present at high levels in brain and they are further induced by nicotine (Khokhar et al., 2010; Lee et al., 2006), which also correlates with a higher CYP2B6 level in the brains of smokers (Miksys et al., 2003). However, there has been no characterization of the role of CYP enzymes in nicotine metabolism in the brain (astrocytes or neurons). Using SVGA astrocytes as a model cell line, our study provides the first evidence of nicotine metabolism by CYP2A6 in the brain.
4.5. Nicotine metabolism-mediated oxidative stress in SVGA astrocytes
The increase in nicotine metabolism-mediated ROS formation in SVGA astrocytes is relatively lower than in U937 macrophages (Jin et al., 2011b), which is consistent with the relatively low level of CYP2A6 in astrocytes compared to macrophages. Our results suggest that acute nicotine metabolism-mediated oxidative stress is ameliorated by the increase of the antioxidant enzyme SOD. However, the chronic exposure of nicotine in smokers, especially in astrocytes, would produce high levels of ROS, which can activate astrocytes. Astrocytes are the major non-neuronal cell type which are situated in close association with neurons, and provide the neurons with structural, metabolic and trophic support (Reddy et al., 2011). Activation of astrocytes as a result of increased oxidative stress has been shown to disrupt the support to neurons (Steele and Robinson, 2012). Our study would help better understand the role of astrocytes in neurodegenerative diseases. Increased oxidative stress is known to occur in various chronic neurodegenerative diseases such as Alzheimer’s disease, Parkinson’s disease, Huntington’s disease, and amyotrophic lateral sclerosis and is associated with neuronal cell death (Johnson et al., 2008).
The nuclear factor (erythroid-derived 2)-like 2 (Nrf2) pathway has been shown to be activated in astrocytes, which protects the neurons from oxidative insult (Johnson et al., 2008; Vargas and Johnson, 2009). Nrf2 is a transcription factor which is translocated into nucleus when cells are subjected to oxidative stress. In the nucleus, Nrf2 binds to an antioxidant response element and leads to transcriptional activation of antioxidant genes (e.g. SOD and phase II detoxifying enzymes). Recently, HIV-1 gp120 has been shown to induce Nrf2 in astrocytes, which is associated with stimulation of antioxidant genes such as hemoxygenase (HO-1) and NADPH dehydrogenase quinine 1 (Nqo1) (Reddy et al., 2011). A recent report also demonstrates transcriptional regulation of CYP2A6 by the Nrf2 pathway in human hepatocytes (Yokota et al., 2011). Our unpublished observations suggest a similar role for Nrf2 in the induction of CYP2A6 by alcohol-mediated oxidative stress in monocytes. Our study opens the way to test the hypothesis that CYP2A6-mediated nicotine metabolism facilitates the oxidative stress induced by HIV-1 in astrocytes. Our hypothesis is consistent with the findings that chronic exposure of nicotine/smoke increases the expression of other CYP enzymes, including CYP2A6 in the brain (Lee et al., 2006; Miksys et al., 2003). Nicotine-induced brain CYP enzymes have relevance to several neurodegenerative diseases, including Parkinson’s disease (Miksys and Tyndale, 2006).
4.6. Clinical relevance
In the U.S. cigarette smoking is about three times more prevalent in HIV-1 infected people than in the uninfected population (Burkhalter et al., 2005). Nicotine, the major constituent of tobacco, is known to enhance HIV-1 replication in alveolar macrophages (Abbud et al., 1995) and microglia (Rock et al., 2008). Although the mechanism is not known, studies have suggested that oxidative stress plays a role in increased viral replication in smokers (Boelaert et al., 1996; Savarino et al., 1999). A study has also correlated smoking with increased infection, decreased immune response, poor response to antiretroviral drugs, and enhanced risk of virological rebound (Feldman et al., 2006; Sopori et al., 1998). Our recent study with macrophages (Jin et al., 2011a), and the current study with astrocytes, suggest an important role for CYP2A6 in nicotine/smoking mediated-oxidative stress and HIV-1 replication in monocytes and astrocytes. Since HIV-1 protein gp120 is known to stimulate oxidative stress pathways (Reddy et al., 2011), we speculate that nicotine/smoking in the presence of HIV-1 infection may further enhance oxidative stress in a synergistic manner leading to increased HIV-1 replication. Inhibition of the CYP2A6 mediated oxidative stress pathway has the potential to decrease viral replication and increase the response to ART that would reduce the progression of AIDS in smokers.
4.7. Conclusion
In conclusion, this is the first report on the expression levels of CYP1A1 and CYP2A6 in SVGA astrocytes, and their further induction by nicotine. We also developed a highly sensitive LC-MS/MS method for simultaneous determination of nicotine, cotinine, and NNK in SVGA astrocytes, which allowed us to determine the role of CYP2A6 in nicotine metabolism in astrocytes. Furthermore, the role of CYP2A6 in nicotine metabolism-mediated oxidative stress was analyzed in these cells. These findings have clinical relevance because smoking among HIV-infected individuals is highly prevalent and these individuals show increased HIV-1 replication.
Acknowledgments
Role of funding source
The research was supported by NIH/NIDA (DA031616-01) (Kumar S., PI). NIDA played no role in the: (1) study design; (2) collection, analysis, and interpretation of data; (3) writing of the report; and (4) decision to submit or where to submit the paper for publication. No honorarium, grant, or other form of payment was given to any author or any other individual to produce the manuscript.
Footnotes
Conflict of interest
The authors report no conflicts of interest regarding this manuscript. The authors alone are responsible for the content and writing of the paper.
Contributors
All authors have materially contributed to this research, and have approved the final manuscript. SK conceptualized and designed the study, obtained funding, and participated in data collection, analysis, and manuscript preparation. AK participated in study design and in manuscript preparation. AKM and PSS provided intellectual support and participated in manuscript writing. AA and RE participated in data collection and manuscript writing. MJ participated in data collection. All authors discussed the results and implications and commented on the manuscript at all stages.
Publisher's Disclaimer: This is a PDF file of an unedited manuscript that has been accepted for publication. As a service to our customers we are providing this early version of the manuscript. The manuscript will undergo copyediting, typesetting, and review of the resulting proof before it is published in its final citable form. Please note that during the production process errors may be discovered which could affect the content, and all legal disclaimers that apply to the journal pertain.
References
- Abbud RA, Finegan CK, Guay LA, Rich EA. Enhanced production of human immunodeficiency virus type 1 by in vitro-infected alveolar macrophages from otherwise healthy cigarette smokers. J Infect Dis. 1995;172:859–863. doi: 10.1093/infdis/172.3.859. [DOI] [PubMed] [Google Scholar]
- Aquaro S, Ronga L, Pollicita M, Antinori A, Ranazzi A, Perno CF. Human immunodeficiency virus infection and acquired immunodeficiency syndrome dementia complex: role of cells of monocyte-macrophage lineage. J Neurovirol. 2005;11(Suppl 3):58–66. doi: 10.1080/13550280500513416. [DOI] [PubMed] [Google Scholar]
- Benowitz NL. Pharmacology of nicotine: addiction, smoking-induced disease, and therapeutics. Annu Rev Pharmacol Toxicol. 2009;49:57–71. doi: 10.1146/annurev.pharmtox.48.113006.094742. [DOI] [PMC free article] [PubMed] [Google Scholar]
- Bhagwat SV, Vijayasarathy C, Raza H, Mullick J, Avadhani NG. Preferential effects of nicotine and 4-(N-methyl-N-nitrosamine)-1-(3-pyridyl)-1-butanone on mitochondrial glutathione S-transferase A4–4 induction and increased oxidative stress in the rat brain. Biochem Pharmacol. 1998;56:831–839. doi: 10.1016/s0006-2952(98)00228-7. [DOI] [PubMed] [Google Scholar]
- Boelaert JR, Piette J, Weinberg GA, Sappey C, Weinberg ED. Iron and oxidative stress as a mechanism for the enhanced production of human immunodeficiency virus by alveolar macrophages from otherwise healthy cigarette smokers. J Infect Dis. 1996;173:1045–1047. doi: 10.1093/infdis/173.4.1045a. [DOI] [PubMed] [Google Scholar]
- Burkhalter JE, Springer CM, Chhabra R, Ostroff JS, Rapkin BD. Tobacco use and readiness to quit smoking in low-income HIV-infected persons. Nicotine Tob Res. 2005;7:511–522. doi: 10.1080/14622200500186064. [DOI] [PubMed] [Google Scholar]
- Byrd GD, Davis RA, Ogden MW. A rapid LC-MS-MS method for the determination of nicotine and cotinine in serum and saliva samples from smokers: validation and comparison with a radioimmunoassay method. J Chromatogr Sci. 2005;43:133–140. doi: 10.1093/chromsci/43.3.133. [DOI] [PubMed] [Google Scholar]
- Byrd GD, Ogden MW. Liquid chromatographic/tandem mass spectrometric method for the determination of the tobacco-specific nitrosamine metabolite NNAL in smokers’ urine. J Mass Spectrom. 2003;38:98–107. doi: 10.1002/jms.406. [DOI] [PubMed] [Google Scholar]
- Chuang CH, Hu ML. Synergistic DNA damage and lipid peroxidation in cultured human white blood cells exposed to 4-(methyl-nitrosamino)-1-(3-pyridyl)-1-butanone and ultraviolet A. Environ Mol Mutagen. 2006;47:73–81. doi: 10.1002/em.20168. [DOI] [PubMed] [Google Scholar]
- Demizu Y, Sasaki R, Trachootham D, Pelicano H, Colacino JA, Liu J, Huang P. Alterations of cellular redox state during NNK-induced malignant transformation and resistance to radiation. Antioxid Redox Signal. 2008;10:951–961. doi: 10.1089/ars.2007.1871. [DOI] [PMC free article] [PubMed] [Google Scholar]
- Earla R, Boddu SH, Cholkar K, Hariharan S, Jwala J, Mitra AK. Development and validation of a fast and sensitive bioanalytical method for the quantitative determination of glucocorticoids--quantitative measurement of dexamethasone in rabbit ocular matrices by liquid chromatography tandem mass spectrometry. J Pharm Biomed Anal. 2010;52:525–533. doi: 10.1016/j.jpba.2010.01.015. [DOI] [PMC free article] [PubMed] [Google Scholar]
- Feldman JG, Minkoff H, Schneider MF, Gange SJ, Cohen M, Watts DH, Gandhi M, Mocharnuk RS, Anastos K. Association of cigarette smoking with HIV prognosis among women in the HAART era: a report from the women’s interagency HIV study. Am J Public Health. 2006;96:1060–1065. doi: 10.2105/AJPH.2005.062745. [DOI] [PMC free article] [PubMed] [Google Scholar]
- Ghosh D, Mishra MK, Das S, Kaushik DK, Basu A. Tobacco carcinogen induces microglial activation and subsequent neuronal damage. J Neurochem. 2009;110:1070–1081. doi: 10.1111/j.1471-4159.2009.06203.x. [DOI] [PubMed] [Google Scholar]
- Hecht SS. Tobacco smoke carcinogens and lung cancer. J Natl Cancer Inst. 1999;91:1194–1210. doi: 10.1093/jnci/91.14.1194. [DOI] [PubMed] [Google Scholar]
- Hecht SS, Hochalter JB, Villalta PW, Murphy SE. 2’-Hydroxylation of nicotine by cytochrome P450 2A6 and human liver microsomes: formation of a lung carcinogen precursor. Proc Natl Acad Sci USA. 2000;97:12493–12497. doi: 10.1073/pnas.220207697. [DOI] [PMC free article] [PubMed] [Google Scholar]
- Jin M, Arya P, Patel K, Singh B, Silverstein PS, Bhat HK, Kumar A, Kumar S. Effect of alcohol on drug efflux protein and drug metabolic enzymes in U937 macrophages. Alcohol Clin Exp Res. 2011a;35:132–139. doi: 10.1111/j.1530-0277.2010.01330.x. [DOI] [PMC free article] [PubMed] [Google Scholar]
- Jin M, Earla R, Shah A, Earla RL, Gupte R, Mitra AK, Kumar A, Kumar S. A LC-MS/MS method for concurrent determination of nicotine metabolites and role of CYP2A6 in nicotine metabolism in U937 macrophages: implications in oxidative stress in HIV + smokers. J Neuroimmune Pharmacol. 2011b;7:289–299. doi: 10.1007/s11481-011-9283-6. [DOI] [PMC free article] [PubMed] [Google Scholar]
- Johnson JA, Johnson DA, Kraft AD, Calkins MJ, Jakel RJ, Vargas MR, Chen PC. The Nrf2-ARE pathway: an indicator and modulator of oxidative stress in neurodegeneration. Ann NY Acad Sci. 2008;1147:61–69. doi: 10.1196/annals.1427.036. [DOI] [PMC free article] [PubMed] [Google Scholar]
- Joshi M, Tyndale RF. Induction and recovery time course of rat brain CYP2E1 after nicotine treatment. Drug Metab Dispos. 2006;34:647–652. doi: 10.1124/dmd.105.008029. [DOI] [PubMed] [Google Scholar]
- Kadlubar S, Anderson JP, Sweeney C, Gross MD, Lang NP, Kadlubar FF, Anderson KE. Phenotypic CYP2A6 variation and the risk of pancreatic cancer. JOP. 2009;10:263–270. [PMC free article] [PubMed] [Google Scholar]
- Khokhar JY, Miksys SL, Tyndale RF. Rat brain CYP2B induction by nicotine is persistent and does not involve nicotinic acetylcholine receptors. Brain Res. 2010;1348:1–9. doi: 10.1016/j.brainres.2010.06.035. [DOI] [PubMed] [Google Scholar]
- Lee AM, Miksys S, Palmour R, Tyndale RF. CYP2B6 is expressed in African Green monkey brain and is induced by chronic nicotine treatment. Neuropharmacology. 2006;50:441–450. doi: 10.1016/j.neuropharm.2005.10.003. [DOI] [PubMed] [Google Scholar]
- Lu Y, Zhuge J, Wu D, Cederbaum AI. Ethanol induction of CYP2A5: permissive role for CYP2E1. Drug Metab Dispos. 2011;39:330–336. doi: 10.1124/dmd.110.035691. [DOI] [PMC free article] [PubMed] [Google Scholar]
- Marclay F, Saugy M. Determination of nicotine and nicotine metabolites in urine by hydrophilic interaction chromatography-tandem mass spectrometry: potential use of smokeless tobacco products by ice hockey players. J Chromatogr A. 2010;1217:7528–7538. doi: 10.1016/j.chroma.2010.10.005. [DOI] [PubMed] [Google Scholar]
- Messina ES, Tyndale RF, Sellers EM. A major role for CYP2A6 in nicotine C-oxidation by human liver microsomes. J Pharmacol Exp Ther. 1997;282:1608–1614. [PubMed] [Google Scholar]
- Miksys S, Hoffmann E, Tyndale RF. Regional and cellular induction of nicotine-metabolizing CYP2B1 in rat brain by chronic nicotine treatment. Biochem Pharmacol. 2000;59:1501–1511. doi: 10.1016/s0006-2952(00)00281-1. [DOI] [PubMed] [Google Scholar]
- Miksys S, Lerman C, Shields PG, Mash DC, Tyndale RF. Smoking, alcoholism and genetic polymorphisms alter CYP2B6 levels in human brain. Neuropharmacology. 2003;45:122–132. doi: 10.1016/s0028-3908(03)00136-9. [DOI] [PubMed] [Google Scholar]
- Miksys S, Tyndale RF. Nicotine induces brain CYP enzymes: relevance to Parkinson’s disease. J Neural Transm. 2006;(Suppl):177–180. doi: 10.1007/978-3-211-45295-0_28. [DOI] [PubMed] [Google Scholar]
- Miller EI, Norris HR, Rollins DE, Tiffany ST, Wilkins DG. A novel validated procedure for the determination of nicotine, eight nicotine metabolites and two minor tobacco alkaloids in human plasma or urine by solid-phase extraction coupled with liquid chromatography-electrospray ionization-tandem mass spectrometry. J Chromatogr B Analyt Technol Biomed Life Sci. 2010;878:725–737. doi: 10.1016/j.jchromb.2009.12.018. [DOI] [PMC free article] [PubMed] [Google Scholar]
- Nakajima M, Yamamoto T, Nunoya K, Yokoi T, Nagashima K, Inoue K, Funae Y, Shimada N, Kamataki T, Kuroiwa Y. Role of human cytochrome P4502A6 in C-oxidation of nicotine. Drug Metab Dispos. 1996;24:1212–1217. [PubMed] [Google Scholar]
- Nakayama H, Okuda H, Nakashima T, Imaoka S, Funae Y. Nicotine metabolism by rat hepatic cytochrome P450s. Biochem Pharmacol. 1993;45:2554–2556. doi: 10.1016/0006-2952(93)90238-r. [DOI] [PubMed] [Google Scholar]
- Reddy PV, Gandhi N, Samikkannu T, Saiyed Z, Agudelo M, Yndart A, Khatavkar P, Nair MP. HIV-1 gp120 induces antioxidant response element-mediated expression in primary astrocytes: role in HIV associated neurocognitive disorder. Neurochem Int. 2011 doi: 10.1016/j.neuint.2011.06.011. epub ahead of print. [DOI] [PMC free article] [PubMed] [Google Scholar]
- Rock RB, Gekker G, Aravalli RN, Hu S, Sheng WS, Peterson PK. Potentiation of HIV-1 expression in microglial cells by nicotine: involvement of transforming growth factor-beta 1. J Neuroimmune Pharmacol. 2008;3:143–149. doi: 10.1007/s11481-007-9098-7. [DOI] [PMC free article] [PubMed] [Google Scholar]
- Rodriguez-Antona C, Donato MT, Boobis A, Edwards RJ, Watts PS, Castell JV, Gomez-Lechon MJ. Cytochrome P450 expression in human hepatocytes and hepatoma cell lines: molecular mechanisms that determine lower expression in cultured cells. Xenobiotica. 2002;32:505–520. doi: 10.1080/00498250210128675. [DOI] [PubMed] [Google Scholar]
- Savarino A, Pescarmona GP, Boelaert JR. Iron metabolism and HIV infection: reciprocal interactions with potentially harmful consequences? Cell Biochem Funct. 1999;17:279–287. doi: 10.1002/(SICI)1099-0844(199912)17:4<279::AID-CBF833>3.0.CO;2-J. [DOI] [PubMed] [Google Scholar]
- Smith TJ, Stoner GD, Yang CS. Activation of 4-(methylnitrosamino)-1-(3-pyridyl)-1-butanone (NNK) in human lung microsomes by cytochromes P450, lipoxygenase, and hydroperoxides. Cancer Res. 1995;55:5566–5573. [PubMed] [Google Scholar]
- Sopori ML, Kozak W, Savage SM, Geng Y, Kluger MJ. Nicotine-induced modulation of T Cell function. Implications for inflammation and infection. Adv Exp Med Biol. 1998;437:279–289. doi: 10.1007/978-1-4615-5347-2_31. [DOI] [PubMed] [Google Scholar]
- Steele ML, Robinson SR. Reactive astrocytes give neurons less support: implications for Alzheimer’s disease. Neurobiol Aging. 2012;33:423 e421–423 e413. doi: 10.1016/j.neurobiolaging.2010.09.018. [DOI] [PubMed] [Google Scholar]
- Vargas MR, Johnson JA. The Nrf2-ARE cytoprotective pathway in astrocytes. Expert Rev Mol Med. 2009;11:e17. doi: 10.1017/S1462399409001094. [DOI] [PMC free article] [PubMed] [Google Scholar]
- Wong HL, Zhang X, Zhang QY, Gu J, Ding X, Hecht SS, Murphy SE. Metabolic activation of the tobacco carcinogen 4-(methylnitrosamino)-(3-pyridyl)-1-butanone by cytochrome P450 2A13 in human fetal nasal microsomes. Chem Res Toxicol. 2005;18:913–918. doi: 10.1021/tx0500777. [DOI] [PubMed] [Google Scholar]
- Yokota S, Higashi E, Fukami T, Yokoi T, Nakajima M. Human CYP2A6 is regulated by nuclear factor-erythroid 2 related factor 2. Biochem Pharmacol. 2011;81:289–294. doi: 10.1016/j.bcp.2010.09.020. [DOI] [PubMed] [Google Scholar]
- Zhang W, Kilicarslan T, Tyndale RF, Sellers EM. Evaluation of methoxsalen, tranylcypromine, and tryptamine as specific and selective CYP2A6 inhibitors in vitro. Drug Metab Dispos. 2001;29:897–902. [PubMed] [Google Scholar]
- Zhang X, D’Agostino J, Wu H, Zhang QY, von Weymarn L, Murphy SE, Ding X. CYP2A13: variable expression and role in human lung microsomal metabolic activation of the tobacco-specific carcinogen 4-(methylnitrosamino)-1-(3-pyridyl)-1-butanone. J Pharmacol Exp Ther. 2007;323:570–578. doi: 10.1124/jpet.107.127068. [DOI] [PubMed] [Google Scholar]
- Zhou X, Zhuo X, Xie F, Kluetzman K, Shu YZ, Humphreys WG, Ding X. Role of CYP2A5 in the clearance of nicotine and cotinine: insights from studies on a Cyp2a5-null mouse model. J Pharmacol Exp Ther. 2010;332:578–587. doi: 10.1124/jpet.109.162610. [DOI] [PMC free article] [PubMed] [Google Scholar]