

Abstract
Objective:
To determine the association between the focal atrophy measures on antemortem MRI and postmortem neuropathologic classification of dementia with Lewy bodies (DLB) using the Third Report of the DLB Consortium criteria.
Methods:
We retrospectively identified 56 subjects who underwent antemortem MRI and had Lewy body (LB) pathology at autopsy. Subjects were pathologically classified as high (n = 25), intermediate (n = 22), and low likelihood DLB (n = 9) according to the Third Report of the DLB Consortium criteria. We included 2 additional pathologic comparison groups without LBs: one with low likelihood Alzheimer disease (AD) (control; n = 27) and one with high likelihood AD (n = 33). The associations between MRI-based volumetric measurements and the pathologic classification of DLB were tested with analysis of covariance by adjusting for age, sex, and MRI-to-death interval.
Results:
Antemortem hippocampal and amygdalar volumes increased from low to intermediate to high likelihood DLB (p < 0.001, trend test). Smaller hippocampal and amygdalar volumes were associated with higher Braak neurofibrillary tangle stage (p < 0.001). Antemortem dorsal mesopontine gray matter (GM) atrophy was found in those with high likelihood DLB compared with normal control subjects (p = 0.004) and those with AD (p = 0.01). Dorsal mesopontine GM volume decreased from low to intermediate to high likelihood DLB (p = 0.01, trend test).
Conclusion:
Antemortem hippocampal and amygdalar volumes increase and dorsal mesopontine GM volumes decrease in patients with low to high likelihood DLB according to the Third Report of the DLB Consortium criteria. Patients with high likelihood DLB typically have normal hippocampal volumes but have atrophy in the dorsal mesopontine GM nuclei.
Dementia with Lewy bodies (DLB) is the second most common cause of neurodegenerative dementia after Alzheimer disease (AD); however, many patients with DLB also have AD pathology.1–5 Imaging markers that predict the contribution of AD to the dementia syndrome in DLB would have an important role in treatment decisions and assessing responsiveness to treatments targeting disease-specific pathologies.
According to the Third Report of the DLB Consortium criteria,6 the pathologic diagnosis of DLB is made by considering both AD and Lewy body (LB) pathologies. For example, patients with limbic LBs are diagnosed as high likelihood DLB if they have low likelihood AD, but diagnosed as low likelihood DLB if they have high likelihood AD. Therefore, in vivo identification of AD and LB pathology is critical for the differential diagnosis of DLB.
Hippocampal atrophy on MRI is associated with the neurofibrillary tangle (NFT) pathology in AD.7–12 Typically, DLB is characterized by normal hippocampal volumes on MRI and preserved hippocampal neurons at autopsy.13–15 DLB has also been associated with reduced dorsal mesopontine gray matter (GM)16,17 and amygdalar16,18 volume. However, these findings have been limited to patients with a clinical or pathologic diagnosis of DLB and did not include patients with mixed AD and LB−related pathology. In the community, AD commonly coexists with LB pathology,1 which forms the conceptual framework of the current diagnostic criteria for DLB.6 Our objective was to determine whether MRI measures of focal atrophy are associated with the neuropathologic classification of DLB.
METHODS
Subjects.
Patients were recruited from the Mayo Clinic Alzheimer Disease Research Center, a dementia clinic−based cohort, and the Alzheimer Disease Patient Registry (ADPR), a community clinic−based cohort. We retrospectively identified consecutive patients who had an antemortem MRI and autopsy during years 1994−2009 with neuropathologic diagnoses ranging from low to high likelihood DLB according to the Third Report of the DLB Consortium criteria (n = 56).6 We also included subjects without LB pathology, who met the criteria for low likelihood AD (n = 27) and did not have dementia at the time of their MRI. We refer to these individuals as control subjects. Another comparison group included patients with dementia with no LBs but high likelihood AD (n = 33) based on National Institute on Aging−Reagan criteria.19 Individuals participating in the Alzheimer Disease Research Center/Alzheimer Disease Patient Registry studies undergo annual clinical and neuropsychological examinations, brain MRI, and routine laboratory tests. The Global Deterioration Scale is routinely used as a noncognitive rating for dementia severity.20
Clinical criteria were not used for inclusion and exclusion of subjects in this study. Inclusion and exclusion were solely based on the neuropathologic findings. For inclusion in this study, subjects had autopsies that showed either AD or LB pathology or neither and underwent antemortem MRI examinations. Subjects were excluded if they had other primary neurologic disease at the time of the MRI examination. Specifically, individuals with cortical infarctions, neoplasm, subdural hematoma, hydrocephalus, or other neurologic illnesses that typically interfere with cognitive function were excluded. The exception was the inclusion of subjects with leukoaraiosis and lacunar infarctions.
Diagnosis at the time of the MRI was made according to the established clinical criteria during a consensus conference involving neurologists, neuropsychologists, and nurses who evaluated the patients. Diagnosis of probable DLB was made according to the Third Report of the DLB Consortium criteria for DLB,6 which was recently validated with an autopsy sample.21 Diagnosis of probable AD was made according to the National Institute of Neurological and Communicative Disorders and Stroke/Alzheimer's Disease and Related Disorder's Association criteria for AD.22 Diagnosis of mild cognitive impairment (MCI) was made according to the criteria of Petersen.23
Standard protocol approvals, registrations, and patient consents.
This study was approved by the Mayo Clinic Institutional Review Board, and informed consent for participation was obtained from every subject or an appropriate surrogate.
Neuropathologic assessment.
Standardized methods were used for the neuropathologic assessment by 2 expert neuropathologists (D.W.D. and J.E.P.). Sampling was done according to the Consortium to Establish a Registry for Alzheimer's Disease (CERAD) protocol24 and the Third Report of the DLB Consortium.6 NFTs and corresponding Braak stage25 were detected using thioflavin-S microscopy or Bielschowsky silver stain, and classified according to National Institutes of Aging−Reagan criteria, which use the CERAD method for assessing neuritic plaques.19 Regional involvement with LBs classified as brainstem, limbic, and neocortical was determined based on LB counts using a polyclonal antibody to α-synuclein. The neuropathologic diagnosis of DLB was made according to the Third Report of the DLB Consortium criteria without consideration of clinical presentation.6 Specifically, the high and intermediate likelihood DLB category included those with neocortical, limbic, and brainstem LBs with any Braak NFT stage or LBs confined to the limbic and brainstem regions with a Braak NFT stage ≤4. The low likelihood DLB category included those with limbic LB disease and a Braak NFT stage >4. Classification of subjects with DLB into pathology-based diagnostic groups is displayed in table 1.
Table 1.
Pathologic classification of the study sample

Abbreviations: AD = Alzheimer disease; DLB = dementia with Lewy bodies; LB = Lewy body.
MRI acquisition and analysis.
MRI scans were performed at 1.5 T (GE Healthcare). A 3-dimensional high-resolution spoiled gradient recalled acquisition with repetition time/echo time/inversion time = 7/3/900 msec, flip angle 8°, in-plane resolution of 1.0 mm, and slice thickness of 1.2 mm was performed for the automated segmentation of regional volumes. We used the fully automated FreeSurfer 4.5 (http://surfer.nmr.mgh.harvard.edu) algorithm to analyze the hippocampal and amygdalar volumes. The volumes of the amygdalae and the hippocampi were computed by averaging the right and left volumes. Dorsal mesopontine GM volume was determined by an automated region of interest (ROI) analysis. Dorsal mesopontine GM ROI showing the maximum GM loss in patients with probable DLB was determined on a custom template in a previous study.17 Each subject's high resolution T1-weighted MRI scan in the current study was spatially normalized to the custom template and segmented into GM, white matter, and CSF using the unified segmentation model of SPM5, giving a discrete cosine transformation. Then for each subject, inverse of this transformation was applied to warp the dorsal mesopontine GM ROIs to the subject's native anatomic space to determine the GM volume in the segmented T1-weighted MRIs. All ROIs were visually inspected for the quality control of volumetric analysis of the hippocampus, amygdala, and dorsal mesopontine GM.
Statistical analysis.
We analyzed regional volumes after scaling them by the subject's total intracranial volume. To evaluate groupwise differences, we used analysis of covariance (ANCOVA) with pathologic diagnosis treated as the main effect and age, sex, and the natural log of years from MRI to death treated as covariates. We performed a trend test among DLB groups only by coding the groups as 1 for low likelihood DLB, 2 for intermediate likelihood DLB, and 3 for high likelihood DLB. This approach is essentially equivalent to testing an unbalanced analysis of variance−based contrast with the contrast coefficients of −1, 0, and +1 weighted by sample size.26 Because of right skewness, we analyzed the square root of dorsal mesopontine GM volumes in our models. We evaluated the effect of Braak NFT stage on total intracranial volume−scaled ROI volume among those with DLB only using linear regression and the same adjustment variables as in the ANCOVA models. To summarize the association with Braak NFT stage, we report Pearson partial correlations, denote by rp, taking into account the effect of age, sex, and the natural log of years from MRI to death. We assessed how well regional volumes could discriminate between pathologically defined AD vs high likelihood DLB by reporting the area under the receiver operating characteristic curve (AUROC) from logistic regression models among these 2 groups of subjects. As in our ANCOVA models, the logistic models were adjusted for age, sex, and the natural log of years from MRI to death. We did not adjust for multiple comparisons.27 Graphical summaries of the data revealed some subjects to have outlying volumes. As part of the model-fitting process we examined the regression model diagnostics and found that the regression assumptions were well-satisfied and that these outlying points were not overly influential. All analyses were performed with R statistical software version 2.13.2 (http://www.R-project.org).
RESULTS
Demographic and clinical characteristics of the study sample are listed in table 2. Age at the time of the MRI scan (p = 0.06), sex (p = 0.02), and time from MRI to death (p = 0.01) differed among the diagnostic groups. Therefore, all analyses were adjusted for age, sex, and MRI-to-death interval. In those with pathologically determined intermediate or high likelihood DLB, 28 of 47 (60%) had a clinical diagnosis of probable DLB, 15 of 47 (32%) had a clinical diagnosis of probable AD, and 4 of 47 (8%) had a clinical diagnosis of MCI. One patient with intermediate likelihood DLB and one patient with high likelihood AD were excluded from the amygdalar and hippocampal volume analysis because of failure of the automated FreeSurfer algorithm to correctly identify the boundaries of these structures.
Table 2.
Demographic characteristics of the study sample at the time of MRI
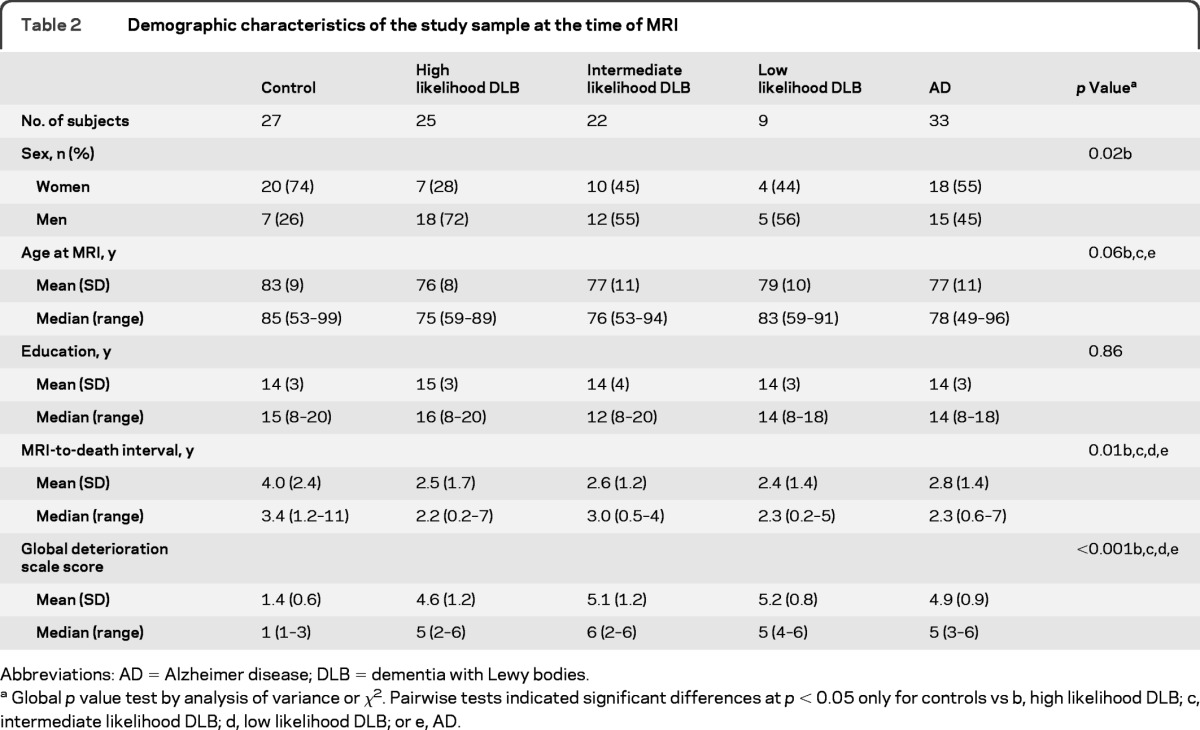
Abbreviations: AD = Alzheimer disease; DLB = dementia with Lewy bodies.
Global p value test by analysis of variance or χ2. Pairwise tests indicated significant differences at p < 0.05 only for controls vs b, high likelihood DLB; c, intermediate likelihood DLB; d, low likelihood DLB; or e, AD.
Hippocampal volumes were different among the diagnostic groups on ANCOVA (p < 0.001) (figure 1). Patients with high likelihood DLB had normal hippocampal volumes compared with those of control subjects (p = 0.42) and had larger hippocampal volumes than patients with AD (p < 0.001). In patients with intermediate or low likelihood DLB, hippocampal volumes were lower than those of the control subjects and high likelihood DLB group (p < 0.001). Intermediate and low likelihood DLB groups and the AD group had similar hippocampal volumes (p > 0.48). Hippocampal volumes increased from low to intermediate to high likelihood DLB (p < 0.001; trend test). Smaller hippocampal volumes were associated with a higher Braak NFT stage (rp = −0.63; p < 0.001) in patients with LB-related pathology.
Figure 1. Box and whiskers plots of hippocampal volumes as a percentage of total intracranial volume by pathologic classification.

Boxes indicate the lower quartile, median, and upper quartile of the distributions with whiskers extending to the furthest data point within 1.5 times the interquartile range of the box. Points beyond the whiskers are individually identified. Pairwise p values shown are based on an analysis of covariance model among all subjects, whereas the p value for trend is based on subjects with dementia with Lewy bodies (DLB) only.
Volumes of the amygdalae also differed among the diagnostic groups on ANCOVA (p < 0.001) (figure 2). Unlike for the hippocampal volumes, the high likelihood DLB group showed a trend for smaller amygdalar volume than control subjects (p = 0.07), and no difference was observed among the amygdalar volumes of low and high likelihood DLB groups (p = 0.17). Amygdalar volumes were larger in the high likelihood DLB group compared to the AD (p = 0.002) and intermediate likelihood DLB (p < 0.001) groups. The amygdalar volumes in intermediate (p < 0.001) and low (p = 0.002) likelihood DLB groups were smaller than those for normal control subjects, but similar to those for the AD group (p > 0.09). Also similar to the hippocampal findings, there was a trend of increased amygdalar volumes from low to intermediate to high likelihood DLB (p = 0.02; trend test), and there was a significant relationship between amygdalar volumes and Braak NFT stage (rp = −0.49; p < 0.001).
Figure 2. Box and whiskers plots of amygdalar volumes as a percentage of total intracranial volume by pathologic classification.

Boxes indicate the lower quartile, median, and upper quartile of the distributions with whiskers extending to the furthest data point within 1.5 times the interquartile range of the box. Points beyond the whiskers are individually identified. Pairwise p values shown are based on an analysis of covariance model among all subjects, whereas the p value for trend is based on subjects with dementia with Lewy bodies (DLB) only.
Patients with high likelihood DLB had significantly smaller dorsal mesopontine GM volumes compared with those of normal control subjects (p = 0.004) and patients with AD (p = 0.01) (figure 3). There was no difference in dorsal mesopontine GM volume when the patients with intermediate and low likelihood DLB were compared with normal control subjects or patients with AD (p ≥ 0.40). Patients with intermediate and low likelihood DLB had similar dorsal mesopontine GM volumes (p = 0.64), which were larger than the dorsal mesopontine GM volumes of patients with high likelihood DLB (p = 0.03). Dorsal mesopontine GM volume increased from low to intermediate to high likelihood DLB (p = 0.01; trend test). Smaller dorsal mesopontine GM volumes were associated with a lower Braak NFT stage (rp = 0.28; p = 0.04) in patients with LB-related pathology.
Figure 3. Box and whiskers plots of dorsal mesopontine gray matter volumes as a percentage of total intracranial volume by pathologic classification.

Boxes indicate the lower quartile, median, and upper quartile of the distributions with whiskers extending to the furthest data point within 1.5 times the interquartile range of the box. Points beyond the whiskers are individually identified. Pairwise p values shown are based on an analysis of covariance model among all subjects, whereas the p value for trend is based on subjects with dementia with Lewy bodies (DLB) only.
The AUROC for differentiating high likelihood AD and high likelihood DLB with hippocampal volumes was 0.87, with amygdalar volumes was 0.76, and with dorsal mesopontine volumes was 0.74. When both hippocampal and dorsal mesopontine GM volumes were included in the model for differentiating high likelihood AD and high likelihood DLB, the AUROC improved to 0.92. The AUROC was at 0.87 when both hippocampal and amygdalar volumes were included and was 0.85 when both amygdalar and dorsal mesopontine GM volumes were included in the model.
Hippocampal (p = 0.54), amygdalar (p = 0.13), and dorsal mesopontine GM (p = 0.17) volumes were not different among the limbic and neocortical LB pathology groups.
DISCUSSION
In the current study, pathologic classification of DLB was made according to the likelihood classification proposed by the Third Report of the DLB Consortium criteria.6 Using this classification scheme, antemortem MRI hippocampal volumes in patients with high likelihood DLB were indistinguishable from those of control subjects (i.e., individuals with low likelihood AD and no LB-related pathology), whereas low and intermediate likelihood DLB groups showed significantly smaller hippocampal volumes during life. Moreover, within the DLB pathologic groups, there was a significant stepwise relationship with greater hippocampal volume from low to intermediate to high likelihood DLB.
These findings are in agreement with the reports on preservation of hippocampal volumes in patients with clinically diagnosed and pathologically confirmed DLB.15,17,28 The current data also show a relationship between hippocampal volume and Braak NFT stage in patients with DLB, suggesting that hippocampal volume is probably related to the existing NFT pathology and not to the LB pathology. These data provide further evidence that hippocampal atrophy on MRI is a sensitive marker for AD-related pathology, specifically for NFT-associated neurodegeneration.7–12,29 An exception to this association is hippocampal-sparing atypical AD.30,31 None of the patients in the current DLB cohort had the pathologic features of atypical hippocampal-sparing AD. We note that hippocampal atrophy is also a feature of hippocampal sclerosis and frontotemporal lobar degeneration, which seldom accompany LB-related pathology in older adults.9,32
There was a trend for smaller amygdalar volumes in patients with high likelihood DLB than in normal control subjects, whereas amygdalar volumes in low and intermediate likelihood DLB groups more closely resembled those of the AD group. Higher Braak NFT stage was associated with smaller amygdalar volume, but this association with the Braak NFT stage was relatively weaker than the association between Braak NFT stage and hippocampal volume in patients with LB pathology. Although amygdala is a medial temporal limbic structure that is involved with the NFT pathology of AD early in the disease course, the finding of a weaker association with NFT pathology in the amygdala compared with the hippocampus may occur because the amygdala is also highly vulnerable to LB-related pathology.33 An increase in amygdalar diffusivity has been observed on diffusion tensor imaging in DLB,34 and volume of the amygdala on MRI was associated with LB pathology.16,18 In agreement with these previous reports, we found a trend of smaller amygdalar volumes in patients with a high likelihood of DLB compared with the control subjects; however, this finding did not reach statistical significance. Taken together with the findings of previous studies, both AD and DLB pathologies appear to synergistically influence amygdalar volume in patients with DLB.
Dorsal mesopontine GM atrophy distinguished patients with high likelihood DLB from to control subjects and those with AD. We previously showed that dorsal mesopontine GM atrophy distinguished patients with clinically diagnosed DLB and AD.17 In the current study, we confirm this finding in patients with high likelihood DLB. Furthermore, dorsal mesopontine GM volume decreased from low to high likelihood DLB and was positively correlated with Braak NFT stage (i.e., greater atrophy with smaller Braak NFT stage). This finding suggests that the dorsal mesopontine GM atrophy is probably not related to the underlying AD pathology.
Early LB-related pathology involves the midbrain, pontine, and basal forebrain nuclei of primarily the cholinergic and dopaminergic systems.33 Besides the dopaminergic neurons of substantia nigra, the cholinergic neurons in the dorsal mesopontine nuclei, specifically the pedunculopontine tegmental and lateral dorsal tegmental nuclei, are involved with the LB-related pathology with significant loss of cholinergic neurons.33,35 Degeneration in the dorsal mesopontine region may involve other neurotransmitter systems including the noradrenergic system because of degeneration in the locus coeruleus and the serotonergic system via damage to the dorsal raphe nuclei.36,37 The mesopontine nuclei are also affected in AD,37–39 although there is some evidence that they are more affected in DLB than in AD.39 Our finding of a smaller dorsal mesopontine GM volume in patients with DLB than in those with AD agrees with this observation.
The distribution of LB pathology, whether it was limbic or neocortical, was not related to hippocampal, amygdalar, or dorsal mesopontine GM volumes. Put differently, whether the LB pathology extends into the neocortex or remains confined to brainstem and limbic regions does not affect antemortem MRI volumes of these brain regions. This is possibly because mesopontine nuclei are significantly involved with the LB-related neurodegeneration both in the limbic and neocortical LB stages. Although it is possible that atrophy is less severe in brainstem-only LBs compared with limbic and neocortical LBs, we could not test this difference because our cohort did not include patients with brainstem-only LBs. Further examination of brainstem-only LBs may be helpful to better understand the association between volume loss in the mesopontine nuclei and LB pathology.
A limitation of this study is that our cohort was confined to the spectrum of DLB and AD pathologies and did not include other diagnostic entities such as cerebrovascular disease and other conditions known to affect hippocampal volume, such as hippocampal sclerosis and frontotemporal lobar degeneration.9,32 We excluded other diagnostic entities because our objective was to identify focal atrophic changes on MRI associated with the pathologic classification of DLB. Further investigation is needed to determine the sensitivity and specificity of these magnetic resonance volumetric measurements in predicting the underlying pathology in a wider sampling of conditions. Moreover, larger cohort studies are needed to assess the diagnostic utility of these measurements in individual subjects and clinical settings.
These data demonstrate the focal atrophic changes on antemortem MRI in patients with mixed DLB and AD pathology classified according to the Third Report of the DLB Consortium criteria. In patients with DLB, hippocampal atrophy is a strong predictor of NFT pathology of AD, and dorsal mesopontine GM atrophy is associated with DLB. Amygdalar atrophy may be associated with both AD and DLB and does not appear to improve diagnostic discrimination of high likelihood AD and DLB when considered with hippocampal volumes. Because a majority of patients with DLB in the community have overlapping AD and DLB pathologies, dorsal mesopontine GM and hippocampal atrophy on MRI may be complementary in determining the contribution of DLB and AD pathologies to the dementia syndrome and prediction of pathologic classification in life. Determining the presence and severity of DLB and AD pathologies through noninvasive imaging markers would be critical for making decisions on disease-specific treatments in patients with DLB.
ACKNOWLEDGMENT
The authors thank Colin Weinshenker for his help with data organization.
GLOSSARY
- AD
Alzheimer disease
- AUROC
area under the receiver operating characteristic curve
- CERAD
Consortium to Establish a Registry for Alzheimer's Disease
- DLB
dementia with Lewy bodies
- GM
gray matter
- LB
Lewy bodies
- MCI
mild cognitive impairment
- NFT
neurofibrillary tangle
- ROI
region of interest.
AUTHOR CONTRIBUTIONS
K. Kantarci: drafting/revising the manuscript, study concept or design, analysis or interpretation of data, acquisition of data, study supervision, obtaining funding. T. Ferman: drafting/revising the manuscript, analysis or interpretation of data, acquisition of data, obtaining funding. B. Boeve: drafting/revising the manuscript, analysis or interpretation of data, acquisition of data, study supervision. S. Weigand: drafting/revising the manuscript, analysis or interpretation of data, statistical analysis. S. Przybelski: analysis or interpretation of data, statistical analysis. P. Vemuri: analysis or interpretation of data, contribution of vital reagents/tools/patients. M. Murray: drafting/revising the manuscript. M. Senjem: drafting/revising the manuscript, analysis or interpretation of data, contribution of vital reagents/tools/patients. G. Smith: drafting/revising the manuscript, acquisition of data, obtaining funding. D. Knopman: drafting/revising the manuscript, acquisition of data. R. Petersen: drafting/revising the manuscript, obtaining funding. C. Jack: drafting/revising the manuscript, analysis or interpretation of data, study supervision. J. Parisi: analysis or interpretation of data, acquisition of data. D. Dickson: drafting/revising the manuscript, obtaining funding, neuropathologic confirmation of cases.
DISCLOSURE
K. Kantarci is funded by the NIH (R01-AG040042 [PI], R21-NS066147 [PI], Mayo Clinic Alzheimer's Disease Research Center/Project 1-P50-AG16574/P1 [PI], and R01-AG11378 [Co-I]). T. Ferman is funded by the NIH [Mayo Clinic Alzheimer's Disease Research Center/Project 1-P50-AG16574/P1 [Co-I]). B. Boeve has served as an investigator for a clinical trial sponsored by Cephalon, Inc. He has received honoraria from the American Academy of Neurology. He receives research support from the National Institute on Aging (P50-AG16574 [Co-I], U01 AG06786 [Co-I], R01-AG15866 [Co-I], and U24-AG26395 [Co-I]), and the Alzheimer's Association (IIRG-05–14560 [PI]). S. Weigand and S. Przybelski report no disclosures. P. Vemuri is funded by the NIH (K99-AG037573). M. Murray and M. Senjem report no disclosures. G. Smith is funded by the NIH (P50-AG16574). D. Knopman serves as an Associate Editor for Neurology®; serves on a data safety monitoring board for Lilly Pharmaceuticals; is an investigator in a clinical trial sponsored by Baxter, Elan Pharmaceuticals and Forest Pharmaceuticals; and receives research support from the NIH (R01-AG11378 [Co-I], P50-AG16574 [Co-I], U01-AG 06786 [Co-I], AG29550 [Co-I], AG32306 [Co-I], and U01–96917 [Co-I]). R. Petersen serves on scientific advisory boards for Elan Pharmaceuticals, Wyeth Pharmaceuticals, and GE Healthcare and receives research support from the NIH (P50-AG16574 [PI] and U01-AG06786 [PI], R01-AG11378 [Co-I], and U01–24904 [Co-I]). C. Jack serves as a consultant for Elan Corporation and receives research support from Pfizer, Inc, the NIA (AG11378 [PI], P50-AG16574 [Co-I], and U01-AG024904–01 [Co-I]), and the Alexander Family Alzheimer's Disease Research Professorship of the Mayo Foundation. J. Parisi is funded by the NIH (P50-AG16574/Neuropathology Core [Co-PI]). D. Dickson is funded by the NIH (P50-AG16574/Neuropathology Core [PI], P01-AG017216 [PI], P50-NS072187 [PI], and R01-AG040042 [Co-I]). Go to Neurology.org for full disclosures.
REFERENCES
- 1. Schneider JA, Arvanitakis Z, Bang W, Bennett DA. Mixed brain pathologies account for most dementia cases in community-dwelling older persons. Neurology 2007;69:2197–2204 [DOI] [PubMed] [Google Scholar]
- 2. Hansen L, Salmon D, Galasko D, et al. The Lewy body variant of Alzheimer's disease: a clinical and pathologic entity. Neurology 1990;40:1–8 [DOI] [PubMed] [Google Scholar]
- 3. Gomez-Tortosa E, Newell K, Irizarry MC, Albert M, Growdon JH, Hyman BT. Clinical and quantitative pathologic correlates of dementia with Lewy bodies. Neurology 1999;53:1284–1291 [DOI] [PubMed] [Google Scholar]
- 4. Galasko D, Hansen LA, Katzman R, et al. Clinical-neuropathological correlations in Alzheimer's disease and related dementias. Arch Neurol 1994;51:888–895 [DOI] [PubMed] [Google Scholar]
- 5. Fujishiro H, Iseki E, Higashi S, et al. Distribution of cerebral amyloid deposition and its relevance to clinical phenotype in Lewy body dementia. Neurosci Lett 2010;486:19–23 [DOI] [PubMed] [Google Scholar]
- 6. McKeith IG, Dickson DW, Lowe J, et al. Diagnosis and management of dementia with Lewy bodies: third report of the DLB Consortium. Neurology 2005;65:1863–1872 [DOI] [PubMed] [Google Scholar]
- 7. Csernansky JG, Hamstra J, Wang L, et al. Correlations between antemortem hippocampal volume and postmortem neuropathology in AD subjects. Alzheimer Dis Assoc Disord 2004;18:190–195 [PubMed] [Google Scholar]
- 8. Gosche KM, Mortimer JA, Smith CD, Markesbery WR, Snowdon DA. Hippocampal volume as an index of Alzheimer neuropathology: findings from the Nun Study. Neurology 2002;58:1476–1482 [DOI] [PubMed] [Google Scholar]
- 9. Jack CR, Jr, Dickson DW, Parisi JE, et al. Antemortem MRI findings correlate with hippocampal neuropathology in typical aging and dementia. Neurology 2002;58:750–757 [DOI] [PMC free article] [PubMed] [Google Scholar]
- 10. Silbert LC, Quinn JF, Moore MM, et al. Changes in premorbid brain volume predict Alzheimer's disease pathology. Neurology 2003;61:487–492 [DOI] [PubMed] [Google Scholar]
- 11. Vemuri P, Whitwell JL, Kantarci K, et al. Antemortem MRI based STructural Abnormality iNDex (STAND)-scores correlate with postmortem Braak neurofibrillary tangle stage. Neuroimage 2008;42:559–567 [DOI] [PMC free article] [PubMed] [Google Scholar]
- 12. Whitwell JL, Josephs KA, Murray ME, et al. MRI correlates of neurofibrillary tangle pathology at autopsy: a voxel-based morphometry study. Neurology 2008;71:743–749 [DOI] [PMC free article] [PubMed] [Google Scholar]
- 13. Kantarci K, Lowe VJ, Boeve BF, et al. Multimodality imaging characteristics of dementia with Lewy bodies. Neurobiol Aging Epub 2011 Oct 20 [DOI] [PMC free article] [PubMed] [Google Scholar]
- 14. Burton EJ, Karas G, Paling SM, et al. Patterns of cerebral atrophy in dementia with Lewy bodies using voxel-based morphometry. Neuroimage 2002;17:618–630 [PubMed] [Google Scholar]
- 15. Weisman D, Cho M, Taylor C, Adame A, Thal LJ, Hansen LA. In dementia with Lewy bodies, Braak stage determines phenotype, not Lewy body distribution. Neurology 2007;69:356–359 [DOI] [PubMed] [Google Scholar]
- 16. Vemuri P, Simon G, Kantarci K, et al. Antemortem differential diagnosis of dementia pathology using structural MRI: differential-STAND. Neuroimage 2010;55:522–531 [DOI] [PMC free article] [PubMed] [Google Scholar]
- 17. Whitwell JL, Weigand SD, Shiung MM, et al. Focal atrophy in dementia with Lewy bodies on MRI: a distinct pattern from Alzheimer's disease. Brain 2007;130:708–719 [DOI] [PMC free article] [PubMed] [Google Scholar]
- 18. Burton EJ, Mukaetova-Ladinska EB, Perry RH, Jaros E, Barber R, O'Brien JT. Neuropathological correlates of volumetric MRI in autopsy-confirmed Lewy body dementia. Neurobiol Aging 2012;33:1228–1236 [DOI] [PubMed] [Google Scholar]
- 19. Newell KL, Hyman BT, Growdon JH, Hedley-Whyte ET. Application of the National Institute on Aging (NIA)-Reagan Institute criteria for the neuropathological diagnosis of Alzheimer disease. J Neuropathol Exp Neurol 1999;58:1147–1155 [DOI] [PubMed] [Google Scholar]
- 20. Reisberg B, Ferris SH, de Leon MJ, Crook T. Global Deterioration Scale (GDS). Psychopharmacol Bull 1988;24:661–663 [PubMed] [Google Scholar]
- 21. Ferman TJ, Boeve BF, Smith GE, et al. Inclusion of RBD improves the diagnostic classification of dementia with Lewy bodies. Neurology 2011;77:875–882 [DOI] [PMC free article] [PubMed] [Google Scholar]
- 22. McKhann G, Drachman D, Folstein M, Katzman R, Price D, Stadlan EM. Clinical diagnosis of Alzheimer's disease: report of the NINCDS-ADRDA Work Group under the auspices of Department of Health and Human Services Task Force on Alzheimer's Disease. Neurology 1984;34:939–944 [DOI] [PubMed] [Google Scholar]
- 23. Petersen RC. Mild cognitive impairment as a diagnostic entity. J Intern Med 2004;256:183–194 [DOI] [PubMed] [Google Scholar]
- 24. Mirra SS, Heyman A, McKeel D, et al. The Consortium to Establish a Registry for Alzheimer's Disease (CERAD). Part II. Standardization of the neuropathologic assessment of Alzheimer's disease. Neurology 1991;41:479–486 [DOI] [PubMed] [Google Scholar]
- 25. Braak H, Braak E. Neuropathological staging of Alzheimer-related changes. Acta Neuropathol 1991;82:239–259 [DOI] [PubMed] [Google Scholar]
- 26. Maxwell SE, Delaney HD. Designing Experiments and Analyzing Data: A Model Comparison Perspective. Mahwah, NJ: Lawrence Erlbaum Associates; 2003 [Google Scholar]
- 27. Rothman KJ. No adjustments are needed for multiple comparisons. Epidemiology 1990;1:43–46 [PubMed] [Google Scholar]
- 28. Burton EJ, Barber R, Mukaetova-Ladinska EB, et al. Medial temporal lobe atrophy on MRI differentiates Alzheimer's disease from dementia with Lewy bodies and vascular cognitive impairment: a prospective study with pathological verification of diagnosis. Brain 2009;132:195–203 [DOI] [PubMed] [Google Scholar]
- 29. Barkhof F, Polvikoski TM, van Straaten EC, et al. The significance of medial temporal lobe atrophy: a postmortem MRI study in the very old. Neurology 2007;69:1521–1527 [DOI] [PubMed] [Google Scholar]
- 30. Whitwell JL, Jack CR, Jr, Kantarci K, et al. Imaging correlates of posterior cortical atrophy. Neurobiol Aging 2006;28:1051–1061 [DOI] [PMC free article] [PubMed] [Google Scholar]
- 31. Murray ME, Graff-Radford NR, Ross OA, Petersen RC, Duara R, Dickson DW. Neuropathologically defined subtypes of Alzheimer's disease with distinct clinical characteristics: a retrospective study. Lancet Neurol 2011;10:785–796 [DOI] [PMC free article] [PubMed] [Google Scholar]
- 32. Dawe RJ, Bennett DA, Schneider JA, Arfanakis K. Neuropathologic correlates of hippocampal atrophy in the elderly: a clinical, pathologic, postmortem MRI study. PLoS One 2011;6:e26286. [DOI] [PMC free article] [PubMed] [Google Scholar]
- 33. Braak H, Ghebremedhin E, Rub U, Bratzke H, Del Tredici K. Stages in the development of Parkinson's disease-related pathology. Cell Tissue Res 2004;318:121–134 [DOI] [PubMed] [Google Scholar]
- 34. Kantarci K, Avula R, Senjem ML, et al. Dementia with Lewy bodies and Alzheimer disease: neurodegenerative patterns characterized by DTI. Neurology 2010;74:1814–1821 [DOI] [PMC free article] [PubMed] [Google Scholar]
- 35. Schmeichel AM, Buchhalter LC, Low PA, et al. Mesopontine cholinergic neuron involvement in Lewy body dementia and multiple system atrophy. Neurology 2008;70:368–373 [DOI] [PubMed] [Google Scholar]
- 36. Benarroch EE, Schmeichel AM, Sandroni P, Parisi JE, Low PA. Rostral raphe involvement in Lewy body dementia and multiple system atrophy. Acta Neuropathol 2007;114:213–220 [DOI] [PubMed] [Google Scholar]
- 37. Szot P, White SS, Greenup JL, Leverenz JB, Peskind ER, Raskind MA. Compensatory changes in the noradrenergic nervous system in the locus ceruleus and hippocampus of postmortem subjects with Alzheimer's disease and dementia with Lewy bodies. J Neurosci 2006;26:467–478 [DOI] [PMC free article] [PubMed] [Google Scholar]
- 38. German DC, Manaye KF, White CL, 3rd, et al. Disease-specific patterns of locus coeruleus cell loss. Ann Neurol 1992;32:667–676 [DOI] [PubMed] [Google Scholar]
- 39. Langlais PJ, Thal L, Hansen L, Galasko D, Alford M, Masliah E. Neurotransmitters in basal ganglia and cortex of Alzheimer's disease with and without Lewy bodies. Neurology 1993;43:1927–1934 [DOI] [PubMed] [Google Scholar]