Abstract
Background
The role of ZEB1, a master epithelial-tomesenchymal transition gene, in malignant pleural mesothelioma (MPM) is unclear.
Methods
The expression of ZEB1, E-cadherin, vimentin, and epithelial cell adhesion molecule (EpCAM) in 18 MPM cell lines and a normal pleural mesothelial cell line MeT-5A was determined by quantitative real-time polymerase chain reaction and Western blot testing. RNA interference–mediated transient and/or stable knockdown of ZEB1 and EpCAM was performed. Microarray expression analysis was performed with a TORAY-3D gene chip. Growth was evaluated by colorimetric proliferation and colony formation assays. Luciferase reporter assay was performed to access the effects of ZEB1 knockdown on EpCAM promoter activity.
Results
Most MPM cell lines exhibited mesenchymal phenotype and expressed ZEB1. Transient ZEB1 knockdown suppressed growth in all four cell lines studied (ACC-MESO-1, H2052, Y-MESO-8A, Y-MESO-29) while stable ZEB1 knockdown suppressed growth only in Y-MESO-29. Genome-wide gene expression analysis revealed that EpCAM was the most prominently up-regulated gene by both transient and stable ZEB1 knockdown in ACC-MESO-1, with more marked up-regulation in stable knockdown. We hypothesized that EpCAM up-regulation counteracts the stable ZEB1 knockdown-induced growth inhibition in ACC-MESO-1. Transient EpCAM knockdown suppressed growth dramatically in ACC-MESO-1 cells expressing shZEB1 but only modestly in those expressing shGFP, supporting our hypothesis. Luciferase reporter assay showed that ZEB1 knockdown resulted in increased EpCAM promoter activity. EpCAM was also up-regulated in Y-MESO-29 expressing shZEB1, but this EpCAM up-regulation did not counteract ZEB1 knockdown-induced growth suppression, suggesting that the counteracting effects of EpCAM may be cellular context dependent.
Conclusions
RNA interference-mediated ZEB1 knockdown may be a promising therapeutic strategy for MPM, but one has to consider the possibility of diminished growth inhibitory effects of long-term ZEB1 knockdown, possibly as a result of EpCAM up-regulation and/or other gene expression changes resulting from ZEB1 knockdown.
Malignant pleural mesothelioma (MPM) is a highly aggressive tumor arising from the mesothelium lining the pleural surface, mostly resulting from occupational exposure to asbestos fibers.1,2 The disease progresses rapidly and is highly resistant to current therapeutic modalities comprising chemotherapy, radiotherapy, and surgery, and therefore the overall survival is extremely poor, with the median survival being 9 to 17 months.2 Two thousand to 3000 new MPM cases occur yearly in the United States, and the incidence of this disease is predicted to continue rising for the next two decades. Thus, it is imperative to develop novel therapeutics for MPM that target the molecules commonly altered in MPM.
Malignant cells of epithelial origin often lose their epithelial phenotype and acquire fibroblastic characteristics during disease progression.3 This process is referred to as the epithelial-to-mesenchymal transition (EMT). EMT was originally discovered as an embryonic developmental program involving drastic changes in cell morphology as well as expression of EMT-associated genes. EMT occurs during the progression of several types of human epithelial cancers and confers motility and invasiveness on the cells, leading them to acquire the ability to metastasize to distant sites. MPM originates in normal pleural mesothelial cells, which derive from mesodermal (mesenchymal) cells, and one could hypothesize that the mesodermal origin of MPM contributes to its aggressive behavior.4 In support of this hypothesis, MPM tumors often show epithelial histological features, which correlates with a favorable patient prognosis.1
Several master EMT regulator genes encoding transcription factors, including Twist, Snail, Slug, ZEB1, SIP, and Goosecoid, have been identified, and their roles in epithelial cancers have been demonstrated.5 Among them, ZEB1 is increasingly considered to be a key player in the progression of epithelial cancers. ZEB1 promotes tumor metastasis in colon and breast cancer and enhances transendothelial migration in prostate cancer cells.6 In addition, we recently showed that transient knockdown of ZEB1 in lung cancer greatly suppresses anchorage-independent growth of lung cancer cells.7
With this background, we aimed to study the role of ZEB1 in the pathogenesis of MPM. To this end, we performed transient and stable knockdown of ZEB1 and evaluated its effects on the growth of MPM.
MATERIALS AND METHODS
Cell Lines and Tissue Culture
Eighteen MPM cell lines (H28, H290, H2052, H2373, H2452, Y-MESO-8A, Y-MESO-8D, Y-MESO-9, Y-MESO-12, Y-MESO-14, Y-MESO-21, Y-MESO-22, Y-MESO-25, Y-MESO-26B, Y-MESO-29, MASTO-211H, ACC-MESO-1, ACC-MESO-4) and one lung cancer cell line (H1299) used in this study were purchased from American Type Culture Collection (ATCC, Manassas, VA) or obtained from the Aichi Cancer Center or University of Texas Southwestern Medical Center collections.8 These cells were cultured with RPMI 1640 (Sigma-Aldrich, St. Louis, MO) supplemented with 10% fetal bovine serum. The nontumorigenic mesothelial cell line MeT-5A, which was established by introduction of SV40 large T antigen into normal epithelial cells, was purchased from ATCC and used as a normal control line.9 MeT-5A cells were cultured in Medium 199 with Earle’s BSS, 0.75 mM l-glutamine, and 1.25 g/L sodium bicarbonate supplemented with 3.3 nM epidermal growth factor, 400 nM hydrocortisone, 870 nM insulin 20 mM HEPES, and 10% fetal bovine serum.
RNA Isolation and Quantitative Real-Time Polymerase Chain Reaction Analysis
Five micrograms of total RNA isolated with Trizol (Invitrogen, Carlsbad, CA) were reverse transcribed with a Superscript III First-Strand Synthesis System with a Random primer system (Invitrogen). Quantitative real-time polymerase chain reaction (qRT-PCR) of E-cadherin, vimentin, ZEB1, and EpCAM was performed as described previously with the standard TaqMan assay-on-demand PCR protocol in a reaction volume of 20 µL, including 1 µL cDNA (10). We used the comparative Ct method to compute relative expression values. We used GAPDH (Applied Biosystems assay-on-demand) as an internal control.
Western Blot Analysis
Western blot analysis was performed as described previously with whole cell lysates.10 Primary antibodies used were mouse monoclonal anti-E-cadherin, anti-vimentin (BD Bioscience, Franklin Lakes, NJ), goat polyclonal anti-ZEB1 (Santa Cruz Biotechnology, Santa Cruz, CA), rabbit polyclonal anti-cleaved caspase 3 (Cell Signaling Technology, Danvers, MA), mouse monoclonal anti-EpCAM (Thermo Fisher Scientific, Waltham, MA) and mouse monoclonal anti-actin (Sigma) antibodies. Actin protein was used as a control for adequacy of equal protein loading. Anti-rabbit, anti-mouse (GE Healthcare, Buckinghamshire, England), or anti-goat antibody (R&D Systems, Minneapolis, MN) was used at a 1:2000 dilution as a secondary antibody.
Transfection of Short Interfering RNA
Cells (4.5 × 10⁵) were plated in six-well plates. The next day, the cells were transiently transfected with either 10 nM predesigned short interfering RNA (siRNA) (Stealth Select RNAi) targeting ZEB1, EpCAM, or a control siRNA purchased from Invitrogen with Lipofectamine RNAiMAX (Invitrogen) according to the manufacturer’s protocol. After 48 h, the transfected cells were collected for further analyses or plated for cell growth assays.
Transfection of shRNA Expressing Retroviral Vectors
pSUPER.retro.ZEB1 and pSUPER.retro.GFP control vectors were kindly provided by Dr. Thomas Brabletz.11 Virus-containing medium was produced as described previously.10 Target cells were transduced by retrovirus-containing medium and then underwent drug selection with puromycin for 3 to 5 days.
Cell Growth Assay
A colorimetric proliferation assay was performed with a WST-1 assay kit (Roche, Basel, Switzerland) according to the manufacturer’s instructions. Liquid and soft agar colony formation assays were done as described previously.10
Cell Cycle Analysis
Cells were collected 48 h after the transfection of siRNA oligos. Cells were fixed in 70% ethanol, treated with RNase A, stained with propidium iodide with a BD Cycletest Plus Reagent Kit (BD Bioscience) according to the instructions of the manufacturer, and analyzed by flow cytometry for DNA synthesis and cell cycle status (FACSCalibur cell sorter, Becton Dickinson) with BD Cell Quest Pro version 5.2.1 (BD Bioscience).
Microarray Expression Analysis
For DNA microarray analysis, a 3D-Gene Human Oligo chip 25 k (Toray Industries, Tokyo, Japan) was used (25,370 distinct genes). Additional details of microarray analysis are described in the Supplemental Information.
Senescence-Associated β-Galactosidase Staining
Cells were stained with β-galactosidase with a Senescence β-Galactosidase Staining Kit (Cell Signaling Technology), and cells stained blue were counted under a microscope (×200 total magnification).
Immunohistochemistry
Surgically resected 15 primary MPM tumor and four normal parietal pleura samples were obtained from patients at Nagoya University Hospital. Before tissue samples were collected ethical approval and fully informed written consent from all patients were obtained. Immunohistochemistry of ZEB1 was performed using standard techniques with some modifications. Additional details of immunohistochemistry analysis are described in Supporting Information.
Luciferase Reporter Assay
Cells were transfected with ZEB1 or control siRNA oligos. Next day, the transfected cells were replated in 96-well plates and then transfected with TACSTD1 (EpCAM)-PROM firefly luciferase vector (Switchgear) containing entire promoter region of EpCAM or pGL4.11 control vector (Promega) and phRL-TK renilla luciferase vector. Forty-eight hours after transfection, reporter gene activities were determined by a luminometer with Dual-Luciferase reporter assay system (Promega). Reporter activity was normalized by calculating the ratio of firefly/renilla values.
Statistical Analysis
SPSS version 18 software (SPSS, Chicago, IL) was used for all statistical analyses in this study. The Mann-Whitney U-test was used for analyzing differences between two groups.
RESULTS
The majority of MPM cell lines exhibit mesenchymal phenotype (low E-cadherin/high vimentin) and express ZEB1
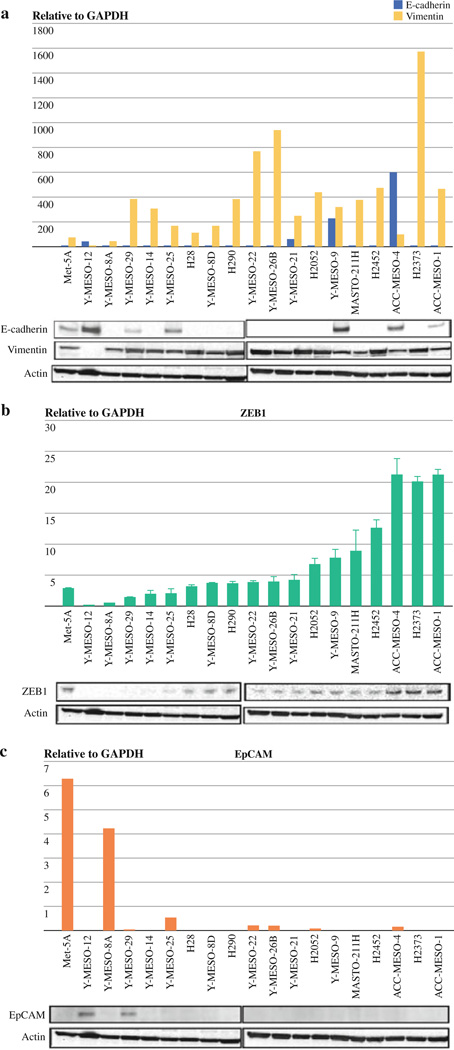
We performed qRT-PCR and Western blot testing of ZEB1, vimentin (a mesenchymal marker), E-cadherin (an epithelial marker), and epithelial cell adhesion molecule (EpCAM) for 18 MPM cell lines and MeT-5A, a nontumorigenic mesothelial cell line, used as a normal control. The majority of MPM lines expressed undetectable to very low levels of E-cadherin and high levels of vimentin, which probably reflects the mesodermal origin of MPM (Fig. 1a). ZEB1 directly inhibits E-cadherin expression, and an inverse correlation between their expressions has been shown in several different types of human cancers.7,12 However, we did not see a correlation between E-cadherin and ZEB1 expression (Fig. 1a, b). Only two cell lines (Y-MESO-12, Y-MESO-29) expressed detectable levels of EpCAM protein (Fig. 1c).
FIG. 1.
Most MPM cell lines exhibit mesenchymal phenotype (low E-cadherin/high vimentin) and express ZEB1. qRT-PCR (top) and Western blot testing (bottom) analyses of E-cadherin, vimentin (a), ZEB1 (b), and EpCAM (c) in 18 MPM cell lines and the immortalized pleural mesothelioma line MeT-5A (control)
Transient ZEB1 Knockdown Induces Re-expression of E-cadherin in ACC-MESO-1 but Not in H2052
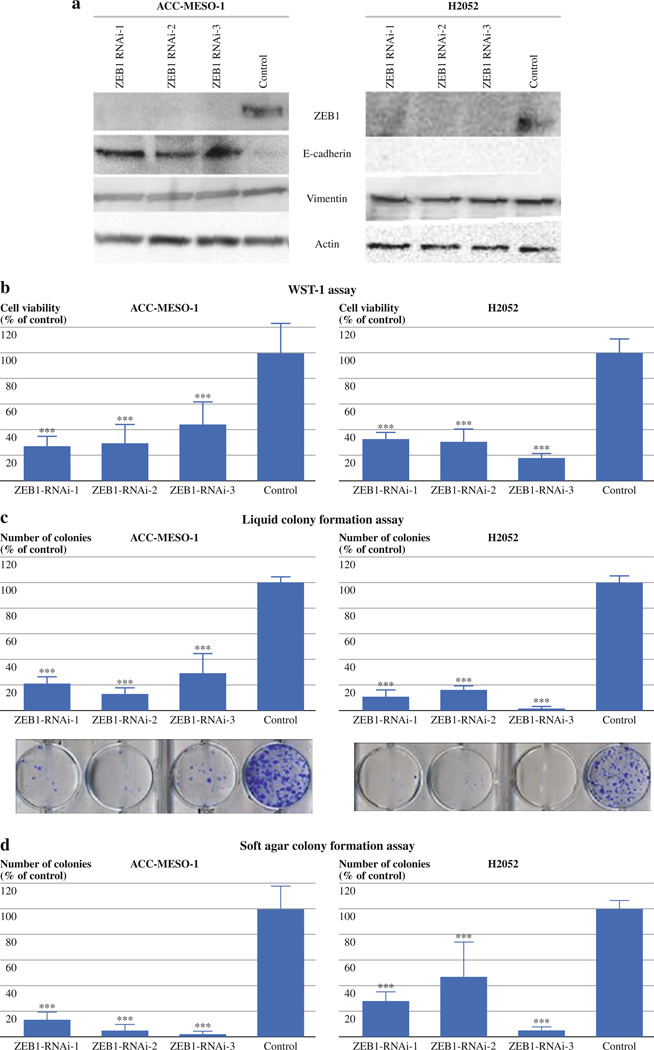
To see whether ZEB1 expression plays a role in inhibiting E-cadherin expression in MPM cells, we performed transient knockdown of ZEB1 using prevalidated synthesized siRNA oligos (Invitrogen) in two mesothelioma lines, ACC-MESO-1 and H2052, which express high and moderate levels of ZEB1 mRNA, respectively (Fig. 1b). The two cell lines were transiently transfected with each of the three ZEB1 siRNA or control oligos and collected 48 h after transfection for protein expression analyses. Western blot testing of ZEB1 showed that clear suppression of ZEB1 protein by all three siRNA oligos was obtained in the two lines (Fig. 2a). After the ZEB1 knockdown, E-cadherin protein was re-expressed in ACC-MESO-1 but not in H2052. A previous study reported that the promoter region of E-cadherin is heavily methylated in H2052 cells, which results in silenced E-cadherin expression in the cells.13 Thus, it is likely that the loss of ZEB1 expression was unable to overcome this methylation-mediated gene silencing in H2052 cells. Vimentin expression did not change in either of the lines (Fig. 2a).We did not observe marked morphological changes in either of the cell lines after the transient ZEB1 knockdown.
FIG. 2.
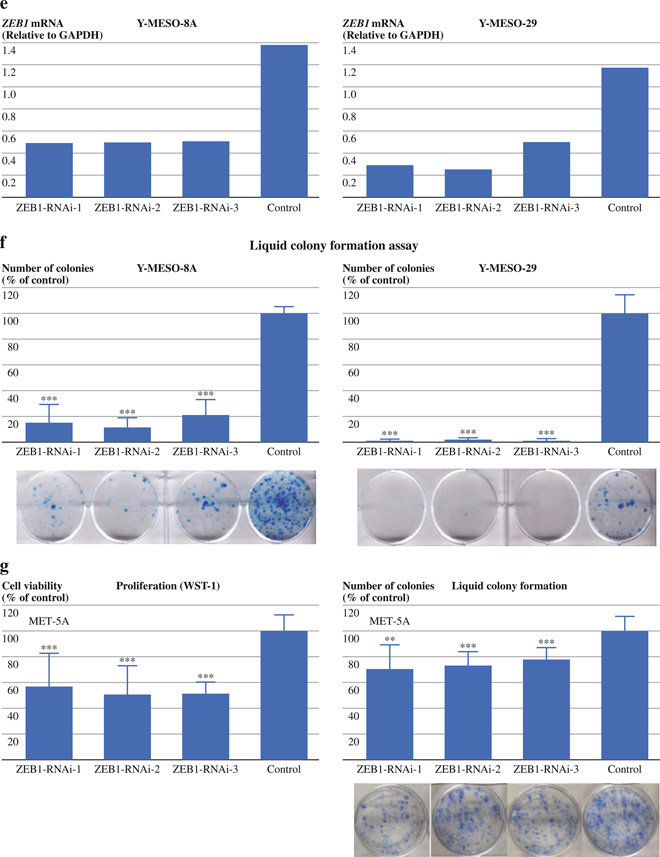
Transient ZEB1 knockdown suppresses cellular proliferation and liquid and soft agar colony formation in MPM cell lines. (a) Western blots of ZEB1, E-cadherin, and vimentin in ACC-MESO-1 and H2052 transfected with ZEB1 knockdown siRNA or control oligos. Actin was used as a loading control. (b) Cell proliferation (WST-1) assay for ACC-MESO-1 and H2052 cells transfected with ZEB1 knockdown siRNA or control oligos. Cells were transfected with 3 different siRNA oligos targeting ZEB1 or control oligos. Cells were counted 48 h after transfection, and 1000 cells were plated in 96-well plates. Absorbance values were determined 96 h after transfection. Results are from 3 independent experiments with 8 replicates each and shown as mean ± SD. Values of cells transfected with control oligos are set as 100%. (c) Liquid colony formation assay of ACC-MESO-1 and H2052 cells transfected with ZEB1 knockdown siRNA or control oligos. Cells were counted 48 h after transfection, and 500 to 1000 cells were plated in 6-well plates in triplicate, cultured for 2 weeks, and stained with methylene blue. Colonies >2 mm were counted. Results are from 3 independent experiments and shown as mean ± SD. Colony numbers of cells transfected with control oligos are set as 100%. (d) Soft agar colony formation assay for ACC-MESO-1 and H2052 cells transfected with ZEB1 knockdown siRNA or control oligos. Cells were counted 48 h after transfection, and 1000 cells were suspended in 0.37% SeaKem GTG Agarose (Lonza, Rockland, ME) in triplicate 12-well plates. About 2 weeks later, colonies (>50 cells) were counted. Results from 3 independent experiments are shown as mean ± SD. Colony numbers of cells transfected with control oligos are set as 100%. (e) qRT-PCR analysis of ZEB1, E-cadherin, and vimentin in Y-MESO-8A and Y-MESO-29 transfected with ZEB1 knockdown siRNA or control oligos. (f) Liquid colony formation assay of Y-MESO-8A and Y-MESO-29 cells transfected with ZEB1 knockdown siRNA or control oligos. (g) WST1 and liquid colony formation assays of MeT-5A cells transfected with ZEB1 knockdown siRNA or control oligos. **P < 0.01, ***P < 0.001 (Mann–Whitney U-test)
Transient ZEB1 Knockdown Induces Suppression of Proliferation, Anchorage-Dependent, and Anchorage-Independent Clonal Growth in MPM Cells
To test the effects of ZEB1 knockdown on cell proliferation in mass culture, we did colorimetric growth assays. Two days after the transfection of ZEB1 siRNA oligos, ACC-MESO-1 and H2052 cells were plated for growth assays. ZEB1 knockdown suppressed proliferation in the two cell lines compared to control cells (Fig. 2b). To examine the effect of ZEB1 knockdown on the clonogenic growth of MPM cells in anchorage-dependent and -independent conditions, we performed liquid and soft agar colony formation assays, respectively. In both assays, ZEB1 knockdown dramatically suppressed colony formation in the two cell lines (Fig. 2c, d). To evaluate cell death rate due to “off-target” effects in cells transfected with control siRNA, we included cells transfected with transfection reagent only in the proliferation and liquid colony formation experiments and we did not see statistically significant differences in cell death rates between these two treatment groups (data not shown), indicating that cell death rates due to “off-target” effects in the controls were very low. To see whether such dramatic growth inhibitory effects of transient ZEB1 knockdown are also seen in MPM cell lines that express ZEB1 at low levels, we did transient ZEB1 knockdown for Y-MESO-8A and Y-MESO-29, which express ZEB1 mRNA at very low levels (ZEB1 protein was not detectable) (Fig. 1b). Efficient ZEB1 knockdown in these cell lines was confirmed by qRT-PCR (Fig. 2e). The knockdown dramatically suppressed their liquid colony formation (Fig. 2f), suggesting that low levels of ZEB1 expression also have roles in the growth of MPM cells. In addition, we performed ZEB1 knockdown in MeT-5A cells. ZEB1 knockdown suppressed proliferation of MeT-5A to ~50% while the knockdown only marginally suppressed its liquid colony formation (Fig. 2g), suggesting that MPM cell lines are more dependent on their growth for ZEB1 expression than their normal counterpart cell line. To explore the mechanism underlying the growth inhibition by ZEB1 knockdown in the MPM cell lines we performed apoptosis, cell cycle, and senescence analyses in ACC-MESO-1 and H2052. However, we did not see any differences between ZEB1 knockdown and control cells in any of the assays (data not shown). To gain insights into underlying mechanisms of growth inhibition by transient ZEB1 knockdown we performed genome-wide gene expression analysis for ACC-MESO-1 cells transfected with ZEB1 or control siRNA oligos. Genes more than 4-fold up- and down-regulated are shown in Tables 1 and 2, respectively. Several genes known to have oncogenic roles were down-regulated by more than 2-fold in ZEB1 knockdown cells compared to control, including KRAS, Interleukin 6, β-catenin, cyclin E, and caveolin 1.14,15 Conversely, PTEN, a well-known tumor suppressor gene was up-regulated by more than 2-fold in ZEB1 knockdown cells.6 These expression changes may contribute to growth inhibitory effects of ZEB1 knockdown.
TABLE 1.
More than 4-fold up-regulated genes by transient ZEB1 knockdown in ACC-MESO-1 cells
| Transient knockdown | Stable knockdown | Gene neame | |||
|---|---|---|---|---|---|
| Symbol | Fold | Log2 | Fold | Log2 | |
| EPCAM | 17.6 | 4.1 | 115.8 | 6.9 | Epithelial cell adhesion molecule |
| SPINT2 | 6.2 | 2.6 | 2.4 | 1.3 | serine peptidase inhibitor, Kunitz type, 2 |
| CDS1 | 6.1 | 2.6 | 5.1 | 2.4 | CDP-diacylglycerol synthase 1 |
| F2RL1 | 5.3 | 2.4 | 2.7 | 1.4 | coagulation factor II (thrombin) receptor-like 1 |
| DDIT4 | 5.3 | 2.4 | 4.6 | 2.2 | DNA-damage-inducible transcript 4 |
| IGSF6 | 5.3 | 2.4 | 0.1 | −2.9 | immunoglobulin superfamily, member 6 |
| PDE1C | 4.9 | 2.3 | 0.9 | −0.2 | phosphodiesterase 1C, calmodulin-dependent 70kDa |
| ARL15 | 4.7 | 2.2 | 0.3 | −2.0 | ADP-ribosylation factor-like 15 |
| TJP3 | 4.7 | 2.2 | 0.5 | −0.9 | tight junction protein 3 (zona occludens 3) |
| RNASEN | 4.7 | 2.2 | 0.0 | drosha, ribonuclease type III | |
| GRB14 | 4.5 | 2.2 | 7.4 | 2.9 | growth factor receptor-bound protein 14 |
| APOC2 | 4.4 | 2.1 | 0.7 | −0.5 | apolipoprotein C-II |
| SERPINI1 | 4.3 | 2.1 | 2.0 | 1.0 | serpin peptidase inhibitor, clade I (neuroserpin), member 1 |
| CLTCL1 | 4.3 | 2.1 | 1.3 | 0.4 | clathrin, heavy chain-like 1 |
| BCL7A | 4.1 | 2.0 | 1.0 | 0.0 | B-cell CLL/lymphoma 7A |
| AIF1L | 4.0 | 2.0 | 1.0 | 0.0 | allograft inflammatory factor 1-like |
| ADAMTS1 | 4.0 | 2.0 | 1.8 | 0.8 | ADAM metallopeptidase with thrombospondin type 1 motif, 1 |
TABLE 2.
More than 4-fold down-regulated genes by transient ZEB1 knockdown in ACC-MESO-1 cells
| Transient knockdown | Stable knockdown | Gene neame | |||
|---|---|---|---|---|---|
| Symbol | Fold | Log2 | Fold | Log2 | |
| TMEM30A | 0.11 | −3.2 | 0.8 | −0.2 | transmembrane protein 30A |
| SLC25A15 | 0.13 | −2.9 | 0.8 | −0.3 | solute carrier family 25 member 15 |
| APPL | 0.14 | −2.8 | 1.6 | 0.6 | adaptor protein, phosphotyrosine interaction, PH domain and leucine Zipper |
| SLC4A8 | 0.15 | −2.8 | 0.3 | −1.7 | solute carrier family 4, sodium bicarbonate cotransporter, member 8 |
| STYX | 0.16 | −2.6 | 1.3 | 0.4 | serine/threonine/tyrosine interacting protein |
| CAV1 | 0.17 | −2.6 | 0.8 | −0.3 | caveolin 1, caveolae protein, 22kDa |
| ACADM | 0.18 | −2.5 | 0.5 | −1.0 | acyl-CoA dehydrpgenase, C-4 to C-12 straight chain |
| GJA1 | 0.18 | −2.5 | 0.3 | −1.6 | gap junction protein, alpha 1, 43kDa |
| C13orf37 | 0.19 | −2.4 | 1.0 | 0.0 | mitotic spindle organizing protein 1 |
| NXT2 | 0.19 | −2.4 | 0.7 | −0.6 | nuclear transport factor 2-like export factor 2 |
| MAPRE1 | 0.20 | −2.3 | 1.1 | 0.2 | microtubule-associated protein, RP/EB family, member 1 |
| CRYBA4 | 0.22 | −2.2 | 0.0 | crystallin, beta A4 | |
| VMA21 | 0.23 | −2.1 | 0.5 | −1.0 | VMA21 vacuolar H+ATpase homolog (S. cerevisiae) |
| ZEB1 | 0.23 | −2.1 | 0.2 | −2.0 | zinc finger E-box binding homeobox 1 |
| NLRP1 | 0.24 | −2.1 | 0.6 | −0.7 | NLR family, pyrin domain containing 1 |
| NSF | 0.24 | −2.0 | 0.6 | −0.8 | N-ethylmaleimide-sensitive factor |
| DMD | 0.25 | −2.0 | 1.2 | 0.3 | dystrophin |
| MPP4 | 0.25 | −2.0 | 0.0 | membrane protein, palmitoylated 4 (MAGUK p55 subfamily member 4) | |
| CMTM6 | 0.25 | −2.0 | 0.8 | −0.4 | CKLF-like MARVEL transmembrane domain containing 6 |
Stable Knockdown of ZEB1 Induces Morphological Changes Suggestive of Mesenchymal-to-Epithelial Transition (MET) in ACC-MESO-1 Cells
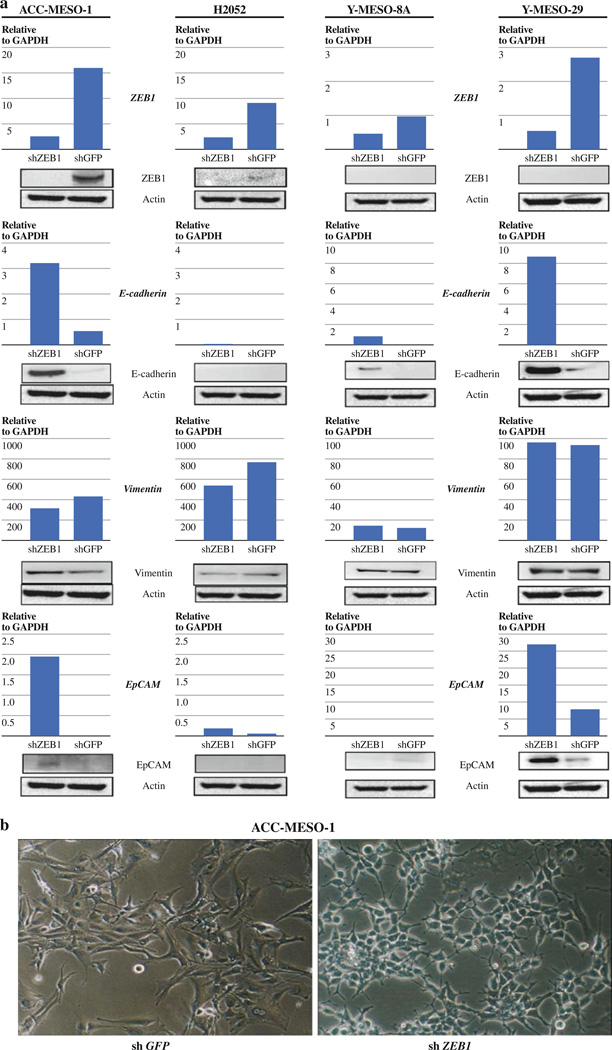
To evaluate the long-term effects of ZEB1 knockdown on growth as well as cellular morphology in MPM cells, we performed stable ZEB1 knockdown with a retroviral short hairpin RNA (shRNA)-expressing vector. ACC-MESO-1, H2052, Y-MESO-8A, and Y-MESO-29 cells were transfected with a shZEB1- or shGFP-expressing vector and underwent drug selection. Stable ZEB1 knockdown resulted in E-cadherin re-expression in ACC-MESO-1, Y-MESO-8A, and Y-MESO-29 but not in H2052 while vimentin expression remained unchanged in all the cell lines (Fig. 3a). Stable ZEB1 knockdown caused ACC-MESO-1 to undergo morphological changes suggestive of a mesenchymal-to-epithelial (MET) transition; ACC-MESO-1 cells changed their morphology from an elongated spindle-like (fibroblastic) shape with a scattered growth pattern to a rounded epithelial-like shape with a cobblestone-like growth pattern (Fig. 3b). These morphological changes together with the E-cadherin re-expression after ZEB1 knockdown suggest that ZEB1 expression contributes to maintaining the mesenchymal phenotype in ACC-MESO-1. MET-like morphological changes were not seen in other cell lines after stable ZEB1 knockdown.
FIG. 3.
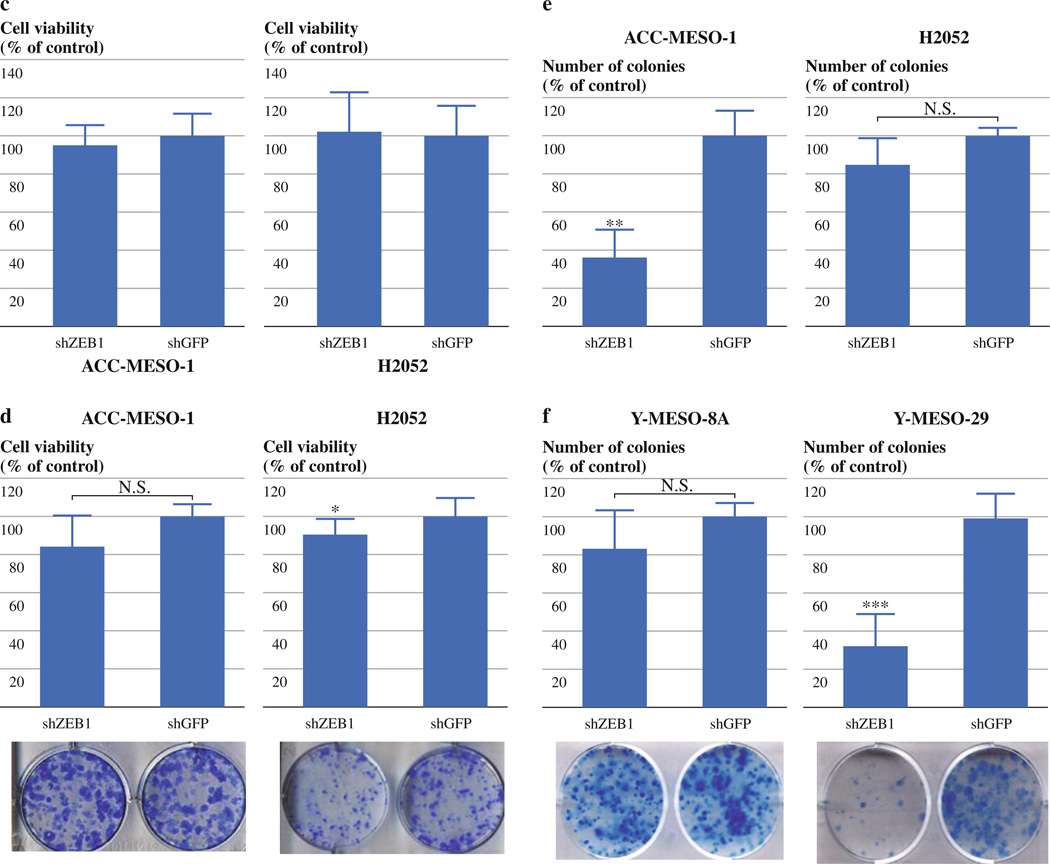
Stable knockdown of ZEB1 inhibits growth only modestly or not at all in malignant mesothelioma cell lines. (a) qRT-PCR analysis of E-cadherin, vimentin ZEB1, and EpCAM in ACC-MESO-1, H2052, Y-MESO-8A and Y-MESO-29 cells transfected with shZEB1 or shGFP vectors. (b) Photomicrographs of ACC-MESO-1 cells transfected with shZEB1 or shGFP vectors. Note that ACC-MESO-1 cells transfected with shZEB1 vector exhibit an epithelial shape with a cobblestone-like spreading pattern. (c) Cell proliferation (WST-1) assay for ACC-MESO-1 and H2052 cells transfected with shZEB1 or shGFP vectors. The results are averages of 3 independent experiments. (d) Liquid colony formation assay for ACC-MESO-1 and H2052 cells transfected with shZEB1 or shGFP vectors. The results are averages of 3 independent experiments. *P < 0.05 (Mann–Whitney U-test) (e) Soft agar colony formation assay of ACC-MESO-1 and H2052 cells transfected with shZEB1 or shGFP vectors. (f) Liquid colony formation assay for Y-MESO-8A and Y-MESO-29 cells transfected with shZEB1 or shGFP vectors. The results are averages of 2 or 3 independent experiments. **P < 0.01 (Mann–Whitney U-test)
Stable ZEB1 Knockdown Shows Only Modest Growth Suppression in MPM Cells
To evaluate the effects of stable ZEB1 knockdown on the growth of MPM cells, we performed WST-1 proliferation and liquid and soft agar colony formation assays on ACC-MESO-1 and H2052 cells expressing shZEB1 or shGFP. WST-1 and liquid colony formation assays showed no or only a slight difference between shZEB1 and shGFP-expressing cells in the cell lines (Fig. 3c, d). Soft agar colony formation assays showed that the stable ZEB1 knockdown suppressed colony formation in ACC-MESO-1 but not in H2052 cells (Fig. 3e). We also performed liquid colony formation assay for ZEB1 low-expressing cells (ACC-MESO-8A, ACC-MESO-29). Stable ZEB1 knockdown suppressed liquid colony formation to ~80% in ACC-MESO-8A and to ~30% in ACC-MESO-29 compared to controls (Fig. 3f). These results indicate that stable ZEB1 knockdown suppressed growth of MPM cells to a lesser extent compared to transient ZEB1 knockdown, suggesting that other factors may diminish growth inhibitory effects of ZEB1 knockdown in these cells.
Diminished growth inhibition of stable ZEB1 knockdown in ACC-MESO-1 cells is in part attributed to up-regulation of EpCAM resulting from ZEB1 knockdown
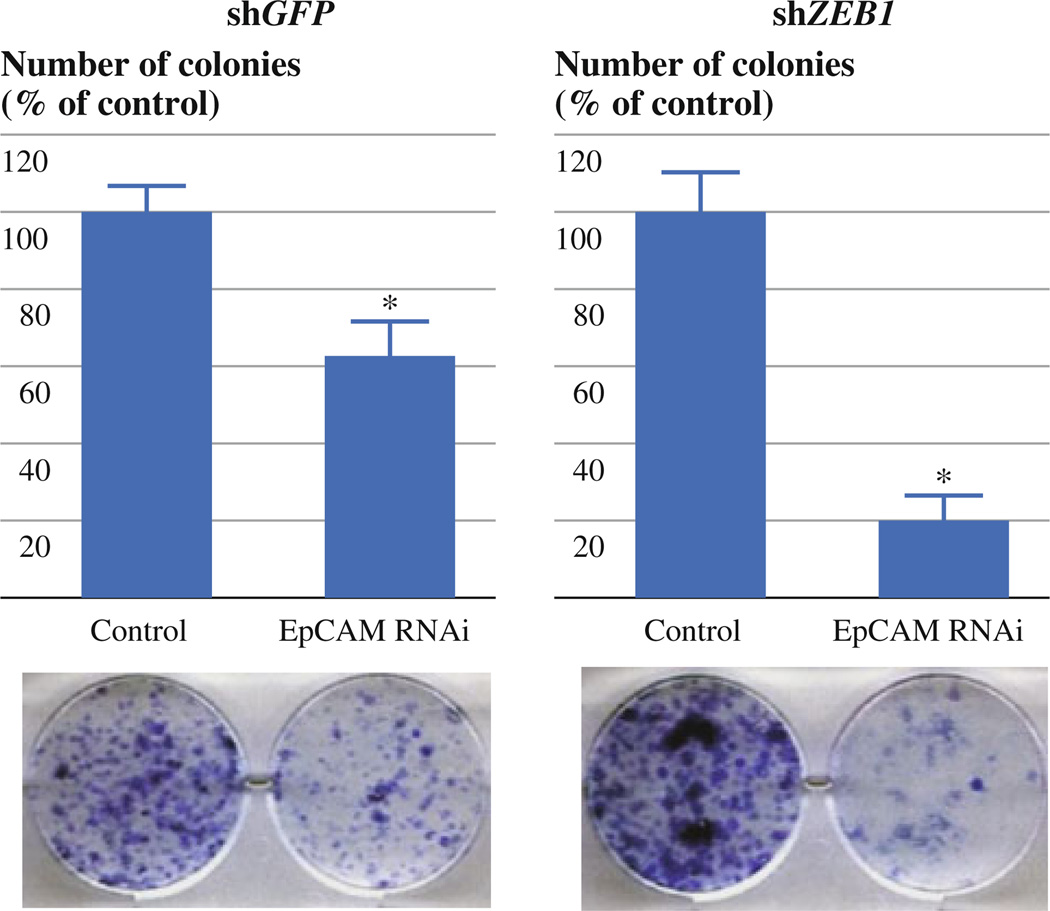
To explore genes that may contribute to diminished growth inhibitory effects of stable ZEB1 knockdown we performed genome-wide gene expression analysis of stable ZEB1 knockdown ACC-MESO-1 cells and compared its results with those of transient ZEB1 knockdown cells (Tables 1 and 2). Of note, EpCAM was the most prominently up-regulated genes in both transient and stable ZEB1 knockdown experiments, with more marked up-regulation in stable knockdown (6.6 times more up-regulated in stable knockdown than in transient knockdown). Oncogenic roles of EpCAM are well-demonstrated by several groups including us.17–19 Thus, we hypothesized that this marked EpCAM up-regulation by stable ZEB1 knockdown may in part contribute to the diminished growth inhibition by stable ZEB1 knockdown in ACC-MESO-1 cells. To test this hypothesis, we examined whether EpCAM knockdown inhibits growth of shZEB1-expressing ACC-MESO-1. EpCAM knockdown dramatically suppressed liquid colony formation in shZEB1-expressing ACC-MESO-1 cells but only modestly suppressed in those expressing shGFP (Fig. 4). These results suggest that EpCAM up-regulation induced by stable ZEB1 knockdown may in part account for the diminished growth inhibitory effects of stable ZEB1 knockdown in ACC-MESO-1 cells. Nevertheless, this finding was not generalized to other cell lines. Y-MESO-8A, which also showed no growth suppression by stable ZEB1 knockdown (Fig. 3f), did not up-regulate EpCAM expression after stable ZEB1 knockdown (Fig. 3a). In addition, Y-MESO-29 showed growth suppression by stable ZEB1 knockdown (Fig. 3f) although it showed EpCAM up-regulation by stable ZEB1 knockdown (Fig. 3a). These suggest that the counteracting effects of EpCAM may be cellular context-dependent and that other gene expression changes resulting from ZEB1 knockdown may also contribute to the diminished growth inhibition.
FIG. 4.
EpCAM knockdown suppresses liquid colony formation of ACC-MESO-1 cells more prominently in those expressing shZEB1 than in those expressing shGFP. Liquid colony formation assay for ACC-MESO-1 cells expressing shZEB1 or shGFP vectors transiently transfected with EpCAM siRNA or control oligos. Cells expressing shZEB1 or shGFP vectors were transiently transfected with EpCAM siRNA or control oligos. A thousand cells were plated in 6-well plates in triplicate 48 h after transfection, cultured for 2 weeks, and stained with methylene blue. Colonies >2 mm were counted. Results are from 3 independent experiments and shown as mean ± SD. Numbers of control cell colonies are set as 100%. *P < 0.001 (Mann–Whitney U-test)
ZEB1 Suppresses EpCAM Expression through Repressing EpCAM Promoter Activity
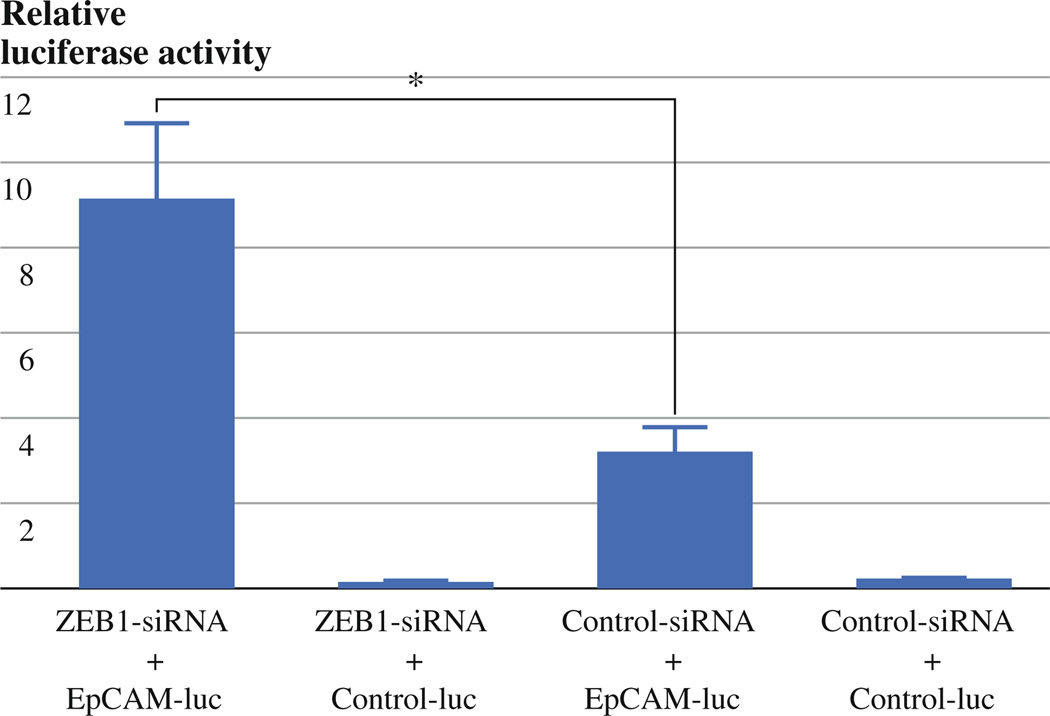
To see whether ZEB1 knockdown-induced EpCAM up-regulation results from induction of promoter activity, we performed luciferase reporter assay. We used H1299 lung cancer cell line because it can be easily transfected with plasmid DNA. H1299 cells were transfected with ZEB1 or control siRNA oligos, and then transfected with EpCAM promoter containing luciferase vector or promoterless control vector (pGL4.11) and phRL-TK vector. EpCAM transcription activity was higher in H1299 cells transfected with ZEB1 siRNA oligos than in those transfected with control siRNA oligos, demonstrating that ZEB1 knockdown-induced EpCAM up-regulation results from induction of promoter activity (Fig. 5).
FIG. 5.
ZEB1 suppresses EpCAM mRNA expression through repressing EpCAM promoter activity. ZEB1 or control siRNA-transfected H1299 cells were transfected with TACSTD1 (EpCAM)-PROM firefly luciferase vector or pGL4.11 control vector and phRL-TK renilla luciferase vector. The ratios of firefly/renilla luciferase activities are shown. Representative data from 3 independent experiments are shown. *P < 0.05
ZEB1 Protein Is Expressed in a Substantial Fraction of Human MPM Tissue Sections
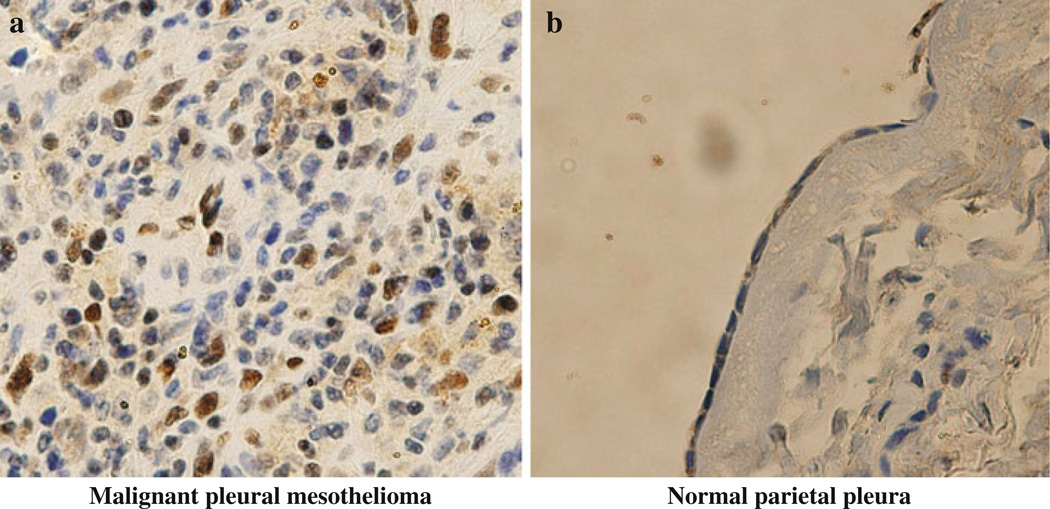
We analyzed ZEB1 protein expression in 15 clinical MPM samples as well as four normal parietal pleural samples by immunohistochemistry. The analysis revealed that nine (60%) of the 15 MPMs showed nuclear and/or cytoplasmic ZEB1 expression while none of the four normal parietal pleural samples showed detectable levels of ZEB1 protein (Fig. 6), suggesting the relevant role of ZEB1 in human MPM.
FIG. 6.
ZEB1 protein is expressed in a substantial fraction of human MPM tissue sections. Representative photographs of immunohistochemical staining of ZEB1 in MPM tumor (a) and normal parietal pleural (b) tissue sections. Original magnification, ×400
DISCUSSION
In the present study we showed that the majority of MPM cell lines express ZEB1, and that the transient knockdown of ZEB1 expression with RNA interference in four MPM cell lines dramatically suppressed their in vitro growth. However, stable ZEB1 knockdown showed less growth inhibitory effects in these MPM cell lines. Gene expression analysis revealed that numerous genes were differentially expressed between transient and stable ZEB1 knockdown in ACC-MESO-1 cells, including known oncogene EpCAM. EpCAM knockdown more significantly inhibited growth in ACC-MESO-1 cells expressing shZEB1 than in those expressing shGFP, suggesting that diminished growth inhibition by stable ZEB1 knockdown may be in part attributable to EpCAM up-regulation induced by the ZEB1 knockdown.
EpCAM is shown to be down-regulated by ZEB1 in breast cancer.20 We further confirmed this finding in MPM cells. Furthermore, during preparation of this article, Gemmill et al. performed genome-wide expression analysis of lung cancer cell lines and identified EpCAM as the gene whose expression most significantly negatively correlates with ZEB1 expression in non-small cell lung cancer cell lines.21 These findings suggest that EpCAM is a universal target of ZEB1, leading us to perform luciferase reporter assay to access the effects of ZEB1 knockdown on EpCAM promoter activity. We found that EpCAM promoter activity was increased by ZEB1 knockdown in H1299 cells, indicating that ZEB1 negatively regulates EpCAM expression by suppressing its promoter activity.
The dramatic growth inhibition by a transient ZEB1 knockdown in MPM cell lines suggests that a ZEB1-targeted therapy for MPM is promising. Nevertheless, we found that stable ZEB1 did not greatly suppress growth of MPM cells, in part as a result of EpCAM up-regulation. Thus, development of a therapeutic strategy that target ZEB1 must take into account the possibility that gene expression changes resulting from ZEB1 knockdown may counteract a ZEB1-targeted therapy. There are a few possible approaches to address this issue. One approach is to employ not a long-term but a short-term knockdown of ZEB1 because the transient ZEB1 knockdown suppressed growth of MPM cells. However, we observed that the transient ZEB1 knockdown also up-regulates EpCAM, raising the question of why the growth inhibitory effect of a transient ZEB1 knockdown was not affected by EpCAM up-regulation. We speculate that MPM cells may require a certain time period to switch their growth dependency from ZEB1 to EpCAM, and therefore transient EpCAM up-regulation does not greatly affect the growth inhibitory effects of the ZEB1 knockdown. Another approach is to target ZEB1 and EpCAM simultaneously on the basis of our finding that EpCAM knockdown efficiently suppresses growth in MPM cells where ZEB1 is stably suppressed.
Finally, targeting both ZEB1 and ZEB2, another member of the ZEB family genes, seems to be a promising therapeutic strategy for MPM because Gemmill et al. demonstrated that combinatorial knockdown of ZEB1 and ZEB2 more significantly reversed mesenchymal to epithelial phenotypes than either alone in lung cancer cells.21
In summary, our results showed that a transient ZEB1 knockdown suppressed growth of MPM cells, suggesting that it may serve as a promising therapeutic target. However, we also found that the growth suppressive effects of ZEB1 were reduced in a stable knockdown setting, which may be caused by EpCAM up-regulation and/or other gene expression changes.
Supplementary Material
ACKNOWLEDGMENT
We thank Drs. Thomas Brabletz for providing pSUPER.retro-ZEB1 and GFP vectors and Osamu Maeda for giving us technical advice on luciferase reporter assay. This work was supported by Grant-in-Aid for Scientific Research (C) 20590919 (to M.S.), Grant-in-Aid for Scientific Research (C) 20590918 (to M.K.), and Grant-in-Aid for Scientific Research (B) 21390257 (to Y.H.) from the Japan Society for the Promotion of Science, Global COE program at Nagoya University Graduate School of Medicine, which is funded by Japan’s Ministry of Education, Culture, Sports, Science and Technology, NCI Special Program of Research Excellence in Lung Cancer (SPORE P50CA70907), and DOD PROSPECT (to J.D.M. and A.F.G.).
Footnotes
Electronic supplementary material The online version of this article (doi:10.1245/s10434-011-2142-0) contains supplementary material, which is available to authorized users.
REFERENCES
- 1.Robinson BW, Lake RA. Advances in malignant mesothelioma. N Engl J Med. 2005;353:1591–1603. doi: 10.1056/NEJMra050152. [DOI] [PubMed] [Google Scholar]
- 2.Tsao AS, Wistuba I, Roth JA, Kindler HL. Malignant pleural mesothelioma. J Clin Oncol. 2009;27:2081–2090. doi: 10.1200/JCO.2008.19.8523. [DOI] [PMC free article] [PubMed] [Google Scholar]
- 3.Voulgari A, Pintzas A. Epithelial-mesenchymal transition in cancer metastasis: mechanisms, markers and strategies to overcome drug resistance in the clinic. Biochim Biophys Acta. 2009;1796:75–90. doi: 10.1016/j.bbcan.2009.03.002. [DOI] [PubMed] [Google Scholar]
- 4.Schramm A, Opitz I, Thies S, et al. Prognostic significance of epithelial–mesenchymal transition in malignant pleural mesothelioma. Eur J Cardiothorac Surg. 2010;37:566–572. doi: 10.1016/j.ejcts.2009.08.027. [DOI] [PubMed] [Google Scholar]
- 5.Peinado H, Olmeda D, Cano A. Snail, Zeb and bHLH factors in tumour progression: an alliance against the epithelial phenotype? Nat Rev Cancer. 2007;7:415–428. doi: 10.1038/nrc2131. [DOI] [PubMed] [Google Scholar]
- 6.Schmalhofer O, Brabletz S, Brabletz T. E-cadherin, beta-catenin, and ZEB1 in malignant progression of cancer. Cancer Metastasis Rev. 2009;28:151–166. doi: 10.1007/s10555-008-9179-y. [DOI] [PubMed] [Google Scholar]
- 7.Takeyama Y, Sato M, Horio M, et al. Knockdown of ZEB1, a master epithelial-to-mesenchymal transition (EMT) gene, suppresses anchorage-independent cell growth of lung cancer cells. Cancer Lett. 2010;296:216–224. doi: 10.1016/j.canlet.2010.04.008. [DOI] [PMC free article] [PubMed] [Google Scholar]
- 8.Usami N, Fukui T, Kondo M, et al. Establishment and characterization of four malignant pleural mesothelioma cell lines from Japanese patients. Cancer Sci. 2006;97:387–394. doi: 10.1111/j.1349-7006.2006.00184.x. [DOI] [PMC free article] [PubMed] [Google Scholar]
- 9.Ke Y, Reddel RR, Gerwin BI, et al. Establishment of a human in vitro mesothelial cell model system for investigating mechanisms of asbestos-induced mesothelioma. Am J Pathol. 1989;134:979–991. [PMC free article] [PubMed] [Google Scholar]
- 10.Sato M, Vaughan MB, Girard L, et al. Multiple oncogenic changes (K-RAS(V12), p53 knockdown, mutant EGFRs, p16 bypass, telomerase) are not sufficient to confer a full malignant phenotype on human bronchial epithelial cells. Cancer Res. 2006;66:2116–2128. doi: 10.1158/0008-5472.CAN-05-2521. [DOI] [PubMed] [Google Scholar]
- 11.Spaderna S, Schmalhofer O, Wahlbuhl M, et al. The transcriptional repressor ZEB1 promotes metastasis and loss of cell polarity in cancer. Cancer Res. 2008;68:537–544. doi: 10.1158/0008-5472.CAN-07-5682. [DOI] [PubMed] [Google Scholar]
- 12.Eger A, Aigner K, Sonderegger S, et al. DeltaEF1 is a transcriptional repressor of E-cadherin and regulates epithelial plasticity in breast cancer cells. Oncogene. 2005;24:2375–2385. doi: 10.1038/sj.onc.1208429. [DOI] [PubMed] [Google Scholar]
- 13.Tsou JA, Shen LY, Siegmund KD, et al. Distinct DNA methylation profiles in malignant mesothelioma, lung adenocarcinoma, and non-tumor lung. Lung Cancer. 2005;47:193–204. doi: 10.1016/j.lungcan.2004.08.003. [DOI] [PubMed] [Google Scholar]
- 14.Sunaga N, Miyajima K, Suzuki M, et al. Different roles for caveolin-1 in the development of non–small cell lung cancer versus small cell lung cancer. Cancer Res. 2004;64:4277–4285. doi: 10.1158/0008-5472.CAN-03-3941. [DOI] [PubMed] [Google Scholar]
- 15.Sunaga N, Shames DS, Girard L, et al. Knockdown of oncogenic KRAS in non-small cell lung cancers suppresses tumor growth and sensitizes tumor cells to targeted therapy. Mol Cancer Ther. 2011;10:336–346. doi: 10.1158/1535-7163.MCT-10-0750. [DOI] [PMC free article] [PubMed] [Google Scholar]
- 16.Iwanaga K, Yang Y, Raso MG, et al. Pten inactivation accelerates oncogenic K-ras-initiated tumorigenesis in a mouse model of lung cancer. Cancer Res. 2008;68:1119–1127. doi: 10.1158/0008-5472.CAN-07-3117. [DOI] [PMC free article] [PubMed] [Google Scholar]
- 17.Munz M, Kieu C, Mack B, Schmitt B, Zeidler R, Gires O. The carcinoma-associated antigen EpCAM upregulates c-myc and induces cell proliferation. Oncogene. 2004;23:5748–5758. doi: 10.1038/sj.onc.1207610. [DOI] [PubMed] [Google Scholar]
- 18.Osta WA, Chen Y, Mikhitarian K, et al. EpCAM is overexpressed in breast cancer and is a potential target for breast cancer gene therapy. Cancer Res. 2004;64:5818–5824. doi: 10.1158/0008-5472.CAN-04-0754. [DOI] [PubMed] [Google Scholar]
- 19.Hase T, Sato M, Yoshida K, et al. Pivotal role of epithelial cell adhesion molecule in the survival of lung cancer cells. Cancer Sci. 2011;102:1493–1500. doi: 10.1111/j.1349-7006.2011.01973.x. [DOI] [PMC free article] [PubMed] [Google Scholar]
- 20.Aigner K, Dampier B, Descovich L, et al. The transcription factor ZEB1 (deltaEF1) promotes tumour cell dedifferentiation by repressing master regulators of epithelial polarity. Oncogene. 2007;26:6979–6988. doi: 10.1038/sj.onc.1210508. [DOI] [PMC free article] [PubMed] [Google Scholar]
- 21.Gemmill RM, Roche J, Potiron VA, et al. ZEB1-responsive genes in non-small cell lung cancer. Cancer Lett. 2011;300:66–78. doi: 10.1016/j.canlet.2010.09.007. [DOI] [PMC free article] [PubMed] [Google Scholar]
Associated Data
This section collects any data citations, data availability statements, or supplementary materials included in this article.


