

Abstract
Study Objectives:
To determine if the large and highly reproducible interindividual differences in rates of performance deficit accumulation during sleep deprivation, as determined by the number of lapses on a sustained reaction time test, the Psychomotor Vigilance Task (PVT), arise from a heritable trait.
Design:
Prospective, observational cohort study.
Setting:
Academic medical center.
Participants:
There were 59 monozygotic (mean age 29.2 ± 6.8 [SD] yr; 15 male and 44 female pairs) and 41 dizygotic (mean age 26.6 ± 7.6 yr; 15 male and 26 female pairs) same-sex twin pairs with a normal polysomnogram.
Interventions:
Thirty-eight hr of monitored, continuous sleep deprivation.
Measurements and Results:
Patients performed the 10-min PVT every 2 hr during the sleep deprivation protocol. The primary outcome was change from baseline in square root transformed total lapses (response time ≥ 500 ms) per trial. Patient-specific linear rates of performance deficit accumulation were separated from circadian effects using multiple linear regression. Using the classic approach to assess heritability, the intraclass correlation coefficients for accumulating deficits resulted in a broad sense heritability (h2) estimate of 0.834. The mean within-pair and among-pair heritability estimates determined by analysis of variance-based methods was 0.715. When variance components of mixed-effect multilevel models were estimated by maximum likelihood estimation and used to determine the proportions of phenotypic variance explained by genetic and nongenetic factors, 51.1% (standard error = 8.4%, P < 0.0001) of twin variance was attributed to combined additive and dominance genetic effects.
Conclusion:
Genetic factors explain a large fraction of interindividual variance among rates of performance deficit accumulations on PVT during sleep deprivation.
Citation:
Kuna ST; Maislin G; Pack FM; Staley B; Hachadoorian R; Coccaro EF; Pack AI. Heritability of performance deficit accumulation during acute sleep deprivation in twins. SLEEP 2012;35(9):1223-1233.
Keywords: Sleep homeostasis, sleep deprivation, twins
INTRODUCTION
Sleep deprivation is a major public health issue.1 It impairs neurobehavioral performance, particularly performance requiring sustained attention.2 Individuals who are sleep deprived are at increased risk of motor vehicle accidents and job-related injuries.3 The effect of acute sleep deprivation on performance has been assessed experimentally using the Psychomotor Vigilance Task (PVT).4 The PVT evaluates response times (RTs) to repeated stimuli presented at random intervals. Individuals who have increased pressure for sleep have wake-state instability and hence may not respond to the stimulus or do so in a tardy manner. The mean number of lapses (RTs greater than 500 msec) on this sustained attention task has been shown to be sensitive to the effect of sleep loss.5–8 There are, however, large interindividual differences in sustained attention task performance during acute sleep deprivation.9,10 Some individuals show few lapses in performance whereas others show a large number of lapses. Repeat testing in the same individual indicates that this differential response is a subject-specific biologic trait. In duplicate trials of sleep deprivation in the same individual, Van Dongen et al.10 found that the number of lapses was highly reproducible with an intraclass correlation coefficient of 0.675.
The progressive increase in performance lapses on PVT during acute sleep deprivation is a surrogate measure for sleep homeostatic drive, i.e., the rate of accumulation of the pressure for sleep during wakefulness. Franken et al. have demonstrated the heritability of sleep homeostatic drive in mice.11 Electroencephalographic (EEG) delta power (1-4 Hz) during recovery sleep after 6 hr of sleep deprivation, a key measure of sleep homeostatic drive, was very different between different inbred strains, but highly reproducible within a strain. Previous studies in human twins have demonstrated that slow wave sleep and delta power are under a strong genetic influence.12,13 Extending these findings, DeGenarro et al.14 recently measured EEG activity in the 8-16 Hz range in 10 monozygotic (MZ) and 10 dizygotic (DZ) twin pairs during baseline and recovery nonrapid eye movement (NREM) sleep after prolonged wakefulness and found high heritability, both at baseline and after sleep deprivation. They did not, however, examine changes in EEG power and in particular in delta power that would be required to assess sleep homeostasis. Hence, they did not assess this key aspect of the phenotype. Although there is evidence of heritability of sleep homeostatic drive in mice, no previous studies have investigated whether this trait is heritable in humans.
To assess whether the rate of performance decrement during acute sleep deprivation, i.e. sleep homeostatic drive, is a heritable trait in humans, we measured the increase in performance lapses on PVT during 38 hr of continuous wakefulness in 59 MZ and 41 DZ twin pairs. Some recent studies report that polymorphisms in the PERIOD 3 (PER3) and adenosine deaminase (ADA) genes explain phenotypic variance in responses to total sleep deprivation.15–19 However, findings inconsistent with the PER3 results have been reported in individuals subjected to partial sleep deprivation.20 To further evaluate the possible association between PER3 and ADA polymorphisms and the response to sleep deprivation, we compared the PER3 and ADA genotypes of our patients with their performance decrement during the 38 hr of continuous wakefulness.
METHODS
Participant Recruitment
We screened 358 individuals by telephone from two existing registries (Penn Twins Cohort and Mid-Atlantic Twins Registry) and from local advertisements in Philadelphia and the surrounding metropolitan area. Participants were required to be 18 to 55 yr of age and have a same-sex twin who was also willing and eligible to participate. Twin zygosity was determined initially by a standardized questionnaire and then checked by a DNA-based polymerase chain reaction (PCR) analysis of peripheral blood using 12 highly polymorphic short-tandem repeat loci and Amelogenin.21 Thirty-three twin pairs were excluded because one or both individuals met at least one of the exclusion criteria (see next section). Twenty-five potentially eligible twin pairs were excluded because they cancelled or did not keep their first scheduled visit. Twenty pairs withdrew from the study after enrollment, primarily because of an inability to devote the required time. A total of 59 MZ twin pairs (mean age 29.2 ± 6.8 (standard deviation, SD) yr; range 18 to 42 yr; 15 male and 44 female pairs) and 41 DZ twin pairs (mean age 26.6 ± 7.6 yr; range 19 to 53 yr, 15 male and 26 female pairs) completed the entire protocol. The study was approved by the Institutional Review Boards at the University of Pennsylvania and the subcontracted sites where the two twin registries were based, the University of Chicago and Virginia Commonwealth University. Written informed consent was obtained from each participant. All testing was performed at the University of Pennsylvania.
Exclusion Criteria
Exclusion criteria included an apnea-hypopnea index or periodic limb movement index ≥ 5 events/hr on a full night diagnostic polysomnogram (PSG), the presence of depression as indicated by a score > 16 on the Center for Epidemiological Studies Depression Scale (CES-D),22 irregular work hr or shift work, consumption of 2 or more alcoholic drinks per day as assessed with the CAGE questionnaire,23,24 use of sedative/hypnotic medications on a regular basis, initiation of a new medication in the previous 3 mo, a medical or neurologic condition that would prevent traveling to the sleep center, previous diagnosis of obstructive sleep apnea or any other sleep disorder, travel across a different time zone in the previous 6 wk, blood hemoglobin < 11.3 gm/dl, serum bilirubin > 2.0 mg/dl, serum creatinine > 3 mg/dl, or a positive urine toxicology screening. Individuals were excluded if they were taking the following medications: methylphenidate, modafinil, antidepressants, or beta-blockers. They were also excluded if they were taking medications for pain, including aspirin, nonsteroidal anti-inflammatory drugs, and COX-2 inhibitors, more than 3 times per wk.
Initial Evaluation
At least 2 wk prior to performing the sleep deprivation protocol, participants were admitted to the Clinical and Translational Research Center for one night to assess their eligibility. During this stay, they underwent a medical history and physical examination and completed a battery of standardized questionnaires including the 36-Item Short Form (SF-36),25 Functional Outcomes of Sleep Questionnaire (FOSQ),26 Basic Language Morningness (BALM) scale,27 Multivariable Apnea Prediction (MAP) scale,28 Epworth Sleepiness Scale (ESS),29 Pittsburgh Sleep Quality Index (PSQI),30 CES-D,22 and CAGE.23,24 They also performed an overnight PSG to rule out sleep apnea and periodic limb movement disorder. The following polysomnographic signals were recorded: EEG (C3M2, C4M1, O1M2, O2M1), bilateral electrooculograms, chin muscle electromyogram, airflow (nasal pressure and oronasal thermistor), rib cage and abdominal movement, bilateral anterior tibialis electromyogram, electrocardiogram, pulse oximetry, and body position. The PSGs obtained during this initial assessment and the subsequent admission for the sleep deprivation protocol were scored manually with the aid of computer software by a registered PSG technologist using American Academy of Sleep Medicine (AASM) recommended criteria.31 The technologist was blinded to the participant and the participant's zygosity. Female participants were studied during the nonmenstruating phases of their menstrual cycle.
Sleep Deprivation Protocol
Patients were instructed to maintain a regular sleep/wake schedule in the week prior to the sleep deprivation protocol and completed a sleep log and wore a wrist actigraph (AMI Ambulatory Monitoring, Inc., Minimotion logger, Ardsley, NY) during that week to document their compliance. The actigraph recordings were manually scored with the aid of the sleep log and computer software.
The sleep deprivation protocol consisted of admission to the Clinical and Translational Research Center for 4.5 consecutive days. The patients were asked not to smoke or drink alcohol for 24 hr prior to and during their admission. During the 4-day protocol, they were given regular food and snacks but were not allowed to drink caffeinated beverages. Participants were allowed to sleep ad libitum on Days 1 and 2 to further ensure they were sleep satiated prior to start of sleep deprivation. They performed 4 orientation PVT trials on Day 2 that were not used in the analyses. PSGs were performed on the first two nights. At 08:00 on Day 3, participants began a 38-hr sleep deprivation protocol during which they performed the 10-min PVT at 2-hr intervals (19 sessions) starting at 10:00. The participants were under continuous surveillance by a trained research assistant during the sleep deprivation period. The participants were allowed to walk around the research unit but were not allowed to leave the unit. They spent the time watching videos, studying, reading, and playing games. They were not allowed to use the telephone, read newspapers, or watch TV in order to avoid any extraneous environmental influences on their results. A recovery sleep opportunity that was recorded polysomnographically started at 22:00 on Day 4. Patients were allowed to sleep undisturbed until they woke up spontaneously the next morning. Following the recovery sleep, they were evaluated by a member of the research team, discharged, and told not to drive a motor vehicle for the next 24 hr. Travel arrangements were made to transport the patients home to avoid issues related to residual sleepiness. Individuals in each twin pair were studied on different days to prevent their social interaction during the sleep deprivation protocol. The twin who was studied first was instructed not to share his/her experience with the other twin until that person had completed testing. The following signals were recorded on the PSGs on Days 1, 2, and 4 of the sleep deprivation protocol: EEG (C3M2, C4M1, O1M2, O2M1), bilateral electooculogram, and chin muscle electromyogram.
Psychomotor Vigilance Task
The PVT is a conceptually valid, reliable, 10-min task with known psychometric properties and minimal practice/learning curves.4,5,7 The PVT yields a number of metrics reflecting the capacity for sustained attention and vigilance performance and is highly sensitive to behavioral alertness.6,32 The primary PVT variable used to assess heritability of sleep drive was the number of RTs per trial that were at least 500 msec (lapses). This variable is approximately distributed according to a Poisson process. Because the variance of a Poisson process is proportional to its mean value, a variance-stabilizing transformation was applied in the form of the sum of the square root of the number of lapses plus the square root of this number of lapses plus 1. This sum of square roots is hereafter referred to as ‘transformed lapses’ and was the primary phenotype endpoint in this study.
A multiple linear regression model that included terms reflecting linear changes over the 38- hr extended wake period plus a superimposed sinusoidal circadian rhythm effect with frequency fixed at 24 hr was estimated for each patient. The following equation describes this model:
where ΔYit is the change in the value of the PVT parameter from the first time point to time = t for patient i. The use of change scores reduced the number of fixed effects to be estimated by one. This was appropriate because baseline lapses per trial are nearly zero in healthy volunteers and do not discriminate among healthy individuals unless challenged by sleep deprivation. The parameter of interest was βi1, the patient-specific average change (i.e., slope) in performance deficits during sleep deprivation. The hypothesis for this study was that that the βi1 terms would tend to be more similar among MZ pairs than DZ pairs. Additionally, supporting analyses were performed on three other PVT metrics including median RT, mean of the 10% fastest RTs, and the mean reciprocal RT for the 10% slowest response times. These metrics are meant to reflect the different response subdomains of the RT distribution. These three are designed to reflect average response, optimum response, and RT in the response-slowing domain, respectively. Analyses were also performed on the mean of untransformed lapses over the last 12 trials during sleep deprivation in order to compare our intraclass correlation coefficient (ICC) results in twins with those of Van Dongen et al.10 based on test-retest results within the same patient.
PER3 and ADA Single-Nucleotide Polymorphisms
The assessment of the polymorphisms of PER3 and ADA genes was performed as described previously.15,19 Briefly, the genotyping was performed by the PCR and carried out in a volume of 50 μl containing the following: 50-100 ng of DNA, 5 units of TaqGold polymerase (Applied Biosystems), 1.5 mM MgCl2, 2.5 mM of each triphosphate, and 25 μM of each forward and reverse primer. The following primers were used in PER3 genotyping:
PER3 forward:
5'-CAAAATTTTATGACACTACCAGAATGGCTGAC-3'
PER3 reverse:
5'-AACCTTGTACTTCCACATCAGTGCCTGG-3'
The following primers were used in ADA genotyping:
ADA-forward, A-specific allele (ADA-F-A):
5'-CCCAGACGCCCGCCTTCA-3'
ADA-forward, G-specific alele (ADA-F-G):
5'-CCCAGACGCCCGCCTTCG-3'
ADA-reverse (common to both alleles):
5'-GAACTCGCCTGCAGGAGCC-3
The PCR conditions for the PER3 genotyping included: denaturation at 94°C for 1 min, annealing at 55°C for 1 min, elongation at 72°C for 1 min, 35 cycles. The PCR conditions for the ADA genotyping were denaturation at 94°C for 1 min, annealing at 61°C for 1 min, and elongation at 72°C for 1 min, 35 cycles. The PCR products were separated on 2% agarose gel by electrophoresis followed by staining with ethidium bromide.
Statistical Analyses
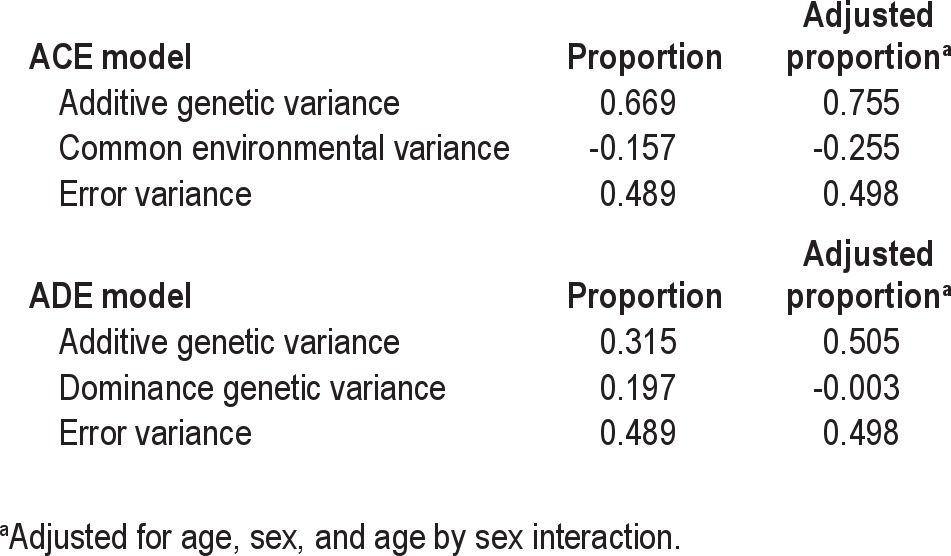
Mixed-model analysis of variance (ANOVA) was used to compare characteristics between MZ and DZ twins accounting for zygosity differences in covariance. This and all subsequent modeling was performed using SAS Version 9.2 (SAS Institute, Inc., Cary, NC). Three complementary methods were used to evaluate heritability: the classic approach based on zygosity differences in ICC,33 ANOVA,34 and maximum likelihood estimation of model-specific covariance matrices.35 First, descriptive heritability estimates were obtained as h2 = 2(ICCMZ – ICCDZ).33 Initial descriptive assessments of common environment shared variance were determined using the formula C2 = 2*ICCDZ - ICCMZ. Negative values of C2 suggest that shared common environment is not an important factor in explaining within-pair correlation and, in those situations, the ADE model rather than the ACE model is the preferred model of genetic transmission (see discussion of models in the next section).36 These analyses were performed with and without controlling for sex, age, and sex by age interaction.37 ANOVA methods based on functions of within- and among-twin pair mean squares were used to assess validity of the twin model for our data.34 Primary results were obtained by using maximum likelihood estimation to determine variance components from mixed-effect multilevel models (MEMA-VCM).35 This approach produces the same covariance expectations as path analysis and structural equation modeling with the exception that variances are not restricted to be positive; thus providing an opportunity to identify poor model fit.38 Using these methods, we assessed the different models with the objective of discriminating between different patterns of genetic transmission. One model examined was the ACE model, which includes additive genetic effects (A), common environmental effects (C), and unique individual effects (E). Another model—the ADE model—includes additive genetic effects (A), dominance genetic effects (D), and unique individual effects (E). Following McArdle and Prescott,35 the ACE and ADE models were formulated by including additive genetic variance (σ2A), variance arising from dominance effects (σ2D), family-specific variance (σ2C), and unique variance (σ2A) into the model as random effects. These random effects were either shared or not shared between twin members and were weighted according to zygosity35 to produce the desired variance components of the MEMA-VCM models using SAS Proc Mixed (SAS Institute, Inc., Cary NC). Then, these parameters were reestimated using the general purpose nonlinear mixed model algorithm in Proc NLMIXED to obtain P values and standard errors for desired functions of the various components. Although the parameter estimates are identical, Proc NLMIXED provides asymptotic standard errors for the proportions of phenotypic variance explained by A+D, A alone, and D alone as well as P values for testing null hypotheses that each proportion is equal to zero assuming the ADE model is true.
RESULTS
The characteristics of the participants are detailed in Table 1. A greater percentage of DZ twin pairs reported being African American (n = 15 pairs; 36.6%) compared with MZ twin pairs (n = 7; 11.9%). There were 3 Asian MZ pairs and no Asian DZ pairs. There was one MZ pair who self-identified as having more than 1 race. There were 48 Caucasian MZ pairs (81.5%) and 26 Caucasian DZ pairs (63.4%). In the week prior to the sleep deprivation protocol, the mean estimated daily sleep time on actigraphy was 528 ± 103 (SD) min in the MZ twins and 502 ± 101 min in the DZ twins. This difference was not significant based on a mixed model that accounted for unequal within-group correlations (P = 0.11). Mean estimated daily sleep time was similar in males and females (507 ± 102 and 521 ± 103 min, respectively).
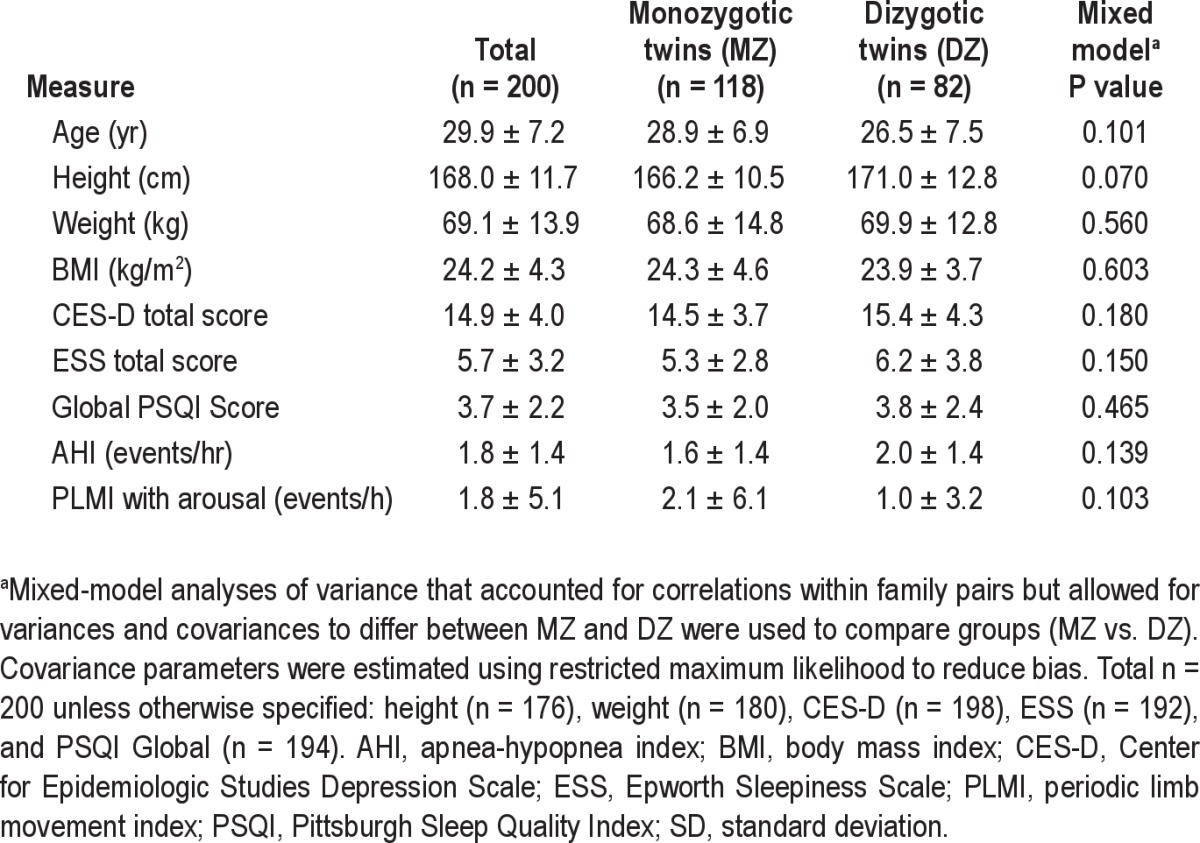
Table 1.
Mean ± SD of participant characteristics
The polysomnographic results in the MZ and DZ twins on Day 2, i.e., just prior to the start of the 38-hr sleep deprivation, are shown in Table 2. Compared with MZ twins, DZ twins had a greater total time in stage N2 sleep (P = 0.016), and latency to stage REM (P = 0.040). As reported by previous investigators, sleep architecture measures displayed strong broad sense heritability (h2)13,14,37 (Table 3).
Table 2.
Mean ± SD of polysomnogram results on the night prior to the start of the 38-hr sleep deprivation

Table 3.
Intraclass correlation coefficients and h2 value for polysomnographic measures obtained on the night prior to the sleep deprivation period with and without adjustment for age and sex
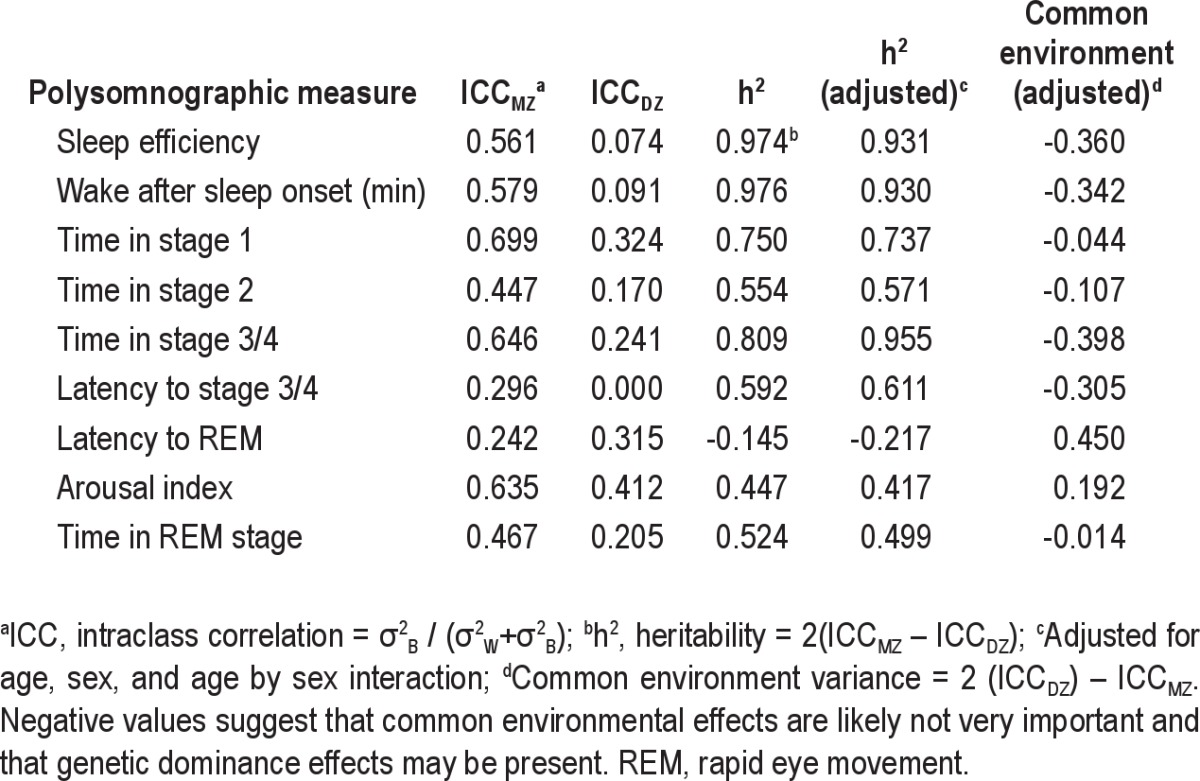
Figure 1 shows the mean change in transformed PVT lapses on the trials performed every 2 hr during the 38-hr sleep deprivation period in all MZ and DZ twins using the results on the first trial at 2 hr as the reference. The results reveal the combined homeostatic and circadian effects on PVT performance as assessed by lapses. The progressive increase in the number of lapses per trial in both groups starting after 14 hr of sleep deprivation (22:00) reflects the increasing homeostatic drive to sleep. The plateau in the change in lapses following 24 hr of sleep deprivation (i.e., at 08:00) and the subsequent decrease in the last several trials reflects the effects of a circadian signal for alertness superimposed on the increasing homeostatic drive to sleep.
Figure 1.
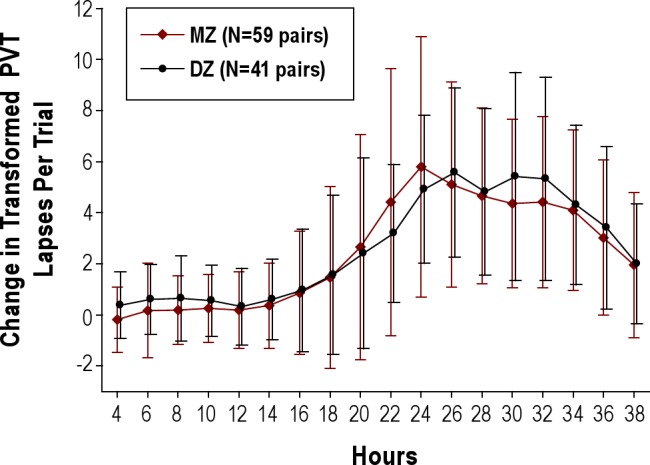
Mean ± standard deviation change in transformed Psychomotor Vigilance Task (PVT) lapses on the trials performed every 2 hr during the 38-hr sleep deprivation period in the monozygotic (MZ, open diamond) and dizygotic (DZ, closed circle) twin pairs. Results on the 1st trial at 2 hr were used as the reference. See text for details.
Analysis of Genetic Effects on the Mean Change in Transformed PVT Lapses
The individual linear slopes of the change in PVT-transformed lapses accounting for circadian effects over the period of extended wakefulness in the MZ and DZ twin pairs are shown in Figure 2. The panels reveal a substantial range of responses to sleep deprivation as previously reported.10 A greater similarity of results within MZ twin pairs than within DZ twin pairs is visually apparent.
Figure 2.

The individual linear slopes of the change in Psychomotor Vigilance Task (PVT) transformed lapses during the sleep deprivation period in the monozygotic (MZ, left panel) and dizygotic (DZ, right panel) twin pairs. Data for each MZ and DZ twin pair are plotted together on the abscissa. In each panel, the pairs are ordered by the magnitude of their impairment (averaged over each pair), with the most resistant twin pair on the left and the most vulnerable twin pair on the right. The panels reveal substantial differences in individual responses to sleep deprivation. As is visually apparent, the intraclass correlation revealed greater similarity within MZ twin pairs than within DZ twin pairs. There was 56.2% of the total variance in the MZ twins that was due to variance between pairs whereas only 14.5% of the total variance in DZ twins was due to variance between pairs. ICC, intraclass correlation.
The ICCs of the linear slopes of the change in transformed PVT lapses and other PVT outcome measures in the MZ and DZ twins are shown in Table 4. There was 85.5% of the total variance in PVT transformed lapses in DZ twins that was due to variance within pairs, whereas only 43.8% of the total variance in the MZ twins was due to variance within pairs. The heritability value (h2) for the linear slopes of the change in transformed PVT lapses was 0.836. Heritability estimates were generally similar for males and females. Heritability of other measures from the PVT ranged from 0.374 to 0.70 (Table 4).
Table 4.
Intraclass correlation coefficients for PVT measures over the 38-hr sleep deprivation in MZ and DZ twin pairs
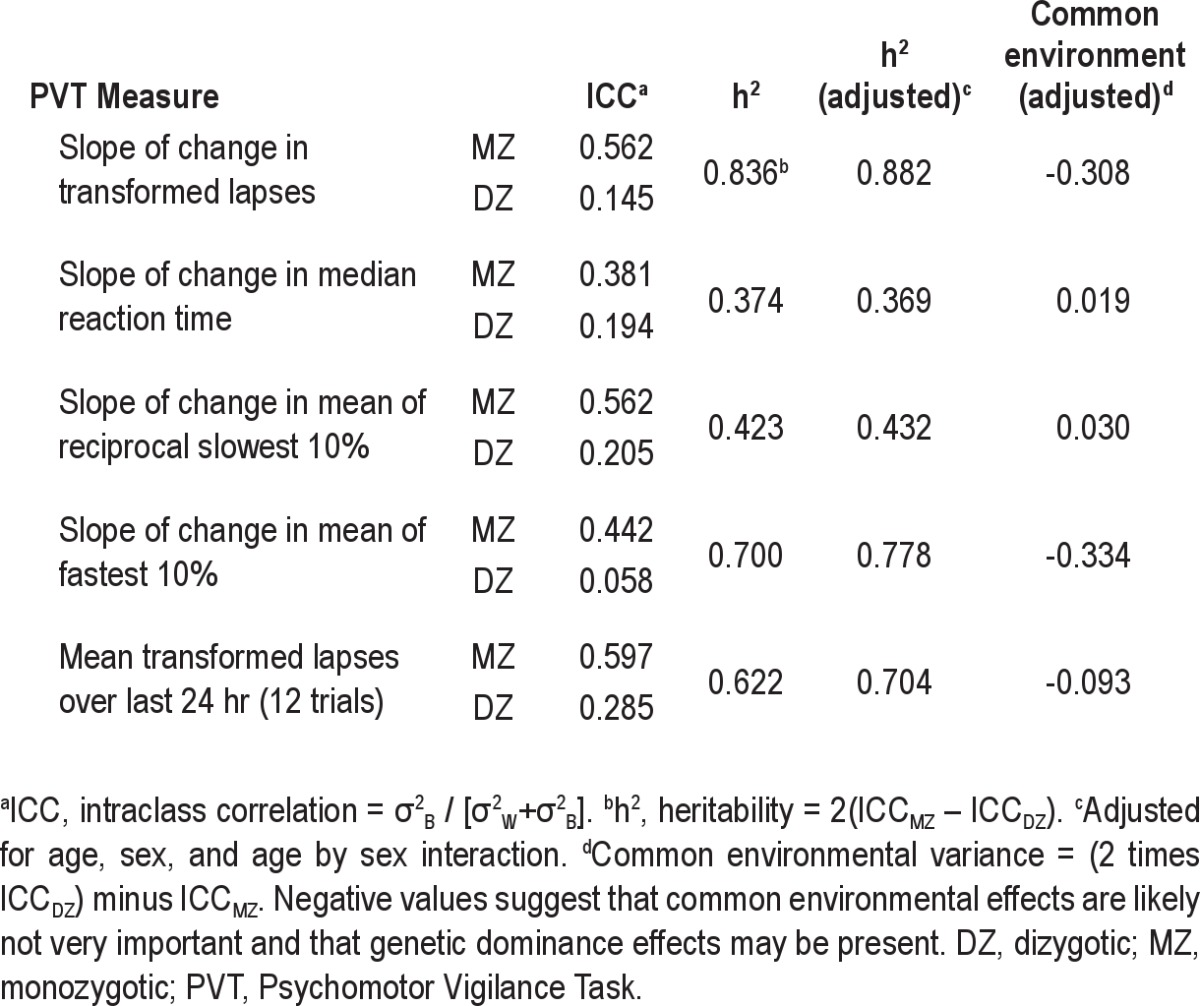
When a mixed-model ANOVA was used to filter out potential bias due to among-pair phenotypic differences in age and sex, estimates of heritability (h2) increased from 0.836 to 0.882 for the slope of the change in transformed lapses and also increased slightly for the other PVT outcome variables. The proportion of variance explained by common (shared) environment factors can be estimated using the equation 2(ICCDZ) – ICCMZ (Table 4). For slope of transformed lapses, this value was equal to −0.308 based on age- and sex-adjusted heritability. The negative value supports a genetic transmission model that includes dominance effects rather than common environmental effects.37
When the slopes were subjected to heritability analysis using the ANOVA approach,34 there was no significant difference in mean values between MZ and DZ (t(96) = −1.06, P = 0.29). Furthermore, the variance of within-twin means did not vary between MZ and DZ (F(40,58) = 1.19, P = 0.54). An essential assumption in the analysis of twins data is that total phenotype variance is the same for MZ and DZ. There was no evidence of zygosity differences in total phenotype variance (P = 0.67) using ANOVA. The average of the estimate of heritability was 0.715, similar to the classic approach value of h2 = 0.836 reported previously.
Finally, the slopes of the change in transformed lapses were used to estimate parameters of alternative genetic transmission models based on maximum likelihood estimation (Table 5).35 This analysis confirmed the ICC-based analysis; that is, there is no evidence that common environmental factors contributed significantly to the phenotypic variance. This is not surprising because the PVT was designed to reflect intrinsic neurologic functional ability and to be relatively uninfluenced by extrinsic factors that are shared between the twins. The estimated common environmental variance in the ACE model was negative. Given this finding and the large negative value of common environment variance derived from ICC analysis, we focused on the parameter estimates from the ADE model. In the ADE model, the additive genetic variance (A) explained 31.5% of phenotype variance, the dominance genetic variance (D) explained 19.7% of the variance, and the remainder was environmental variance (E) unique to the individual. Therefore, total variance due to genetic effects was 51.2%. When age, sex, and age by sex interaction were added to the model, the estimated dominance variance vanished and all genetic variance was additive (50.5%). This finding was further explored by reestimating the ADE using SAS Proc NLMIXED to obtain estimated standard errors for the quantities of interest. In the ADE model, the proportions, standard errors, and P values for A, D, and A+D were 0.197 (standard error [SE] = 0.767, P = 0.80), 0.315 (SE = 0.777, P = 0.69), and 0.511 (SE = 0.084, P < 0.0001), respectively. The fact that the SEs are very large relative to the estimated proportions for both A and D reflects that with the available sample sizes, it is difficult to partition total genetic variance into A and D. In contrast, the small SE for the proportion of variance explained by A+D with P < 0.0001 provides substantial evidence that an important fraction of phenotypic variance is explained by genetic transmission based on the twin model. In summary, these results provide substantial evidence (P < 0.0001) of overall genetic transmission that is associated with A or D or both, but with this dataset it is not possible to definitively conclude whether A or D is most important.
Table 5.
Maximum likelihood estimation of variance components from mixed-effects multilevel models for slope of transformed Psychomotor Vigilance Task lapses over 38 hr of total sleep deprivation.
Analysis of Genetic Effects on Secondary Phenotype Endpoints
The grand mean of transformed lapses over the last 24 hr (i.e., last 12 PVT trials) of the 38-hr sleep deprivation protocol was used by Van Dongen et al.10 in a study of normal patients who performed a sleep deprivation protocol similar to that of the current study on two separate occasions to assess whether the response varied between individuals but was stable within an individual. Using mixed-effect models to estimate test-retest ICC on the same individual, those authors found an ICC = 0.675. Using the mean of the past 24 hr (12 trials) in our study resulted in ICC values of 0.540 (MZ) and 0.157 (DZ) and an h2 = 0.766. Thus, the ICC in MZ twins is similar in magnitude to that for repeated trials in the same individual.
Heritability for the three secondary outcomes based on phenotype slopes were h2 = 0.770 for the mean of the 10% fastest RTs; h2 = 0.423 for the mean of the reciprocal 10% slowest RTs; and h2 = 0.374 for the median RT (Table 4). Heritability estimates were generally larger for phenotypes defined as slopes compared to grand means. The heritability estimates were generally similar for males and females (data not shown).
Heritability of Morningness-Eveningness
The Basic Language Morningness (BALM) questionnaire was used to obtain a quantitative assessment of self-report preference for morning versus evening.27 This instrument has a range from 13 (extreme preference for evening) to 55 (extreme preference for morning). The ICC values for MZ and DZ twins were 0.508 and 0.305, respectively, resulting in an h2 of 0.407. The value is still large but is less than half the value found for slope of transformed lapses (h2 = 0.836).
Association With PER3 and ADA Polymorphisms
Genotyping was performed in 180 patients (age 28.2 ± 7.2 yr; BMI 24.1 ± 41 kg/m2) in whom DNA samples were available. These included 42 MZ and 34 DZ twin pairs plus 3 individuals (1 MZ, 2 DZ). One patient of these 180 was missing PER3 genotype due to insufficient sample quantity and 3 patients were missing ADA genotype. Seventy-eight patients had the PER3 4/4 genotype, 79 had the PER3 4/5 genotype, and 22 had the PER3 5/5 genotype. The PER3 genotype frequencies were in Hardy-Weinberg equilibrium.39
Analyses using mixed-model repeated measures were used to compare among PER3 genotypes (PER3 5/5, PER3 4/5, and PER3 4/4) accounting for the difference in MZ and DZ within-pair covariance. Figures 3 and 4 summarize the analysis of the PER3 genotype/PVT phenotype association. There was no evidence that the PER3 gene explained variance in human vigilance responses to 38 hr of total sleep deprivation. Statistical significance of PER3 for explaining phenotypic variance was assessed for an additive model with genotype defined as the number of “5” type alleles (0, 1, 2); a model that assumed dominance for the 5-type allele coded as 1 if either allele was a 5-type and coded as zero otherwise; and an analogous model for “4” type dominance. The phenotype transmission model measure with the smallest P value was an additive model using the slope measure (P = 0.18) that was derived using a regression model accounting for both the homeostatic and circadian components. However, the estimated slope was −0.01226 (SE = 0.008122) such that increasing the number of “5” alleles reduced, rather than increased, the rate of accumulation of performance deficits.
Figure 3.
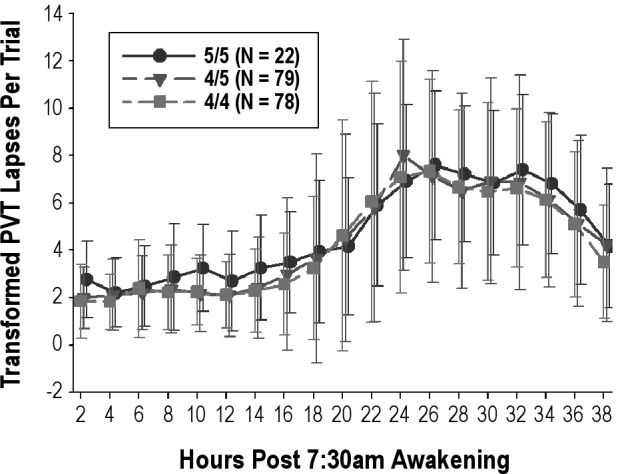
Mean ± SD change in transformed Psychomotor Vigilance Task (PVT) lapses on the trials performed every 2 hr during the 38-hr sleep deprivation period by PER3 genotype (5/5, 4/5, and 4/4). Results on the first trial at 2-hr were used as the reference. GT, genotype. See text for details.
Figure 4.
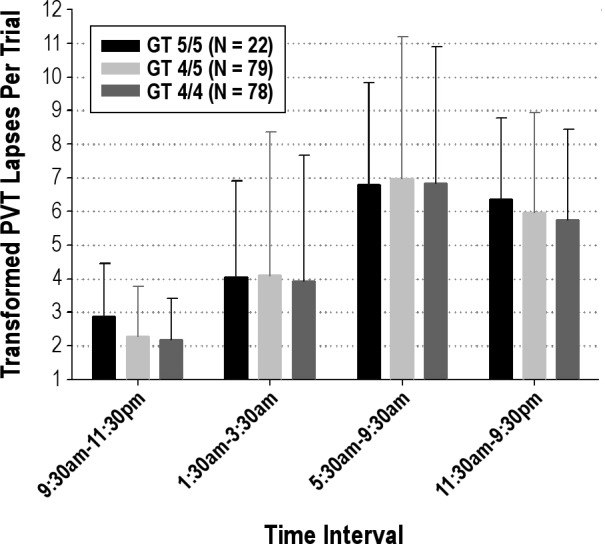
Mean ± standard deviation change in transformed PVT lapses during specific time periods by PER3 genotype (5/5, 4/5, and 4/4).
A similar analysis was used to assess evidence of PER3 association with baseline. Initially, the first trial during the deprivation, i.e., the trial used as baseline when comparing changes from baseline, was defined as baseline. The analysis was repeated using the mean of the first two, three, four, and five observations. Using only the first observation, the dominant 4 model was significant with F(1,135) = 4.93, P = 0.03, and mean difference equal to −0.77 (SE = 0.35). In the categorical model, mean baseline transformed lapses were signficantly lower for 4/4 versus 5/5 (P = 0.03) and for 4/5 versus 5/5 (P = 0.05). However, the significance of the dominant 4 model disappeared when baseline was defined as the mean of two (P = 0.16) or three (P = 0.47) or more observations.
For ADA, 151 patients had the ADA G/G genotype, 24 had the ADA A/G genotype, and 2 had the rare ADA A/A genotype. The rare A/A homozygote limited the ability to assess ADA genetic transmission models. Nonetheless, the ADA genotype frequencies were in Hardy-Weinberg equilibrium.39 Analyses using mixed-model repeated measures were used to compare among ADA genotypes accounting for the difference in MZ and DZ within-pair covariance. There was no evidence that variants in the ADA gene explained variance in human vigilance responses to 38 hr of total sleep deprivation. No differences were present in the slope of transformed lapses for the categorical model (P = 0.58), additive model (P = 0.38), and dominance model that compared AG+AA versus GG (P = 0.31). No association was present between ADA polymorphism and the transformed lapses on the first trial during the deprivation.
DISCUSSION
The results of this study in twins show that behavioral impairment produced by sleep deprivation is a highly heritable trait in humans. We found a strong heritable component to the decrements in PVT performance during continuous sleep deprivation. Over the 38-hr sleep deprivation period, MZ twins showed within-pair concordance in the rate of increase in performance lapses on PVT that was significantly higher than that of DZ twins. The concordance was close to that previously described for repeat trials in the same individual.10 Analysis of phenotypes by comparison of ICCs revealed a heritability (h2) of 0.836. A value was obtained using an ANOVA approach in which the average of the within-pair and between-pair estimates was equal to 0.715. Finally, maximum likelihood estimation of the ADE genetic transmission model resulted in an estimate of genetic heritability of 0.512. These results demonstrate for the first time the important influence of heritability on sleep homeostasis in humans.
Our study represents one of the largest comparisons of sleep architecture in MZ and DZ twins and supports previous reports that certain aspects of sleep architecture in humans are likely to be under genetic control.13,14,40–43 On the PSG performed on the night prior to the 38-hr sleep deprivation, we found broad sense heritability (h2) values of at least 0.499 for the following measures: duration of time in all stages of NREM and stage REM sleep, sleep efficiency, and wakefulness after sleep onset. Webb and Campbell44 recorded sleep in 14 MZ and 14 DZ twin pairs and found that sleep latency, awakening measures, stage changes, and REM amounts were more highly correlated in MZ than in DZ twins. Linkowski and colleagues41,42 performed 3 consecutive nights of overnight sleep EEG recordings in 11 MZ and 15 DZ twin pairs and showed that a significant portion of the variance in stages N2 and N4 sleep was genetically determined. Further studies in 35 MZ and 14 DZ twins revealed significant genetic influences for duration of stage N3 and REM sleep.40 DeGennaro et al.14 have recently shown that EEG frequencies between 8 and 16 Hz exhibit heritabilities as high as 96%, both during baseline sleep and in sleep after sleep deprivation, potentially making this one of the most heritable traits in humans.
With respect to response to sleep deprivation, Van Dongen et al.10 demonstrated that this response is a stable trait characteristic based on, among other measures, the mean number of (untransformed) lapses over PVT trials during the last 24 hr of a 38-hr sleep deprivation protocol. Using mixed-effect models to estimate test-retest ICC in the same individual, these authors found an ICC of 0.675. In comparison, the ICC among our MZ twin pairs for this measure was 0.540. In a mixed model that controlled for order and baseline, the test-retest ICC found by Van Dongen et al.10 was reduced to 0.611. In our analysis, adjusting for age and sex left the ICC nearly unchanged. Thus, that the ICC from a test-retest experiment on the same patient was only slightly larger than the ICC derived from two different albeit essentially genetically identical individuals, can be interpreted as support for the hypothesis that genetics plays a major role in explaining the phenotypic variance between individuals in this trait.
Heritability was assessed using three complementary approaches, the classic approach based in ICCs, the ANOVA approach based on within- and between-pair mean squares, and a modeling approach that requires estimation of parameters associated with a specified genetic transmission model. The use of multiple methods facilitates comparisons with earlier literature. More importantly, because these methods differ with regard to their assumptions, differences among results reveal possible violations of assumptions enabling a refinement of models used to obtain estimates. All three methods, however, led to the same conclusion, i.e., that heritability of the response to sleep deprivation is high. The classic approach's major advantage is its simplicity in computation. The classic approach is complemented by the ANOVA approach because the ANOVA approach includes assessments of the validity of the twins model as applied to the data at hand. The maximum likelihood approach allows the specification of various genetic transmission models and permits the computations of standard errors and P values.
These results in humans confirm the seminal study of Franken et al.11 that the response to sleep deprivation in mice is a highly heritable trait. Using recombinant inbreds between strains with different amounts of rebound of EEG delta power during recovery sleep after sleep deprivation, a quantitative trait locus for that trait that was genome-wide significant was identified on mouse chromosome 13.11 The locus accounted for 49% of the genetic variance in that trait. An in-silico analysis of the quantitative trait locus in mice identified a number of likely candidate genes.45 Currently, however, we do not know which gene variants are responsible for this trait.
In human studies, much attention has focused on polymorphisms of the clock gene, PER3. This gene is not in the quantitative trait locus found in mice. The major polymorphism in PER3 that has been investigated is different numbers of a tandem repeat in the coding region.46,47 Individuals can have either 4 repeats or 5 repeats.17 Previous studies, albeit with a very small sample size, reported that individuals with the 5/5 genotype (n = 10) had differences in sleep homeostasis compared with those with the 4/4 genotype (n = 15).15,16,48 In comparison with the 4/4 genotype, the 5/5 genotype had shorter slow latency; increased delta power; increased slow wave sleep and delta power following sleep deprivation; more inhibition of REM sleep rebound following sleep deprivation15; increased sympathatic activity during sleep deprivation as determined by assessment of heart rate variability48; and greater decrease in cognitive performance at a specific time of day, i.e., 2-4 hr after the peak of the melatonin rhythm.16 A separate report on another sample of 15 individuals with the 4/4 genotype and 12 with the 5/5 genotype found that there were regional differences in brain activation during an executive function test after sleep deprivation as assessed by functional MRI.49
Although our results showed that the mean transformed lapses for baseline defined as the first observation only was significantly lower for individuals with the PER3 4/4 versus 5/5 genotype, statistical significance dissipated when baseline was defined as mean of the first several morning trials. We also found no difference in the decrement in PVT performance during sleep deprivation between the 4/4 homozygotes, 4/5 heterozygotes, and the 5/5 homozygotes. Our results are in agreement with the report of Goel et al.20 who found no difference between 4/4 homozygotes (n = 52), 4/5 heterozygotes (n = 63) and 5/5 homozygotes (n = 14) in circadian phase, physiologic sleep structure or decreases in cognitive performance during chronic partial sleep loss. Goel et al.20 did find a slight difference in slow wave EEG activity between genotypes during chronic partial sleep deprivation.
We did not find an association between ADA genotypes and performance decrement in PVT performance during sleep deprivation. Ráetey et al.19 reported that the ADA gene is associated with interindividual variability in sleep architecture and the sleep EEG in a very small sample of normal patients.19 Slow wave sleep was longer and sleep was more intense in seven patients with the G/A genotype compared with seven patients with the G/G genotype. Bachmann et al.18 confirmed previous findings from their group but, in contrast with our findings, found that patients with the G/A genotype (n = 11) had a slower RT and produced more lapses on PVT than G/G genotype patients (n = 11) at baseline and throughout prolonged wakefulness. Their analysis did not separate the circadian effects on performance from homeostatic drive, as we have done.
The studies that indicated a difference in sleep homeostasis and performance decrements between individuals with these different PER3 and ADA genotypes had small sample sizes.15,16,18,19,48 As has been shown by Ioannidis et al.,50 genetic association studies with small samples often fail to replicate. Small studies can lead, therefore, not only to false- negative but also false-positive results. Ioannidis et al.50 in the report of genetic association studies found statistically significant discrepancies in a high proportion of genetic association studies (5 of 7 cases) when the sample size of the first publication was less than 150 cases/control individuals compared with 3 of 29 studies when the sample size was more than 150.
Our h2 value for responses on the BALM, a subjective morningness-eveningness questionnaire, was 0.407. These results are similar to those reported by previous investigators.51–53 Although the h2 value for the morningness-eveningness questionnaire was about half that of sleep homeostatic drive as we measured it, it cannot be inferred that heritability of the latent morningness-eveningness trait is also half that for homeostatic sleep drive. The questionnaire is not likely to be a perfect measure of the trait, thus diminishing apparent heritability. In addition, lower values for heritability of circadian phase would not be surprising because timing of sleep will be influenced by environmental factors related to the demands of normal life, whereas our studies of the change in performance during sleep deprivation sought to minimize environmental influences on this aspect of the phenotype.
Regarding the effect of PER3 phenotype on diurnal preference, we found a weak signal supporting that more five alleles were associated with more morningness. This was primarily driven by the homozygous 4/4. Some previous studies,54–57 but not all,58,59 report that the PER3 polymorphism predicts diurnal preference, such that the individuals homozygous for the long allele were more likely to be morning type. Our study adds further support to the association.
That sample sizes in human studies evaluating response to sleep deprivation are small is not surprising. Determining this phenotype is extremely expensive. In our own study it required initial detailed assessment of patients including an in-laboratory sleep study to rule out sleep disorders before patients conducted the study. The study protocol involved a total of almost 5 days in our laboratory. It is, therefore, not feasible to do this in the large number of patients, potentially 100s to 1000s, that are required to identify relevant gene variants in human studies. Given the demonstration of a major quantitative trait locus for sleep homeostasis in mice,11 an alternative strategy is to first study mice. New mouse resources such as the large panel of knockout mice,60 the Collaborative Cross project,61,62 and Diversity Outbred mice63 facilitate identifying the genetic basis for sleep homeostasis in mice.
Our study has potentially important occupational and clinical implications. Individuals who are sleep deprived are at increased risk of motor vehicle accidents and job-related injuries.64 Knowing the specific gene variants responsible for this differential vulnerability to sleep deprivation could be used in a genetic-based approach to personalized medicine – optimizing daytime function by tailoring the work and sleep schedules to the individual. Furthermore, we propose that our findings may help explain the differential vulnerability to excessive daytime sleepiness in patients with obstructive sleep apnea despite their having a similar severity of the disorder on polysomnographic testing.
In conclusion, our study shows that response to sleep deprivation in humans is a highly heritable trait. These results demonstrate, for this first time, the heritability of sleep homeostatic drive in humans. As reported by previous investigators, we found strong heritability of several polysomnographic measures related to latency to sleep stages and sleep stage duration. Weaker heritability was observed in diurnal preference. We did not find an association between the tandem repeat polymorphism of the PER3 gene or variants of the ADA gene and the rate of increase in performance lapses during sleep deprivation or diurnal preference. Further studies are required to identify the genetic basis for this highly heritable trait of increasing performance lapses with sleep deprivation.
DISCLOSURE STATEMENT
Dr. Kuna receives grant support from Philips-Respironics. Mr. Maislin is the owner of Biomedical Statistical Consulting Services. Dr. Coccaro is a member of the Scientific Advisory Board of Azevan Pharmaceuticals, Inc. and receives grant support from that company. Dr. Pack is The John L. Miclot Professor of Medicine at the University of Pennsylvania. Funds for this endowment were provided by the Philips-Respironics Foundation. The other authors have indicated no financial conflicts of interest.
ACKNOWLEDGMENTS
This study was supported by NIH P50 HL060287, P01 HL094307 and UL1RR024134 from the National Center for Research Resources. The content is solely the responsibility of the authors and does not necessarily represent the official views of the National Center for Research Resources or the National Institutes of Health. The Penn Twins Cohort and the MidAtlantic Twins Registry assisted in recruitment of the twin pairs. The contributions of Melissa Fernando, Michele Pliner, Marian Whitlock, and Colleen Crowley to the study are gratefully acknowledged and to Daniel Barrett for assistance in manuscript preparation.
Footnotes
A commentary on this article appears in this issue on page 1191.
REFERENCES
- 1.Colten HR, Altevogt BM, editors. Washington, DC: Institute of Medicine of the National Academies; 2006. Sleep disorders and sleep deprivation: an unmet public health problem. [PubMed] [Google Scholar]
- 2.Doran SM, Van Dongen HP, Dinges DF. Sustained attention performance during sleep deprivation: evidence of state instability. Arch Ital Biol. 2001;139:253–67. [PubMed] [Google Scholar]
- 3.Goel N, Rao H, Durmer JS, Dinges DF. Neurocognitive consequences of sleep deprivation. Semin Neurol. 2009;29:320–39. doi: 10.1055/s-0029-1237117. [DOI] [PMC free article] [PubMed] [Google Scholar]
- 4.Basner M, Dinges DF. Maximizing sensitivity of the psychomotor vigilance test (PVT) to sleep loss. Sleep. 2011;34:581–91. doi: 10.1093/sleep/34.5.581. [DOI] [PMC free article] [PubMed] [Google Scholar]
- 5.Dinges DF, Pack F, Williams K, et al. Cumulative sleepiness, mood disturbance, and psychomotor vigilance performance decrements during a week of sleep restricted to 4-5 hours per night. Sleep. 1997;20:267–7. [PubMed] [Google Scholar]
- 6.Powell NB, Riley RW, Schechtman KB, Blumen MB, Dinges DF, Guilleminault C. A comparative model: reaction time performance in sleep-disordered breathing versus alcohol-impaired controls. Laryngoscope. 1999;109:1648–54. doi: 10.1097/00005537-199910000-00019. [DOI] [PubMed] [Google Scholar]
- 7.Dinges DF, Powell J. Microcomputer analyses of performance on a portable, simple visual RT task during sustained operations. Beh Res Meth, Instru – Comp. 1985;17:652–5. [Google Scholar]
- 8.Lim J, Dinges DF. Sleep deprivation and vigilant attention. Ann N Y Acad Sci. 2008;1129:305–22. doi: 10.1196/annals.1417.002. [DOI] [PubMed] [Google Scholar]
- 9.Leproult R, Colecchia EF, Berardi AM, Stickgold R, Kosslyn SM, Van Cauter E. Individual differences in subjective and objective alertness during sleep deprivation are stable and unrelated. Am J Physiol Regul Integr Comp Physiol. 2003;284:R280–90. doi: 10.1152/ajpregu.00197.2002. [DOI] [PubMed] [Google Scholar]
- 10.Van Dongen HP, Baynard MD, Maislin G, Dinges DF. Systematic interindividual differences in neurobehavioral impairment from sleep loss: evidence of trait-like differential vulnerability. Sleep. 2004;27:423–33. [PubMed] [Google Scholar]
- 11.Franken P, Chollet D, Tafti M. The homeostatic regulation of sleep need is under genetic control. J Neurosci. 2001;21:2610–21. doi: 10.1523/JNEUROSCI.21-08-02610.2001. [DOI] [PMC free article] [PubMed] [Google Scholar]
- 12.van Beijsterveldt CEM, Molenaar PCM, de Geus EJC, Boomsma DI. Heritability of human brain functioning as assessed by electroencephalography. Am J Hum Genet. 1996;58:562–73. [PMC free article] [PubMed] [Google Scholar]
- 13.Watson NF. Genetics of electroenceophalography during wakefulenss and sleep. Sleep Med Clin. 2011;6:155–69. [Google Scholar]
- 14.De Gennaro L, Marzano C, Fratello F, et al. The electroencephalographic fingerprint of sleep is genetically determined: a twin study. Ann Neurol. 2008;64:455–60. doi: 10.1002/ana.21434. [DOI] [PubMed] [Google Scholar]
- 15.Viola AU, Archer SN, James LM, et al. PER3 polymorphism predicts sleep structure and waking performance. Curr Biol. 2007;17:613–8. doi: 10.1016/j.cub.2007.01.073. [DOI] [PubMed] [Google Scholar]
- 16.Groeger JA, Viola AU, Lo JC, von Schantz M, Archer SN, Dijk DJ. Early morning executive functioning during sleep deprivation is compromised by a PERIOD3 polymorphism. Sleep. 2008;31:1159–67. [PMC free article] [PubMed] [Google Scholar]
- 17.Dijk DJ, Archer SN. PERIOD3, circadian phenotypes, and sleep homeostasis. Sleep Med Rev. 2010;14:151–60. doi: 10.1016/j.smrv.2009.07.002. [DOI] [PubMed] [Google Scholar]
- 18.Bachmann V, Klaus F, Bodenmann S, et al. Functional ADA polymorphism increases sleep depth and reduces vigilant attention in humans. Cereb Cortex. 2012;22:962–70. doi: 10.1093/cercor/bhr173. [DOI] [PubMed] [Google Scholar]
- 19.Ráetey JV, Adam M, Honegger E, et al. A functional genetic variation of adenosine deaminase affects the duration and intensity of deep sleep in humans. Proc Natl Acad Sci U S A. 2005;102:15676–81. doi: 10.1073/pnas.0505414102. [DOI] [PMC free article] [PubMed] [Google Scholar]
- 20.Goel N, Banks S, Mignot E, Dinges DF. PER3 polymorphism predicts cumulative sleep homeostatic but not neurobehavioral changes to chronic partial sleep deprivation. PLoS ONE. 2009;4:e5874. doi: 10.1371/journal.pone.0005874. [DOI] [PMC free article] [PubMed] [Google Scholar]
- 21.Becker A, Busjahn A, Faulhaber HD, et al. Twin zygosity: automated determination with microsatellistes. J Reprod Med. 1997;42:260–6. [PubMed] [Google Scholar]
- 22.Radloff LS. The CES-D scale: a self-report depression scale for research in the general population. App Psychol Meas. 1977;1:385–401. [Google Scholar]
- 23.Liskow B, Campbell J, Nickel EJ, Powell BJ. Validity of the CAGE questionnaire in screening for alcohol dependence in a walk-in (triage) clinic. J Stud Alcohol. 1995;56:277–81. doi: 10.15288/jsa.1995.56.277. [DOI] [PubMed] [Google Scholar]
- 24.Mayfield D, McLeod G, Hall P. The CAGE questionnaire: validation of a new alcoholism screening instrument. Am J Psychiatry. 1974;131:1121–3. doi: 10.1176/ajp.131.10.1121. [DOI] [PubMed] [Google Scholar]
- 25.Ware JE, Jr, Snow KK, Kosinski M, Gandek B. Boston: The Health Institute, New England Medical Center; 1993. SF-36 health survey manual and interpretation guide. [Google Scholar]
- 26.Weaver TE, Laizner AM, Evans LK, et al. An instrument to measure functional status outcomes for disorders of excessive sleepiness. Sleep. 1997;20:835–43. [PubMed] [Google Scholar]
- 27.Brown FM. Psychometric equivalence of an improved Basic Language Morningness (BALM) Scale using industrial population within comparisons. Ergonomics. 1993;36:191–7. doi: 10.1080/00140139308967872. [DOI] [PubMed] [Google Scholar]
- 28.Maislin G, Pack AI, Kribbs NB, et al. A survey screen for prediction of apnea. Sleep. 1995;18:158–66. doi: 10.1093/sleep/18.3.158. [DOI] [PubMed] [Google Scholar]
- 29.Johns MW. A new method for measuring daytime sleepiness: the Epworth sleepiness scale. Sleep. 1991;14:540–5. doi: 10.1093/sleep/14.6.540. [DOI] [PubMed] [Google Scholar]
- 30.Buysse DJ, Reynolds CF, Monk TH, Berman SR, Kupfer DJ. The Pittsburgh Sleep Quality Index: a new instrument for psychiatric practice and research. Psychiatry Res. 1989;28:193–213. doi: 10.1016/0165-1781(89)90047-4. [DOI] [PubMed] [Google Scholar]
- 31.Iber C, Ancoli-Israel S, Chesson AL, Quan SF for the American Academy of Sleep Medicine. Westchester, IL: American Academy of Sleep Medicine; 2007. The AASM Manual for the Scoring of Sleep and Associated Events. [Google Scholar]
- 32.Smith-Coggins R, Rosekind MR, Buccino KR, Dinges DF, Moser RP. Rotating shiftwork schedules: can we enhance physician adaptation to night shifts? Acad Emerg Med. 1997;4:951–61. doi: 10.1111/j.1553-2712.1997.tb03658.x. [DOI] [PubMed] [Google Scholar]
- 33.Falconer DS, Mackay TFC. 4th ed. Harlow, United Kingdom: Addison Wesley Longman; 1996. Introduction to quantitive genetics. [Google Scholar]
- 34.Christian JC, Kang KW, Norton JA. Choice of an estimate of genetic variance from twin data. Am J Hum Genet. 1974;26:154–61. [PMC free article] [PubMed] [Google Scholar]
- 35.McArdle JJ, Prescott CA. Mixed effects variance components models for biometric family analyses. Behav Genet. 2005;35:631–52. doi: 10.1007/s10519-005-2868-1. [DOI] [PubMed] [Google Scholar]
- 36.Austin MA, Sandholzer C, Selby JV, Newman B, Krauss RM, Utermann G. Lipoprotein(a) in women twins: heritability and relationship to apolipoprotein(a) phenotypes. Am J Hum Genet. 1992;51:829–40. [PMC free article] [PubMed] [Google Scholar]
- 37.Heath AC, Kendler KS, Eaves LJ, Martin NG. Evidence for genetic influences on sleep disturbance and sleep patterns in twins. Sleep. 1990;13:318–35. doi: 10.1093/sleep/13.4.318. [DOI] [PubMed] [Google Scholar]
- 38.Feng R, Zhou G, Zhang M, Zhang H. Analysis of twin data using SAS. Biometrics. 2009;65:584–9. doi: 10.1111/j.1541-0420.2008.01098.x. [DOI] [PMC free article] [PubMed] [Google Scholar]
- 39.Rodriguez S, Gaunt TR, Day INM. Hardy-Weinberg equilibrium testing of biological ascertainment for Mendelian randomization studies. Am J Epidemiol. 2009;169:505–14. doi: 10.1093/aje/kwn359. [DOI] [PMC free article] [PubMed] [Google Scholar]
- 40.Ambrosius U, Lietzenmaier S, Wehrle R, et al. Heritability of sleep electroencephalogram. Biol Psychiatry. 2008;64:344–8. doi: 10.1016/j.biopsych.2008.03.002. [DOI] [PubMed] [Google Scholar]
- 41.Linkowski P. EEG sleep patterns in twins. J Sleep Res. 1999;8(Suppl 1):11–3. doi: 10.1046/j.1365-2869.1999.00002.x. [DOI] [PubMed] [Google Scholar]
- 42.Linkowski P, Kerkhofs M, Hauspie R, Mendlewicz J. Genetic determinants of EEG sleep: a study in twins living apart. Electroencephalogr Clin Neurophysiol. 1991;79:114–8. doi: 10.1016/0013-4694(91)90048-9. [DOI] [PubMed] [Google Scholar]
- 43.Zung WW, Wilson WP. Sleep and dream patterns in twins: Markov analysis of a genetic trait. Recent Adv Biol Psychiatry. 1966;9:119–30. doi: 10.1007/978-1-4684-8228-7_8. [DOI] [PubMed] [Google Scholar]
- 44.Webb WB, Campbell SS. Relationships in sleep characteristics of identical and fraternal twins. Arch Gen Psychiatry. 1983;40:1093–5. doi: 10.1001/archpsyc.1983.01790090055008. [DOI] [PubMed] [Google Scholar]
- 45.Mackiewicz M, Paigen B, Naidoo N, Pack AI. Analysis of the QTL for sleep homeostasis in mice: Homer1a is a likely candidate. Physiol Genomics. 2008;33:91–9. doi: 10.1152/physiolgenomics.00189.2007. [DOI] [PubMed] [Google Scholar]
- 46.Jenkins A, Archer SN, von Schantz M. Expansion during primate radiation of a variable number tandem repeat in the coding region of the circadian clock gene period3. J Biol Rhythms. 2005;20:470–2. doi: 10.1177/0748730405278442. [DOI] [PubMed] [Google Scholar]
- 47.Nadkarni NA, Weale ME, von Schantz M, Thomas MG. Evolution of a length polymorphism in the human PER3 gene, a component of the circadian system. J Biol Rhythms. 2005;20:490–6. doi: 10.1177/0748730405281332. [DOI] [PubMed] [Google Scholar]
- 48.Viola AU, James LM, Archer SN, Dijk DJ. PER3 polymorphism and cardiac autonomic control: effects of sleep debt and circadian phase. Am J Physiol Heart Circ Physiol. 2008;295:H2156–H63. doi: 10.1152/ajpheart.00662.2008. [DOI] [PMC free article] [PubMed] [Google Scholar]
- 49.Vandewalle G, Archer SN, Wuillaume C, et al. Functional magnetic resonance imaging-assessed brain responses during an executive task depend on interaction of sleep homeostasis, circadian phase, and PER3 genotype. J Neurosci. 2009;29:7948–56. doi: 10.1523/JNEUROSCI.0229-09.2009. [DOI] [PMC free article] [PubMed] [Google Scholar]
- 50.Ioannidis JP, Ntzani EE, Trikalinos TA, Contooulos-Ioannidis DG. Replication validity of genetic association studies. Nat Genet. 2001;29:306–9. doi: 10.1038/ng749. [DOI] [PubMed] [Google Scholar]
- 51.Vink JM, Groot AS, Kerkhof GA, Boomsma DI. Genetic analysis of morningness and eveningness. Chronobiol Int. 2001;18:809–22. doi: 10.1081/cbi-100107516. [DOI] [PubMed] [Google Scholar]
- 52.Klei L, Reitz P, Miller M, et al. Heritability of morningness-eveningness and self-report sleep measures in a family-based sample of 521 hutterites. Chronobiol Int. 2005;22:1041–54. doi: 10.1080/07420520500397959. [DOI] [PubMed] [Google Scholar]
- 53.Koskenvuo M, Hublin C, Partinen M, Heikkila K, Kaprio J. Heritability of diurnal type: a nationwide study of 8753 adult twin pairs. J Sleep Res. 2007;16:156–62. doi: 10.1111/j.1365-2869.2007.00580.x. [DOI] [PubMed] [Google Scholar]
- 54.Archer SN, Robilliard DL, Skene DJ, et al. A length polymorphism in the circadian clock gene Per3 is linked to delayed sleep phase syndrome and extreme diurnal preference. Sleep. 2003;26:413–5. doi: 10.1093/sleep/26.4.413. [DOI] [PubMed] [Google Scholar]
- 55.Jones KH, Ellis J, von Schantz M, Skene DJ, Dijk DJ, Archer SN. Age-related change in the association between a polymorphism in the PER3 gene and preferred timing of sleep and waking activities. J Sleep Res. 2007;16:12–6. doi: 10.1111/j.1365-2869.2007.00561.x. [DOI] [PMC free article] [PubMed] [Google Scholar]
- 56.Lazar AS, Slak A, Lo JC, et al. Sleep, diurnal preference, health, and psychological well-being: a prospective single-allelic-variation study. Chronobiol Int. 2012;29:131–46. doi: 10.3109/07420528.2011.641193. [DOI] [PubMed] [Google Scholar]
- 57.Pereira DS, Tufik S, Louzada FM, et al. Association of the length polymorphism in the human Per3 gene with the delayed sleep-phase syndrome: does latitude have an influence upon it? Sleep. 2005;28:29–32. [PubMed] [Google Scholar]
- 58.Barclay NL, Eley TC, Mill J, et al. Sleep quality and diurnal preference in a sample of young adults: Associations with 5HTTLPR, PER3, and CLOCK 3111. Am J Med Genet B Neuropsychiatr Genet. 2011;156:681–90. doi: 10.1002/ajmg.b.31210. [DOI] [PubMed] [Google Scholar]
- 59.Osland TM, Bjorvatn BR, Steen VM, Pallesen S. Association study of a variable-number tandem repeat polymorphism in the clock gene PERIOD3 and chronotype in Norwegian university students. Chronobiol Int. 2011;28:764–70. doi: 10.3109/07420528.2011.607375. [DOI] [PubMed] [Google Scholar]
- 60.Guan C, Ye C, Yang X, Gao J. A review of current large-scale mouse knockout efforts. Genesis. 2010;48:73–85. doi: 10.1002/dvg.20594. [DOI] [PubMed] [Google Scholar]
- 61.Collaborative Cross Consortium. The genome architecture of the Collaborative Cross mouse genetic reference population. Genetics. 2012;190:389–401. doi: 10.1534/genetics.111.132639. [DOI] [PMC free article] [PubMed] [Google Scholar]
- 62.Churchill GA, Airey DC, Allayee H, et al. The Collaborative Cross, a community resource for the genetic analysis of complex traits. Nat Genet. 2004;36:1133–7. doi: 10.1038/ng1104-1133. [DOI] [PubMed] [Google Scholar]
- 63.Svenson KL, Gatti DM, Valdar W, et al. High-resolution genetic mapping using the Mouse Diversity outbred population. Genetics. 2012;190:437–47. doi: 10.1534/genetics.111.132597. [DOI] [PMC free article] [PubMed] [Google Scholar]
- 64.Banks S, Dinges DF. Behavioral and physiological consequences of sleep restriction. J Clin Sleep Medicine. 2007;3:519–28. [PMC free article] [PubMed] [Google Scholar]