

Abstract
Study Objective:
To develop a whole-night snore sounds analysis algorithm enabling estimation of obstructive apnea hypopnea index (AHIEST) among adult subjects.
Design:
Snore sounds were recorded using a directional condenser microphone placed 1 m above the bed. Acoustic features exploring intra-(mel- cepstability, pitch density) and inter-(running variance, apnea phase ratio, inter-event silence) snore properties were extracted and integrated to assess AHIEST.
Setting:
University-affiliated sleep-wake disorder center and biomedical signal processing laboratory.
Patients:
Ninety subjects (age 53 ± 13 years, BMI 31 ± 5 kg/m2) referred for polysomnography (PSG) diagnosis of OSA were prospectively and consecutively recruited. The system was trained and tested on 60 subjects. Validation was blindly performed on the additional 30 consecutive subjects.
Measurements and Results:
AHIEST correlated with AHI (AHIPSG; r2 = 0.81, P < 0.001). Area under the receiver operating characteristic curve of 85% and 92% for thresholds of 10 and 20 events/h, respectively, were obtained for OSA detection. Both Altman-Bland analysis and diagnostic agreement criteria revealed 80% and 83% agreements of AHIEST with AHIPSG, respectively.
Conclusions:
Acoustic analysis based on intra- and inter-snore properties can differentiate subjects according to AHI. An acoustic-based screening system may address the growing needs for reliable OSA screening tool. Further studies are needed to support these findings.
Citation:
Ben-Israel N; Tarasiuk A; Zigel Y. Obstructive apnea hypopnea index estimation by analysis of nocturnal snoring signals in adults. SLEEP 2012;35(9):1299–1305.
Keywords: Snoring, acoustic analysis, obstructive sleep apnea
INTRODUCTION
Obstructive sleep apnea (OSA) is a chronic disorder affecting 2% to 7% of adults and can lead to considerable morbidity.1 Partial or complete collapse of the upper airway during sleep has different effects on the human body, ranging from noisy breathing (simple snoring)2 to cardiovascular morbidity.3 Snoring is the most common symptom of OSA, occurring in 70% to 95% of patients.4 The estimated prevalence of self-reported snoring in the general population extended over a wide range from 16% to 89%5–8; this prevalence depends on awareness, age, culture, and biased bed partner complaints.4,9,10 Nevertheless, self-reported snoring is considered a poor predictor of OSA because of the great prevalence of snoring in the general population.4,11,12
Little is known about acoustic characteristics of snoring events in adults. Earlier studies investigated snoring sound in- tensity,13 spectral,14–16 and pitch-related17,18 features. Fiz et al.19 used computerized snore detection algorithm enabling full-night analysis. The majority of those studies focused on intra-snore properties by analyzing snore-by-snore events. It is possible that the biological instability of the upper airway formation across the night, and especially during obstructive events, may lead to alterations in inter-snore properties, i.e., between clusters of snore events and across the night. This perspective of snore analysis was not sufficiently explored. Analysis of sequential properties of snores across the night as a measure of inter-snore properties revealed that OSA patients have greater variances of snore duration, separation, and average power. However, inconelusive findings were reported regarding the prediction of AHI by inter-snore measures.20
It is possible that the snoring signal carries essential information able to discriminate between patients of different OSA degrees of severities and simple (non-OSA) snorers. In the current study, we developed and validated a snore analysis algorithm enabling estimation of apnea hypopnea index (AHIEST) based solely on analysis of snoring signals acquired by a noncontact microphone. In this study we explored and combined inter- and intra-snore properties to determine AHIEST in patients referred for polysomnography (PSG) and compared it to AHI determined by PSG (AHIPSG).
METHODS
Setting
University affiliated sleep-wake disorder center and biomedical signal processing laboratory.
Subjects
We recruited 90 consecutively and prospectively adults (aged 19 to 87 years, 33/57 women/men) referred to the Sleep-Wake Unit of Soroka University Medical Center for PSG OSA diagnosis (starting February 2008). We selected the first 60 subjects (patients) for the system training (design) study; the remaining 30 subjects (starting May 2009) were included in the blind validation study. The Institutional Review Committee of the Soroka Medical Center approved the study protocol number 10141.
Study Protocol
A system-design study was performed in which an acoustic screening algorithm for obstructive sleep apnea was developed (Figure 1) to determine AHIEST. Snoring events were automatically located, segmented, and isolated by a snore detection approach based on Gaussian mixture model (see supplemental methods); this approach distinguishes snores from irrelevant noises, such as movements, linen noises, speech, and other interferences. Using the detected snore events, 5 acoustic features were developed and extracted per subject; these features express the acoustic properties of the snores and emphasize the differences between apneic snorers and simple snorers. These features were used for training a Bayes classifier,21 which aimed to classify the subjects into 2 groups: OSA snorers and simple snorers. The classifier was tested by accepted performance evaluation methods such as re-substitution and leave-one-out (LOO) methods (using the design dataset) and a blind test (using the validation dataset). In addition, AHI was estimated (i.e., AHIEST) using a multivariate regression model; this regression model uses the same 5 acoustic features in order to estimate the AHIEST of each subject (see supplemental methods). Validation study was performed on a separate group of consecutive subjects, for whom the snoring analysis was performed using a blind design, i.e., without pre-knowledge of the PSG results.
Figure 1.
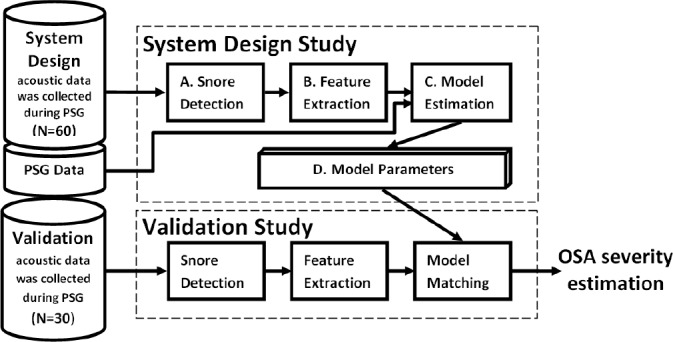
Block diagram of the study protocol. System-design study (n = 60 subjects) in which an acoustic screening algorithm for obstructive sleep apnea was designed. First, (A) The snore detection algorithm (trained by manually segmented events) was applied to isolate snore signals; (B) Five acoustic features were extracted; (C) The features together with polysomnography results, used for model training; (D) Model parameters used. Validation study was performed on 30 subjects by same initial procedures. The extracted acoustic features matched to the model (trained by the system-design data), in order to assess estimation for the subjects' OSA severity.
Acoustic Features
Five acoustic features (i.e., individual measurable heuristic properties of the snore signal) were extracted (see supplemental material for detailed and formulated features' descriptions): (1) Mel-Cepstability is a measure of the entire night spectrum`s stability, defined as the sum of variances of 12 Mel Frequency Cepstrum Coefficients22 (common representation of the audio spectrum) normalized by the total energy of the snores. (2) Running Variance quantifies the inter-snore variability of the snore`s energy across the night. All the snores were clustered into groups according to their proximity and the within-group variance was evaluated; then the global mean was calculated for each patient. (3) Apneic Phase Ratio represents the relative duration when the upper airways are collapsed, defined as the relative number of snore groups with energy variance larger than a specific threshold. (4) Inter-Event Silence counts the acoustic energy pattern of obstructive apneic events, i.e., silence between 2 sound events. (5) Pitch Density17 is a measure of the stability of the tissue's vibration frequency.
Data Collection
Prior to nocturnal in-laboratory PSG all subjects completed a validated self-administered sleep questionnaire.3,23–25 The Epworth Sleepiness Scale (ESS) was used to evaluate daytime sleepiness.26 Apneas and hypopneas were defined using the American Academy of Sleep Medicine criteria.27 An apnea was defined as a decrease in airflow > 80% from baseline for > 10 sec. A hypopnea was defined as a decrease in airflow > 50% airflow reduction and > 4% desaturation for > 10 sec. Apnea hypopnea index (AHI) was calculated as the number of respiratory events per hour of sleep.
Acoustic signals were recorded using a non-contact directional condenser microphone with a frequency range of 2020,000 Hz (RØDE, NTG-1), placed 1 m above the bed and connected to an audio recording device (Edirol R-4, Bellingham, WA, USA). Each recorded signal was digitized (PCM, 16 bits per sample, 44,100 Hz), down sampled to 16 KHz, and synchronized with PSG study onset. This procedure enables reliable acquisition of full-night audio signal and ensures that all the snores (and other low intensity audio events) are recorded, minimizing the possibility for false periods of silence detection.
Data and Statistical Analyses
Acoustic and statistical analyses were performed using MATLAB (R-2010b, The MathWorks, Inc., Natick, MA, USA). Both the system design study (n = 60) and the validation study (n = 30) had similar data handling protocols (Figure 1). Performance characteristics were conducted separately for the design study and the validation study.
Statistical power (α = 0.05) was calculated for the validation set based on AHIEST values extracted from the system design data set. A sample size of 25 subjects was calculated to provide > 95% power to detect significant differences between OSA (AHI > 10) vs. non-OSA subjects (AHI < 10). Therefore, 30 subjects were recruited for the validation study. PSG data were compared between non-OSA and OSA subjects and between design and validation study groups using student t-test or x2 test. The square of the correlation coefficient (R2) between each of the 5 acoustic feature values and the AHI was calculated. In case of nonlinear relations (as in apneic-phase-ratio and pitch density), a nonlinear transformation was applied prior to correlation evaluation. Using multivariable regression, fed by the entire set of features, we estimate the OSA severity (AHIEST), i.e., estimate equation that binds the proposed features (independent variables) to AHIEST (dependent variable).
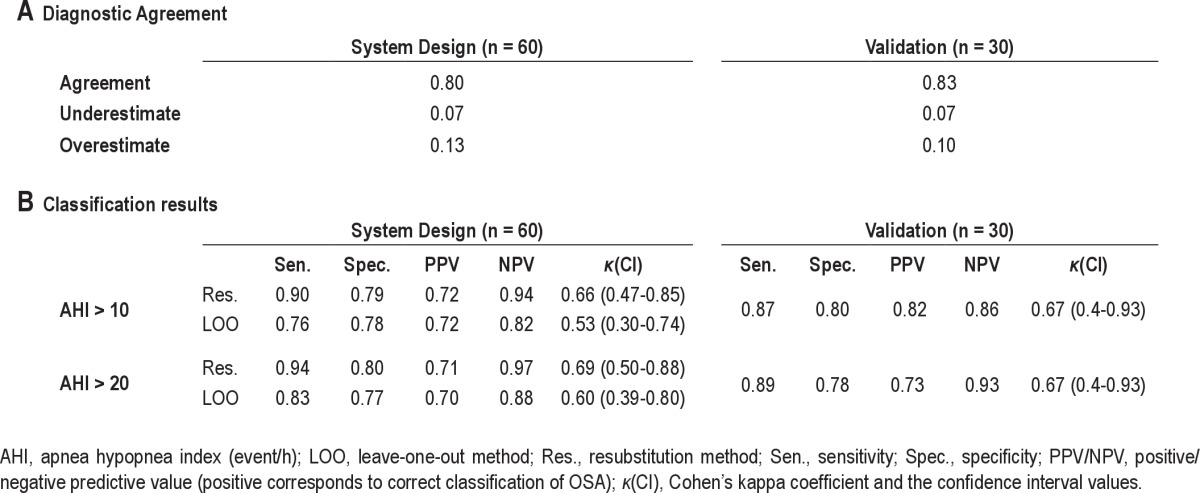
Comparing AHIEST with AHIPSG was done by: (1) Altman Bland plot28 to determine diagnostic agreement between the gold standard AHIPSG and AHIEST. (2) The diagnostic agreement approach29 was used to assess the accuracy of our system in OSA prediction. Diagnostic agreement is defined when AHI > 40 on both assessments, or if AHIPSG < 40 and AHIEST was within 10 events/h; overestimate and underestimate are defined when AHIEST is 10 events/h more or less than AHIPSG (both < 40 events/h), respectively.
The classification performances were estimated using the resubstitution method (optimistic estimation) and the leave-one-out validation (pessimistic estimation) method,21 which provides an indication for possible over-fitting, i.e., whether the complexity of the classifier is suitable for the quantity of data. For the classification (AHI < 10/20 event/h), sensitivity and specificity were obtained, together with the un-weighted Cohen kappa coefficient (k).30 Performance for different working points was obtained from a receiver-operating curve (ROC) and the area under this curve (AUC). Data are presented as mean ± SD. The null hypothesis was rejected at the level of 5%.
RESULTS
Patients
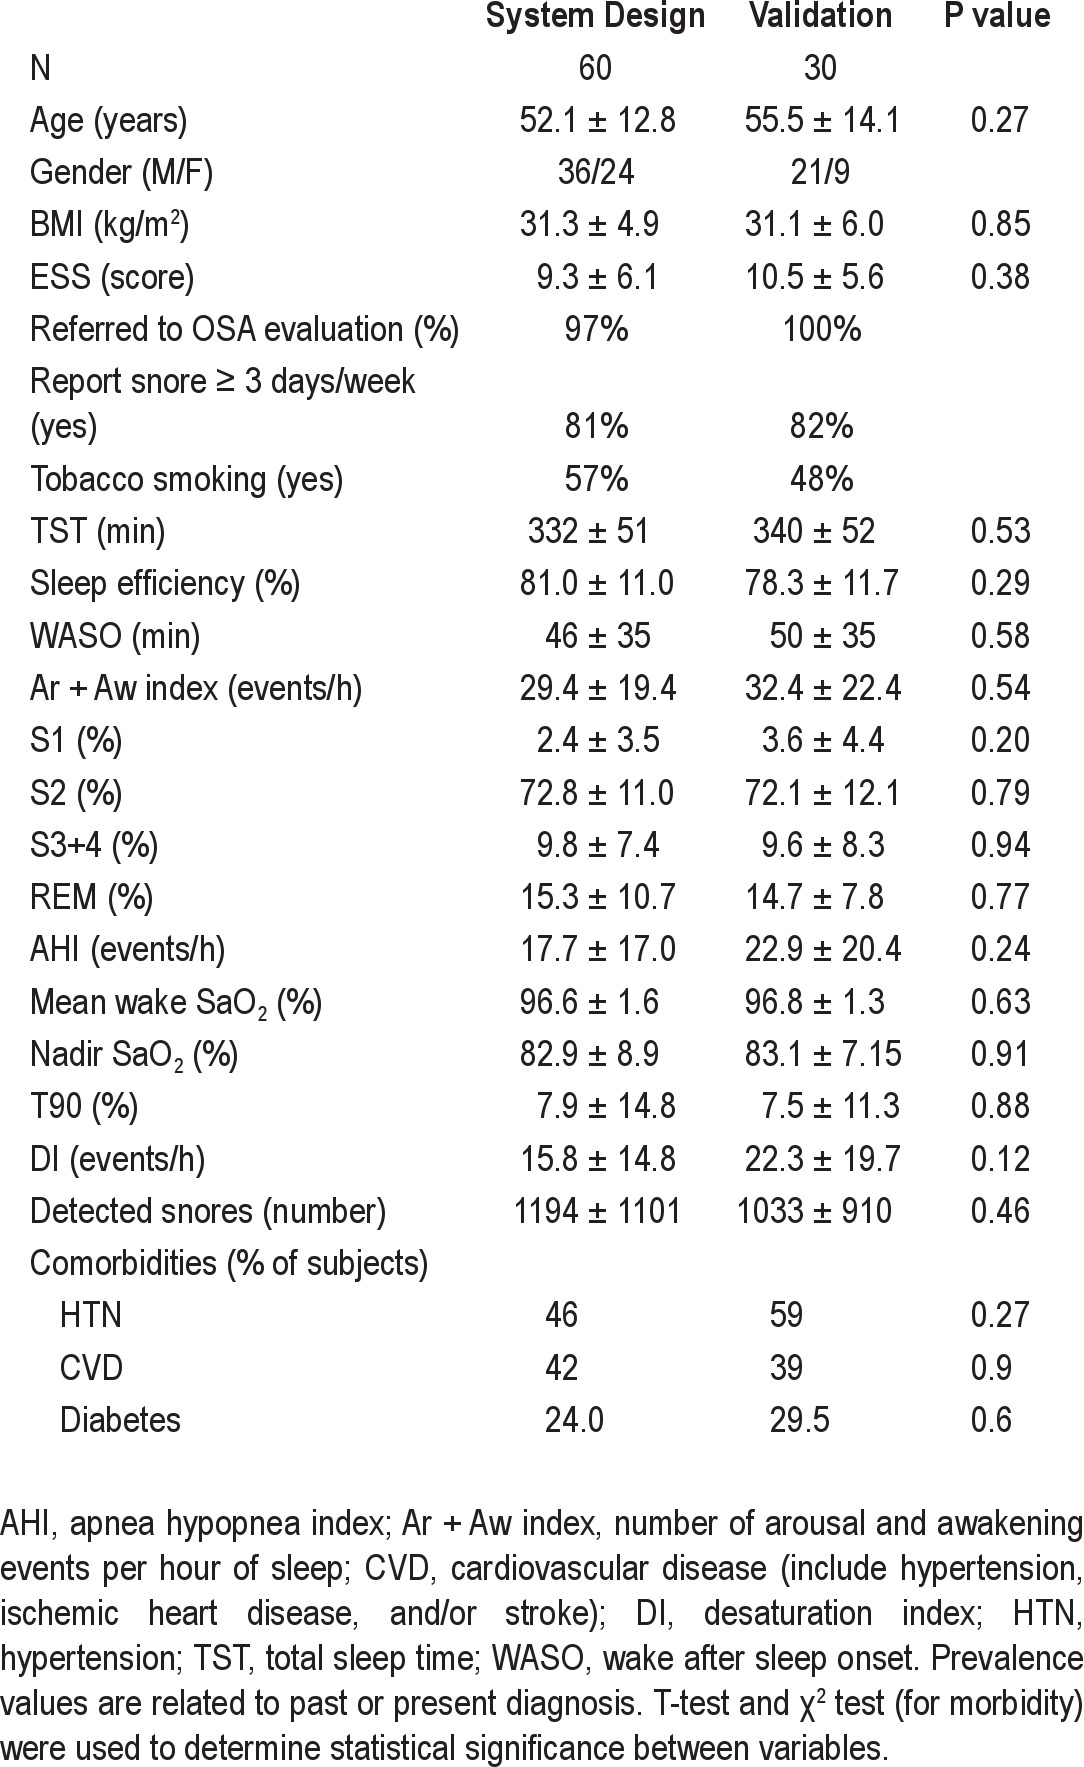
We approached 90 potentially eligible patients. Eleven patients reported that they snored < 3 nights/week, and 16 reported that they “don't know” how many days a week they snore. No significant differences were found between system design (N = 60, m/f 36/24) and validation (N = 30, m/f 21/9) groups in age, BMI, snoring, ESS, AHI, associated morbidities, or tobacco smoking (Table 1).
Table 1.
Subject characteristics and main comorbidities
Snore Detection
During system design, a snore detection algorithm was trained and tested using large amounts of manually labeled events (121,400 snoring events and 77,400 noise events). Very good performance rates of 87% to 92% correct snore detection and 6% to 10% false positive were achieved using resubstitution and cross-validation methods. Finally, the mean number of detected snoring events was 1267 (range 127-4030) and 1295 (range 146-3519) per subject in the system design and validation study, respectively (P = 0.46; Table 1).
Feature Extraction
Table 2 presents for each feature its values and its correlation with AHI for both groups. No significant difference was found between groups (all P > 0.3). All 5 selected acoustic features were found to be significantly correlated with AHI (all P < 0.01). The most correlated feature was the inter-event silence. The running variance feature was found to be higher in adjacent to apnea events, as exhibited in Figure 2A.
Table 2.
Acoustic feature analysis
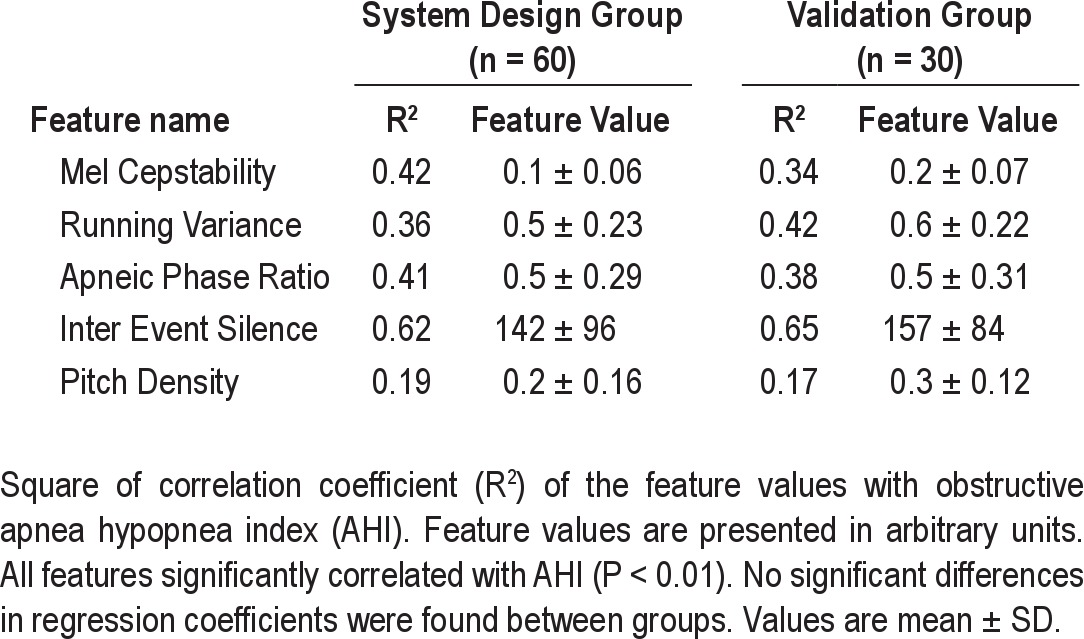
Figure 2.
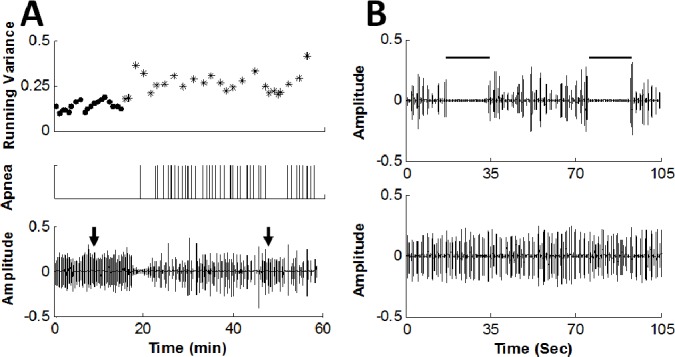
Simple and apneic snoring phases. (A) Upper panel: time course of the running variance feature (arbitrary units); dots indicate simple snoring phase (i.e., ≥ 10 min distant from obstructive apnea events) and asterisk indicates apneic phase (i.e., < 4 min around each obstructive event). Middle panel: marking of obstructive apneas events (by polysomnography) by vertical lines. Lower panel: snore amplitude (arbitrary units). Note the ascension of the running variance values during apneic phase, i.e., around apnea events. (B) Upper panel demonstrates the acoustic signal of typical apneic phase of the same subject taken at the time indicated by right arrow in A. Note the instability of the snore signal. Lower panel: typical simple snoring phase taken at the time indicated by the left arrow in A. Note the differences in time base between A and B. Data were collected from a 62-year-old man, BMI = 28.7 (kg/m2), AHI = 33 (events/h), about 2 h after sleep onset.
Estimated Apnea and Hypopnea Index (AHIEST) was calculated by multivariate linear regression model (trained by the system design group), fed by the 5 features as the independent variables. AHIEST was found to be correlated with AHIPSG (study design: r2 = 0.81, P < 0.001; validation: r2 = 0.71, P < 0.001). Scatter plots of AHI by AHIPSG versus AHIEST are shown in Figure 3A; examining this figure, one can see that there is a slight trend towards a plateau at AHI > 30 events/h in the validation study. Examining the Bland and Altman plots (Figure 3B) comparing AHIPSG versus AHIEST showed no consistent bias, i.e., the mean difference was only 0.5 and 3.5 events/h for system design and validation, respectively. The plots also show that the AHIEST corresponded more closely to AHIPSG when the mean AHI was < 30 events/h in the validation study. Finally, using the diagnostic agreement approach,29 we found 80% to 83% diagnostic agreements with PSG (Table 3A). It should be noted that combining the 5 features into one model improves the correlation of AHI estimation (compared to each feature by itself).
Figure 3.
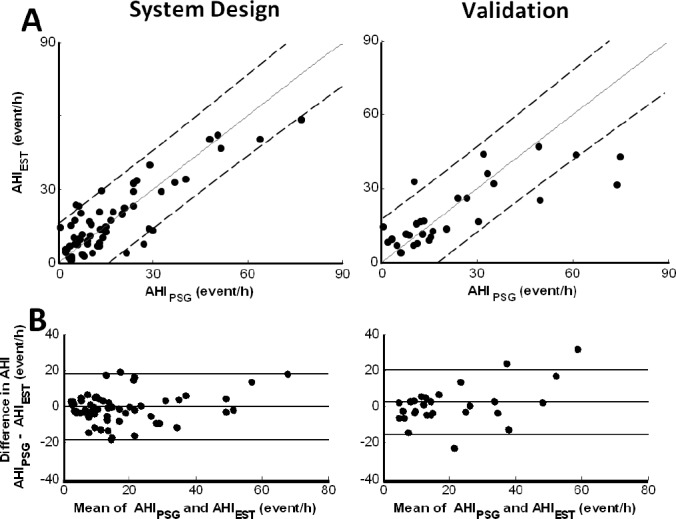
System evaluation. (A) Scatter plots of estimated AHI (i.e., AHIEST) versus gold standard AHI determined by polysomnography (AHIPSG) of system-design (left panel) and validation (right panel) study. Solid line indicates identity line and dashed lines indicates 95% confidence interval. (B) Bland-Altman-plot of system-design and validation studies. Lines indicate the average difference and the 2 standard deviations. No consistent bias was found comparing AHIPSG versus AHIEST for both system design and validation.
Table 3.
System performance
Patient Classification
Using the Bayes classifier,21 we classified the subjects into 2 groups using a threshold of AHI > 10 (events/h) and AHI > 20. In the validation study, the classification rates were 87% (80%) sensitivity (specificity) for AHI > 10 and 89% (78%) for AHI > 20. For both AHI thresholds, Cohen κ was 0.667 (CI 0.39-0.93), which is considered as good agreement.30 Full performance evaluation is represented in Table 3B. ROC curves corresponded to the same AHI cutoffs (Figure 4) for the system design (upper panel) and validation (lower panel) studies. The AUC were all > 0.85, showing high sensitivity and specificity in screening for OSA.
Figure 4.
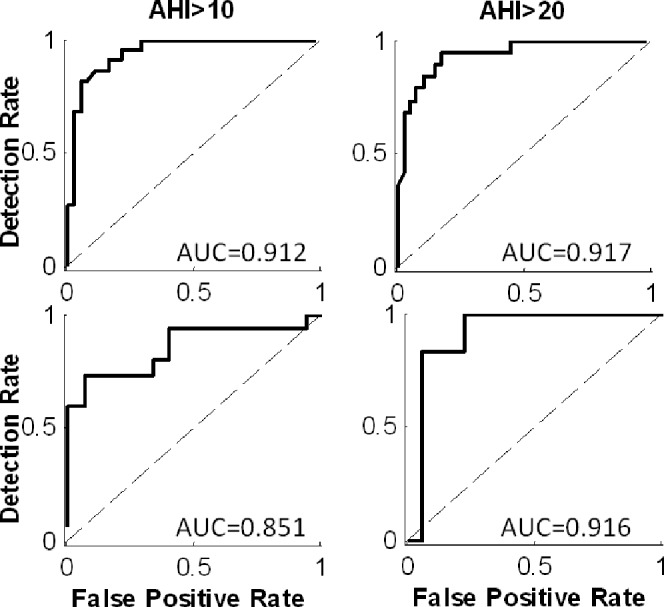
Receiver operating characteristic (ROC) curve. ROC curves of 2 AHI cutoff points, i.e., AHI > 10 (left), > 20 (right) (events/h). Upper panel: system design group, evaluated by resubstitution method; lower panel: validation study. AUC, area under each ROC curve.
DISCUSSION
We propose innovative approach for AHIEST based solely on snoring sound signals. Our data suggest that acoustic analysis can differentiate subjects according to AHI. An acoustic-based screening system may address the growing needs for OSA screening diagnosis tools.
Acoustic Features
In the current study, several acoustic features were examined and followed by implementation of novel ideas. The majority of earlier studies focused on a limited number of selected features and, as such, essential information was not sufficiently explored. Earlier studies mainly investigated intensity levels,13 pitch analysis,17,18 and formant frequencies14–16 of snoring sounds. Also, higher order spectral-based algorithms.31 sub-band energy distributions, and sequential properties20 were investigated in the context of snoring and sleep apnea. These acoustic features have been shown to be in statistical associated with OSA, but none of these studies have estimated AHI based on acoustic analysis of snoring across the night. In our study, we selected five acoustic features that best explain the relations between snoring and AHI. The selected features capture the energy dynamics and frequency information that is hidden in the snoring sounds. Some of the features (mel-cepstability and pitch density) contain intra-snore information, and the others (running variance, apnea phase ratio, and inter-event silence) contain the inter-snore information. Our data indicate that the inter-event silence was the best feature for predicting AHI (as a single feature, Table 2); nevertheless, estimation of AHI solely by this feature results in poor prediction of AHI and therefore poor system performance. The unique combination of these five features gives a powerful multidimensional feature vector that is highly correlated with the AHI. Use of the multivariate approach was found, as expected, to outperform each of the single-feature performances.
Body posture during sleep may affect the acoustic characteristics of snores,32 such as snoring intensity. Since body posture can change several times during sleep, we selected acoustic features that are minimally affected by sound intensity. For example, the mel-cepstability feature, a spectrum based feature (based on the cepstrum coefficient),22 is not affected by sound intensity; the Inter-event silence feature is based on the event detection algorithm, which has an adaptive energy threshold; the pitch density is based on the autocorrelation function,22 and as such is not affected by sound intensity. However, it is possible that not only the sound intensity is affected by body posture, but also other acoustic properties. Further study should investigate the effect of sleep position on AHIEST.
Our data show greater variances in snore characteristics among patients with AHI > 10, both in frequency domain (mel- cepstability) and across the night (running variance). These findings support the thought that OSA is associated with functional abnormalities of the upper airways indicating collapsibility.33 However, all the aforementioned studies explored jointly all the snores of a subject without referring to the snore timeline across the night, as we did in this study. Our study shows for the first time transient variations in the acoustic signal adjacent to obstructive events (Figure 2A). Such a perspective found expression in the apneic phase ratio feature, which quantifies temporary ascension of feature variation around obstructive events, caused, probably, by biological alterations of airway patency during efforts to restore ventilation.34
Estimated AHI (AHIEST)
One of the merits of this study is the ability to estimate AHI based solely on snoring signal using a non-contact directional microphone. Across a wide range of OSA severities, the AHIEST is strongly correlated with the AHIPSG. To our knowledge, none of the previous reports proposed estimation of AHI by snoring analysis and validated their results. Van Brunt et al.,13 however, sought an acoustical signature event, defined as a loud sound preceded by a period of silence (as can be seen in Figure 2B), and quantified apnea events accordingly. A major limitation of their approach was the great sensitivity to artifact noises and the need for process automation that was not performed and is essential for across-night snoring analysis. Our study improves Van Brunt's approach by applying an event detection algorithm, applying acoustic filtration, which enables avoiding misdetection of apnea due to slight breath hidden by background noise, and tracing for other indicators for obstructive events, such as transient ascension of variances. Taken together, the proposed method to evaluate AHIEST is an accurate and reliable approach for the detection of OSA having very good agreement with AHIPSG.
Study Strengths and Limitations
To our knowledge, this is the first study exploring acoustic properties of snoring using two different subject groups, i.e., system design and validation study using blind design. Earlier studies investigated snoring properties; however, their conclusions were based on a relatively small number of subjects without including a separate group for a validation study.13–19 Our approach to estimating AHIEST used a single-channel device (directional non-contact microphone) that is simple for patients to operate without any body contact. Such a microphone is more convenient and less sensitive to artifacts from blankets and body movements; other environmental noises were controlled in our laboratory setting. Most likely, if subjects will be instructed to sleep alone at home during the proposed OSA screening test, the expected challenges will not be significantly different from our laboratory setting. Further studies should explore data reproducibility, mainly AHIEST, by comparing at-home to inlaboratory data and by comparing multi-night data.35 Cathcart et al.35 recently explored night-to-night variation in snoring intensity concluded that more than one night is required to reliably explore this feature, supporting other investigators.36 Further studies are needed to explore night-to-night variability of AHIEST.
The snore detection system is an important part of the overall AHI estimation and classification system, and may minimize the potential bias of subjective snoring reporting by patients and/ or their bed partners.4,9,10 Since the snore detection system is trained using manually labeled sound events, it is somewhat biased by the human observer's perception of snore sounds. In addition, the snore detection system is influenced by the number and diversity of snore events and the type of algorithm/ classifier used. In this study, several procedures were used to minimize the potential bias of the snore detector. First, the graphical user interface for the manual labeling of audio events enabled a trained research assistant to better identify the snore events by both visual and acoustic perception. Second, the snore detection algorithm was well fitted, thanks to the very large database used (121,400 snores and 77,400 noise events). And finally, a powerful multi-parameter approach (GMM that was fed numerous features, such as pitch and duration) was used.
Even though snores are the first symptom associated with OSA, very few OSA patients do not snore.2,4 Our system, which is based on snore signal detection, is able to identify whether the patient does not snore; in such rare cases the system may not report any result but may refer the patient for further diagnosis (i.e., PSG study). Finally, since all the data in the current study were obtained during laboratory PSG and reproducibility was not tested, further studies are required to explore the usefulness of this acoustic model for OSA screening at-home and inlaboratory using a larger sample size and a wider range of AHI.
The Need
The “flood” of undiagnosed patients presenting with symptoms suggestive of sleep disordered breathing is a major challenge to decision-makers and requires a disease management approach. The demand for diagnostic services is governed by the great prevalence of the disorder, its associated comorbidity, and increasing level of public awareness.10 However, < 10% of patients with OSA are diagnosed; more than 80% had a missed diagnosis years before PSG, and only 10% of the referrals were made as result of clinician-elicited history of sleep related complications.37
One of the main goals of sleep medicine today is to improve access to OSA diagnosis and treatment.38 On the other hand, resource availability (supply) is governed by the cost of obtaining a diagnosis, the number of facilities available, the number of sleep and allied health specialists, the policies governing reimbursement for ordering and interpreting results, and the level of adherence to practice guidelines.39 At present, resource availability is limited relative to demand. While multichannel sleep apnea monitoring devices can be used at home, there are a number of constraints for their use; these include cost-effectiveness limitations, reduced availability of technical and specialist expertise, and complexity for patient use at home.40
Summary
This study provides evidence that snoring analysis based on intra- and inter-snore properties can differentiate adult habitual snorers according to AHI. An acoustic-based system may address the growing needs for OSA screening diagnosis tools. Further studies are needed to determine data reproducibility of this system and its cost-effectiveness as a potential screening tool for OSA.
DISCLOSURE STATEMENT
This was not an industry supported study. The authors have indicated no financial conflicts of interest.
ACKNOWLEDGMENTS
The authors thank Mrs. Bruria Freidman from the Sleep Wake Disorder Unit of Soroka University Medical Center, for her support, collaboration, and understanding. Work for this study was supported in part by the Israeli Ministry of Industry, Trade and Labor, The Kamin Program, award no. 46168.
Footnotes
A commentary on this article appears in this issue on page 1195
SUPPLEMENTAL MATERIAL
SUPPLEMENTAL METHODS
Study Protocol
A system-design study was performed in which an acoustic screening algorithm for obstructive sleep apnea was developed (Figure 1 in manuscript). Snoring events were isolated by a snore detection system. Five acoustic features (mel-cepstability, running variance, apnea phase ratio, inter-event silence, and pitch density) were extracted and used for training a Bayes classifier, which was tested by accepted performance evaluation methods such as re-substitution and leave-one-out cross-validation methods, as previously recommended.1 Subjects were classified into categories of OSA severity according to the subject's AHI. AHI was estimated (i.e., AHIEST) using a multivariate regression model and compared to the gold standard PSG result (i.e., AHIPSG) using Bland Altman analysis2 and diagnostic agreement approach (E3; see below). The validation study was performed on 30 subjects, for which the snoring analysis was performed blindly using the designed system.
Both the system design study and validation study had similar data handling protocols (Figure 1 in manuscript): (1) snore detection, (2) acoustic feature extraction, and (3) classification into OSA severity categories and AHI estimation. Acoustic analyses were performed using MATLAB (R-2008a, The Math-Works, Inc., Natick, MA, USA).
Data Collection
Questionnaires
Subjects completed a validated self-administered sleep questionnaire.4,5 The Epworth sleepiness scale was used to evaluate daytime sleepiness.6
Polysomnography (PSG)
Subjects underwent PSG; they reported to the laboratory at 8:30 PM and were discharged the following morning.5 Subjects were encouraged to maintain their usual daily routine and to avoid any caffeine and/or alcohol intake on the day of the study. Shift workers did not perform the PSG study in the week following shift duty. Overnight PSG included recordings (Viasys, SomnoStar Pro, Yorba Linda, CA, USA) of EEG (C3/A2, C4/ A1, and O2/A1, O1/A2), electrooculogram (right and left outer canthus), electromyogram, and electrocardiogram. Airflow (pressure transducer, Pro Tech Monitoring Inc., Tampa Bay, FL, USA), chest and abdominal efforts (inductive plethysmography, Respitrace Ambulatory Monitoring), and arterial oxyhemoglobin saturation (Respironics Movametrix, Wallingford, CT, USA) were recorded. Nocturnal sleep/wake and sleep stages were scored in accordance with the Rechtschaffen and Kales' criteria.7 Arousals and awakenings were scored according to the American Sleep Disorders Association task force recommendation.8 The subject's body posture was not recorded. Scoring was done by a trained technician using the traditional criteria4,5 and reviewed by a polysomnographer, and a report sent to the referring physician. Obstructive apnea was defined as an episode of complete cessation of breathing (airflow reduction > 80%) > 10 sec with continuing inspiratory effort. A hypopnea was scored when continuing inspiratory effort was accompanied by a reduction > 50% in airflow, resulting in either an arousal or oxygen desaturation > 4%. The AHI was calculated as the number of respiratory events (apnea/hypopnea) per hour of sleep.9 A sleep physician explained the significance of the results to the patients (prior to the CPAP support program) with recommendations for treatment.
Snore Detection
To isolate the snore events from background and transient noises (speech, coughs, body movements, etc.), a snore detection system was designed. First, an event detection algorithm was implemented based on an adaptive energy threshold. These detected events are suspected snore events; they are relatively short and energetic. The energy threshold is calculated from a histogram of a 5-min moving window. Subsequently, the suspected events were classified as either snores or noise events using a Gaussian mixture model (GMM) classifier1 (see description next section). The GMMs for the snores and for other nonspecific noises (order of 3 and 10 Gaussians, respectively) were trained using the following features (extracted from each detected event): 16 linear predictive coefficients,10 average pitch value (calculated via autocorrelation method), event duration, total energy, and time from the beginning of the event to its highest peak. This classifier was trained using manually labeled events. For this purpose, we developed a semi-automatic graphical user interface (GUI). The GUI automatically detects relatively high energy audio events (suspected as snores), including transient noises, then a researcher has to decide if each event is a snore or other interference/noise; this decision was based on audio and visual perception using the GUI.
Gaussian Mixture Model (GMM)
A Gaussian mixture density is a weighted sum of M component densities, as given by the following:
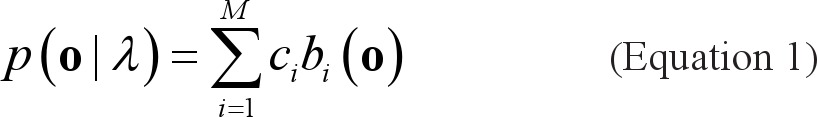 |
where o is a D-dimensional feature vector of an event, b,(0), i = 1,..., M are the component densities, and ci; i = 1,..., M are the mixture weights. Each component density is a D-variate Gaussian function of the form
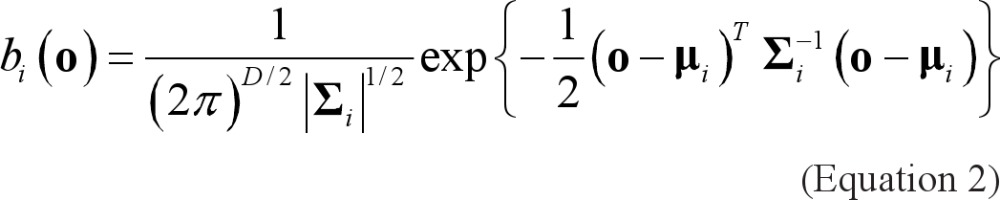 |
with mean μi- and covariance matrix Σi The mixture weights have to satisfy the constraint ΣMi=1 ci= 1. The complete Gaussian mixture density is parameterized by the mean vector, the covariance matrix, and the mixture weight from all component densities. These parameters are collectively represented by
 |
For training GMMs, the maximum likelihood (ML) procedure is adopted to estimate model parameters by maximizing the likelihood of GMM given the training data.
The identification (matching) algorithm is simple compared with the training process. Using the two trained models (snore GMM and noise GMM) and the feature vector, calculated from a new event, a general event classification decision (snore/nonsnore) is performed using log-likelihood ratio (LLR) scores,
where λs is the snore model and λn is the noise model.
Acoustic Feature Extraction
For the classification and estimation of AHI, the following 5 acoustic features were selected:
Mel-Cepstability is a measure of the entire night spectrum>s stability. This novel feature is based on the mel frequency cepstral coefficient (MFCC),10 which is a representation of the short-term power spectrum, based on a cosine transform of a log power spectrum, on a mel-scale of frequencies. The mel cepstability feature was defined as the sum of variances of 12 MFCCs extracted from the highest energy frame in each snore, normalized by means of Es (the total energy of the sth snore):
 |
where ci is a vector of the ith MFCC of all the snores, S is the total number of snores by subject j.
Running Variance: In order to quantify inter-snore variability across the night, the total energy of each snore was calculated. All the snores were clustered into groups, according to distance from the closest snore in the group: in cases > 1-min duration between the group and the snore, the snore was ascribed to the next group. The running variance, defined as the within group snore energy variance, was evaluated. For each patient, the global mean was calculated.
Apneic Phase Ratio: We defined “simple phase” as the portion of sleep when no apnea occurred within a time interval of 10 minutes. “Apneic phase” was defined as the portion of sleep < 4 min around each apnea event. Reasonably healthy subjects exhibit fewer apneic phases than OSA patients. We assumed that due to biological alterations of the airway patency during efforts to restore ventilation group of snores during an apneic phase would exhibit higher within-group variance. Apneic phase ratio was defined as the relative number of snore groups with variance larger than ζ. where ζ was chosen empirically.
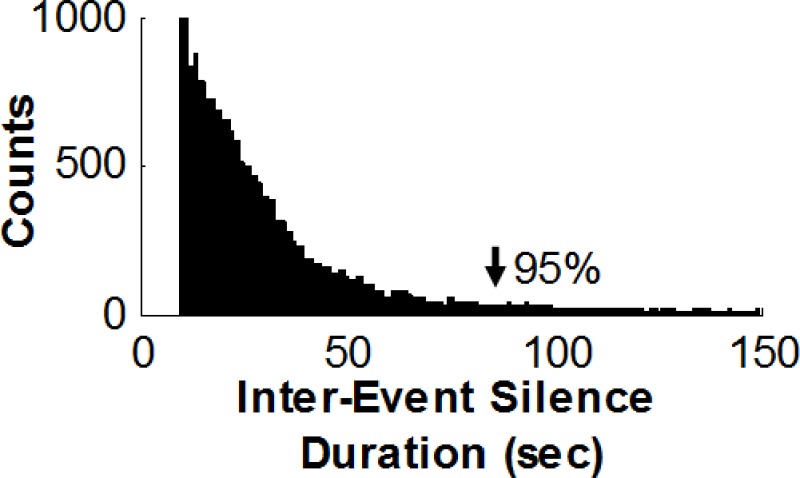
Inter Event Silence: The acoustics of an apnea event can be characterized through its pattern of silence between 2 sound events. Only intervals > 10 and up to 90 seconds were investigated, since 95% of the apneas last <1.5 minute. The histogram of the silence periods durations in our experiment is exhibited in Figure S1. Furthermore, to verify that the subject does not breathe during “silence events” (i.e., having obstructive apnea), a background noise filtration was performed, using the spectral subtraction method.10 This procedure enabled detection of minimal breathing sounds that may be hidden by the background noise. It should be noted that OSA assessment is a combination of hypopnea events as well, which acoustically come into expression by the sounds of breathing efforts. Those noises might mislead the silence detection, and as a consequence, may lead to underestimation (due to the fact that only apneas can be detected by this feature). An analogous apnea event detector has already been suggested.11
Distribution histogram of Inter-event Silence durations. Histogram of silence durations for the system-design group marked as obstructive events by polysomnography technologies. Note that 95% of silence periods are < 90 sec (arrowhead). A threshold of 90 sec was set as the maximum length investigated when extracting the inter-event silence feature.
Pitch Density: 12 is a measure of the stability of the tissue's vibration frequency. Each snore event was subdivided into 30- msec frames. For each frame, the autocorrelation function was estimated, and the value of the autocorrelation local maxima (peak(Rii) — a measure of the fundamental frequency's presence) was analyzed. The pitch density for each snore was calculated as the fraction of the snoring time where the pitch is detectable (peak(Rii) > 0.5) over the total snoring time:
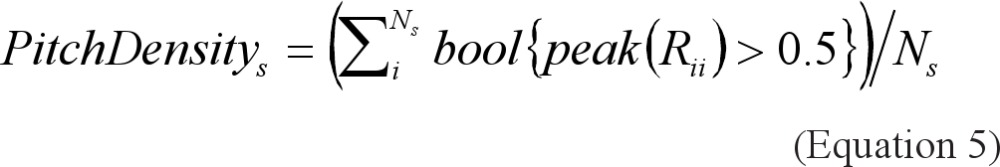 |
where Rii is the autocorrelation function of the ith frame and Ns is the number of frames in the sth snore.
Classification: A 5-dimension feature vector was assigned to each subject. The Bayes classifier1 was implemented to classify the subjects into 2 categories according to OSA severity. The naïive Bayes classifier assumes normal distributions for uncorrelated features. The parameters of the classifiers (groups means and covariance matrices) were estimated to maximize the likelihood of the training data. Once we have the classifier parameters, given a 5-dimension feature vector that represents a new patient, we can estimate the conditional probability that the patient is healthy or suffers from OSA.
SUPPLEMENTAL REFERENCES
- 1.Fukunaga K. 2nd ed. London: Academic Press; 1990. Introduction to statistical pattern recognition. [Google Scholar]
- 2.Bland J, Altman DJ. Statistical methods for assessing agreement between two methods of clinical measurement. Lancet. 1986;1:307–10. [PubMed] [Google Scholar]
- 3.White DP, Gibb TJ, Wall JM, Westbrook PR. Assessment of accuracy and analysis time of a novel device to monitor sleep and breathing in the home. Sleep. 1995;18:115–26. doi: 10.1093/sleep/18.2.115. [DOI] [PubMed] [Google Scholar]
- 4.Tarasiuk A, Greenberg-Dotan S, Simon T, Tal A, Oksenberg A, Reuveni H. Low socioeconomic status is a risk factor for cardiovascular disease among adult obstructive sleep apnea syndrome patients requiring treatment. Chest. 2006;130:766–73. doi: 10.1378/chest.130.3.766. [DOI] [PubMed] [Google Scholar]
- 5.Rotem AY, Sperber AD, Krugliak P, Freidman B, Tal A, Tarasiuk A. Polysomnography and actigraphy evidence of sleep fragmentation in patients with irritable bowel syndrome. Sleep. 2003;26:746–52. doi: 10.1093/sleep/26.6.747. [DOI] [PubMed] [Google Scholar]
- 6.Johns MW. A new method for measuring daytime sleepiness: the Epworth sleepiness scale. Sleep. 1991;14:540–54. doi: 10.1093/sleep/14.6.540. [DOI] [PubMed] [Google Scholar]
- 7.Rechtschaffen A, Kales A. Washington, DC: US Public Health Service; 1968. A manual of standardized terminology: techniques and scoring system for sleep stages of human subjects. [DOI] [PubMed] [Google Scholar]
- 8.Sleep Disorders Atlas Task Force. EEG arousals: scoring rules and examples. Sleep. 1992;15:173–84. [PubMed] [Google Scholar]
- 9.American Thoracic Society: Standards and indications for cardiopulmonary sleep studies in children. The official statement of the American Thoracic Society. Am J Respir Crit Care Med. 1996;153:866–78. doi: 10.1164/ajrccm.153.2.8564147. [DOI] [PubMed] [Google Scholar]
- 10.Deller JR, Hansen JHL, Proakis JL. 2nd ed. New York: Institute of Electrical and Electronics Engineers Press; 2000. Discrete-time processing of speech signals. [Google Scholar]
- 11.Van Brunt DL, Lichstein KL, Noe SL, Aguillard RN, Lester KW. Intensity pattern of snoring sounds as a predictor for sleep-disordered breathing. Sleep. 1997;20:1151–6. doi: 10.1093/sleep/20.12.1151. [DOI] [PubMed] [Google Scholar]
- 12.Solà-Soler J, Jane R, Fiz JA, Morrera J. Pitch analysis in snoring signals from simple snorers and patients with obstructive sleep apnea. Conf Proc IEEE Eng Med Biol Soc. 2002;2:1527–8. [Google Scholar]
REFERENCES
- 1.Punjabi NM. The epidemiology of adult obstructive sleep apnea. Proc Am Thorac Soc. 2008;5:136–43. doi: 10.1513/pats.200709-155MG. [DOI] [PMC free article] [PubMed] [Google Scholar]
- 2.Counter P, Wilson JA. The management of simple snoring. Sleep Med Rev. 2004;8:433–41. doi: 10.1016/j.smrv.2004.03.007. [DOI] [PubMed] [Google Scholar]
- 3.Tarasiuk A, Greenberg-Dotan S, Simon T, Tal A, Oksenberg A, Reuveni H. Low socioeconomic status is a risk factor for cardiovascular disease among adult obstructive sleep apnea patients requiring treatment. Chest. 2006;130:766–73. doi: 10.1378/chest.130.3.766. [DOI] [PubMed] [Google Scholar]
- 4.Hoffstein V, Mateika S, Anderson D. Snoring: is it in the ear of the beholder? Sleep. 1994;17:522–6. doi: 10.1093/sleep/17.6.522. [DOI] [PubMed] [Google Scholar]
- 5.Stoohs RA, Blum HC, Haselhorst M, Duchna HW, Guilleminault V, Dement VC. Normative data on snoring: a comparison between younger and older adults. Eur Respir J. 1998;11:451–7. doi: 10.1183/09031936.98.11020451. [DOI] [PubMed] [Google Scholar]
- 6.Lugaresi E, Crigonotta F, Coccagna G, Piana C. Some epidemiological data on snoring and cardiocirculatory disturbances. Sleep. 1980;3:221–4. doi: 10.1093/sleep/3.3-4.221. [DOI] [PubMed] [Google Scholar]
- 7.Marin JM, Gascon JM, Carrizo S, Gispert J. Prevalence of sleep apnoea syndrome in the Spanish adult population. Int J Epidemiol. 1997;26:381–6. doi: 10.1093/ije/26.2.381. [DOI] [PubMed] [Google Scholar]
- 8.Wilson K, Stoohs RA, Mulrooney TF, Johnson LJ, Guilleminault C, Huang Z. The snoring spectrum. Acoustic assessment of snoring sound intensity in 1,139 individuals undergoing polysomnography. Chest. 1999;115:762–70. doi: 10.1378/chest.115.3.762. [DOI] [PubMed] [Google Scholar]
- 9.Bliwise DL, Nekich JC, Dement WC. Relative validity of self-reported snoring as a symptom of sleep apnea in a sleep clinic population. Chest. 1991;99:600–8. doi: 10.1378/chest.99.3.600. [DOI] [PubMed] [Google Scholar]
- 10.Reuveni H, Tarasiuk A, Wainstock T, Ziv A, Elchayani A, Tal A. Awareness level to obstructive sleep apnea syndrome during routine unstructured interviews of a standardized patient by primary care physicians. Sleep. 2004;27:1518–25. doi: 10.1093/sleep/27.8.1518. [DOI] [PubMed] [Google Scholar]
- 11.Flemons WW, Whitelaw WA, Brant R, et al. Likelihood ratios for a sleep apnea clinical prediction rule. Am J Respir Crit Care Med. 1994;150:1279–85. doi: 10.1164/ajrccm.150.5.7952553. [DOI] [PubMed] [Google Scholar]
- 12.Young TB. Some methodologic and practical issues of reported snoring validity. Chest. 1991;99:531–2. doi: 10.1378/chest.99.3.531. [DOI] [PubMed] [Google Scholar]
- 13.Van Brunt DL, Lichstein KL, Noe SL, Aguillard RN, Lester KW. Intensity pattern of snoring sounds as a predictor for sleep-disordered breathing. Sleep. 1997;20:1151–6. doi: 10.1093/sleep/20.12.1151. [DOI] [PubMed] [Google Scholar]
- 14.Fiz J, Abad J, Jane R, et al. Acoustic analysis of snoring sound in patients with simple snoring and obstructive sleep apnoea. Eur Respir J. 1996;9:2365–70. doi: 10.1183/09031936.96.09112365. [DOI] [PubMed] [Google Scholar]
- 15.Ng AK, Koh TS, Baey E, Lee TH, Abeyratne UR and Puvanendran K. Could formant frequencies of snore signals be an alternative means for the diagnosis of obstructive sleep apnea? Sleep Med. 2008;9:894–8. doi: 10.1016/j.sleep.2007.07.010. [DOI] [PubMed] [Google Scholar]
- 16.Ng AK, Koh TS, Abeyratne U, Puvanendran K. Investigation of obstructive sleep apnea using nonlinear mode interactions in nonstationary snore signals. Ann Biomed Eng. 2009;37:1796–806. doi: 10.1007/s10439-009-9744-8. [DOI] [PubMed] [Google Scholar]
- 17.Solà-Soler J, Jane R, Fiz JA, Morrera J. Pitch analysis in snoring signals from simple snorers and patients with obstructive sleep apnea. Conf Proc IEEE Eng Med Biol Soc. 2002;2:1527–8. [Google Scholar]
- 18.Abeyratne UR, Wakwella AS, Hukins C. Pitch jump probability measures for the analysis of snoring sounds in apnea. Physiol Meas. 2005;22:779–98. doi: 10.1088/0967-3334/26/5/016. [DOI] [PubMed] [Google Scholar]
- 19.Fiz JA, Jané R, Solà-Soler J, Abad J, Garcíia MA, Morera J. Continuous analysis and monitoring of snores and their relationship to the apnea- hypopnea index. Laryngoscope. 2010;120:854–62. doi: 10.1002/lary.20815. [DOI] [PubMed] [Google Scholar]
- 20.Cavusoglu M, Ciloglu T, Serinagaoglu Y, Kamasak M, Erogul O, Akcam T. Investigation of sequential properties of snoring episodes for obstructive sleep apnoea identification. Physiol Meas. 2008;29:879–98. doi: 10.1088/0967-3334/29/8/003. [DOI] [PubMed] [Google Scholar]
- 21.Fukunaga K. 2nd ed. London: Academic Press; 1990. Introduction to statistical pattern recognition. [Google Scholar]
- 22.Deller JR, Hansen JHL, Proakis JL. 2nd ed. New York: Institute of Electrical and Electronics Engineers Press; 2000. Discrete-time processing of speech signals. [Google Scholar]
- 23.Simon-Tuval T, Reuveni H, Greenberg-Dotan S, Oksenberg A, Tal A, Tarasiuk A. Low socioeconomic status is a risk factor for CPAP acceptance among adult OSAS patients requiring treatment. Sleep. 2009;32:545–52. doi: 10.1093/sleep/32.4.545. [DOI] [PMC free article] [PubMed] [Google Scholar]
- 24.Kump K, Whalen C, Tishler PV, et al. Assessment of the validity and utility of a sleep-symptom questionnaire. Am J Respir Crit Care Med. 1994;150:735–41. doi: 10.1164/ajrccm.150.3.8087345. [DOI] [PubMed] [Google Scholar]
- 25.Rotem AY, Sperber AD, Krugliak P, Freidman B, Tal A, Tarasiuk A. Polysomnography and actigraphy evidence of sleep fragmentation in irritable bowel syndrome. Sleep. 2003;26:746–52. doi: 10.1093/sleep/26.6.747. [DOI] [PubMed] [Google Scholar]
- 26.Johns MW. A new method for measuring daytime sleepiness: the Epworth sleepiness scale. Sleep. 1991;14:540–54. doi: 10.1093/sleep/14.6.540. [DOI] [PubMed] [Google Scholar]
- 27.Iber C, Ancoli-Israel S, Chesson AL, Quan SF. Westchester, IL: American Academy of Sleep Medicine; 2007. The AASM manual for the scoring of sleep and associated events: rules, terminology, and technical specifications. [Google Scholar]
- 28.Bland J, Altman DJ. Statistical methods for assessing agreement between two methods of clinical measurement. Lancet. 1986;1:307–10. [PubMed] [Google Scholar]
- 29.White DP, Gibb TJ, Wall JM, Westbrook PR. Assessment of accuracy and analysis time of a novel device to monitor sleep and breathing in the home. Sleep. 1995;18:115–26. doi: 10.1093/sleep/18.2.115. [DOI] [PubMed] [Google Scholar]
- 30.Landis JR, Koch GG. The measurement of observer agreement for categorical data. Biometrics. 1977;33:159–74. [PubMed] [Google Scholar]
- 31.Abeyratne UR, Karunajeewa A, Hukins C. Mixed-phase modeling in snore sound analysis. Med Biol Eng Comput. 2007;45:791–806. doi: 10.1007/s11517-007-0186-x. [DOI] [PubMed] [Google Scholar]
- 32.Oksenberg A, Silverberg DS. The effect of body posture on sleep-related breathing disorders: facts and therapeutic implications. Sleep Med Rev. 1998;2:139–62. doi: 10.1016/s1087-0792(98)90018-1. [DOI] [PubMed] [Google Scholar]
- 33.Malhotra A, White D. Seminar: obstructive sleep apnoea. Lancet. 2002;360:237–45. doi: 10.1016/S0140-6736(02)09464-3. [DOI] [PubMed] [Google Scholar]
- 34.Jordan AS, Wellman A, Heinzer RC, et al. Mechanisms used to restore ventilation after partial upper airway collapse during sleep in humans. Thorax. 2007;62:861–7. doi: 10.1136/thx.2006.070300. [DOI] [PMC free article] [PubMed] [Google Scholar]
- 35.Cathcart RA, Hamilton DW, Drinnan MJ, Gibson GJ, Wilson JA. Night- to-night variation in snoring sound severity: one night studies are not reliable. Clin Otolaryngol. 2010;35:198–203. doi: 10.1111/j.1749-4486.2010.02127.x. [DOI] [PubMed] [Google Scholar]
- 36.Grunstein R. Snorenheit 911-searching for the `truth' about snoring. Sleep Med Rev. 2004;8:429–31. doi: 10.1016/j.smrv.2004.09.005. [DOI] [PubMed] [Google Scholar]
- 37.Young T, Evans L, Finn L, Palta M. Estimation of the clinically diagnosed proportion of sleep apnea syndrome in middle aged men and women. Sleep. 1997;9:705–6. doi: 10.1093/sleep/20.9.705. [DOI] [PubMed] [Google Scholar]
- 38.Phillips B. Improving access to diagnosis and treatment of sleep- disordered breathing. Chest. 2007;132:1418–20. doi: 10.1378/chest.07-1793. [DOI] [PubMed] [Google Scholar]
- 39.Flemons WW, Douglas NJ, Kuna ST, Rodenstein DO, Wheatley J. Access to diagnosis and treatment of patients with suspected sleep apnea. Am J Respir Crit Care Med. 2004;169:668–72. doi: 10.1164/rccm.200308-1124PP. [DOI] [PubMed] [Google Scholar]
- 40.Reuveni H, Schweiter E, Tarasiuk A. A cost-effectiveness analysis of alternative at-home of in-laboratory technologies for the diagnosis of obstructive sleep apnea syndrome. Med Decis Making. 2001;21:451–8. doi: 10.1177/0272989X0102100603. [DOI] [PubMed] [Google Scholar]
Associated Data
This section collects any data citations, data availability statements, or supplementary materials included in this article.
Supplementary Materials
Distribution histogram of Inter-event Silence durations. Histogram of silence durations for the system-design group marked as obstructive events by polysomnography technologies. Note that 95% of silence periods are < 90 sec (arrowhead). A threshold of 90 sec was set as the maximum length investigated when extracting the inter-event silence feature.