

Abstract
BACKGROUND AND PURPOSE
APETx2, a toxin from the sea anemone Anthropleura elegantissima, inhibits acid-sensing ion channel 3 (ASIC3)-containing homo- and heterotrimeric channels with IC50 values < 100 nM and 0.1–2 µM respectively. ASIC3 channels mediate acute acid-induced and inflammatory pain response and APETx2 has been used as a selective pharmacological tool in animal studies. Toxins from sea anemones also modulate voltage-gated Na+ channel (Nav) function. Here we tested the effects of APETx2 on Nav function in sensory neurones.
EXPERIMENTAL APPROACH
Effects of APETx2 on Nav function were studied in rat dorsal root ganglion (DRG) neurones by whole-cell patch clamp.
KEY RESULTS
APETx2 inhibited the tetrodotoxin (TTX)-resistant Nav 1.8 currents of DRG neurones (IC50, 2.6 µM). TTX-sensitive currents were less inhibited. The inhibition of Nav 1.8 currents was due to a rightward shift in the voltage dependence of activation and a reduction of the maximal macroscopic conductance. The inhibition of Nav 1.8 currents by APETx2 was confirmed with cloned channels expressed in Xenopus oocytes. In current-clamp experiments in DRG neurones, the number of action potentials induced by injection of a current ramp was reduced by APETx2.
CONCLUSIONS AND IMPLICATIONS
APETx2 inhibited Nav 1.8 channels, in addition to ASIC3 channels, at concentrations used in in vivo studies. The limited specificity of this toxin should be taken into account when using APETx2 as a pharmacological tool. Its dual action will be an advantage for the use of APETx2 or its derivatives as analgesic drugs.
Keywords: APETx2, ASIC, Nav 1.8, peptide toxin, DRG, inflammatory pain, acid-induced pain, sea anemone toxins
Introduction
Voltage-gated Na+ (Nav) channels mediate the initial upstroke of the action potential (AP) in excitable tissues. They are made of a large pore-forming Navα subunit composed of four repeated domains, each containing six transmembrane segments, and associated auxiliary β subunits (Catterall et al., 2005; Patino and Isom, 2010). Nine different Navα subunits have been reported so far. They can be classified into two groups based on their sensitivity to the Japanese puffer fish toxin tetrodotoxin (TTX): TTX-sensitive (TTX-S: Nav 1.1, −1.2, −1.3, −1.6 and −1.7) and TTX-resistant (TTX-R: Nav 1.5, −1.8 and −1.9) channels (Catterall et al., 2005). Nav 1.1, −1.6, −1.7, −1.8 and −1.9 are the major isoforms present in the peripheral nervous system (Catterall et al., 2005; Berta et al., 2008; channel nomenclature follows Alexander et al., 2011). Differences between Navα isoforms include their voltage dependence and their inactivation kinetics, with the TTX-R channels showing slower inactivation (Catterall et al., 2005). Changes in the expression and function of Nav channels occur in pathological situations such as peripheral nerve injury and contribute to altered pain sensing (rev. in Dib-Hajj et al., 2010).
Acid-sensing ion channels (ASICs) are H+-gated Na+-permeable neuronal channels (Wemmie et al., 2006; Kellenberger, 2008; Holzer, 2009) and are expressed in neurones of the central and the peripheral nervous system (Krishtal, 2003; Wemmie et al., 2006). Functional ASICs are made of homo- or heterotrimeric assemblies of subunits arising from three different genes including two splice variants [ASIC1a, −1b, −2a, −2b and −3 (Wemmie et al., 2006; Jasti et al., 2007; Gonzales et al., 2009)]. ASIC subunits of the peripheral nervous system are frequently co-expressed with nociceptive markers in small diameter neurones of dorsal root ganglia (DRG) (Poirot et al., 2006; Wemmie et al., 2006). When activated by a pH drop to <pH 7, endogenous ASICs are able to induce APs in rodent neurones of the central and peripheral nervous system (Vukicevic and Kellenberger, 2004; Poirot et al., 2006). Owing to their expression pattern and functional responses, ASICs were proposed to be involved in acid-induced nociception in inflammatory conditions where the extracellular pH is decreased. Studies with knockout mice indicated a role for ASIC3 in inflammatory and acid-induced pain sensation (Price et al., 2001; Chen et al., 2002; Sluka et al., 2003).
The toxin APETx2 of the sea anemone Anthropleura elegantissima inhibits, as a purified native preparation (Diochot et al., 2004) or as recombinantly or synthetically produced peptide (Jensen et al., 2009; Anangi et al., 2010; Karczewski et al., 2010), homotrimeric ASIC3 with IC50 values <100 nM. In rat DRG neurones, ASIC3 is mainly present in heterotrimeric channels, which require higher APETx2 concentrations for inhibition (IC50 0.1–2 µM) or are APETx2-insensitive (Diochot et al., 2004). In vivo studies with rats have shown that both intrathecal and intraplantar administrations of APETx2 at concentrations of 0.02–20 µM prevent acid-induced, inflammatory and postoperative pain (Deval et al., 2008; Karczewski et al., 2010; Deval et al., 2011).
Many sea anemone toxins are known to slow or to inhibit Na+ channel inactivation by binding to receptor site 3. The location of the receptor site 3 on the extracellular side of transmembrane segment IVS4 suggests that these toxins slow inactivation by preventing the outward movement of the voltage sensor (Rogers et al., 1996; Catterall et al., 2007; Smith and Blumenthal, 2007). The toxin APETx1 was shown to inhibit voltage-gated K+ (Kv) channels (Diochot et al., 2003; Zhang et al., 2007). APETx2, which has a high sequence similarity with APETx1, did not affect a number of different Kv channels at 300 nM and showed partial inhibition of Kv3.4 only at 3 µM (Diochot et al., 2004).
The high concentrations of APETx2 that were probably attained in several animal studies prompted us to investigate a possible effect of APETx2 on sensory neurone Nav channels. We show in this study that APETx2 at 1 µM, a concentration used in animal and in in vitro studies to block endogenous ASIC3-like channels, substantially inhibited TTX-R Nav 1.8 currents and caused a small inhibition of TTX-S currents in rat DRG neurones. The inhibition of Nav 1.8 currents was due to a rightward shift in the voltage dependence of activation and a reduction in the maximal macroscopic conductance. In current-clamp experiments, APETx2 reduced the number of APs induced by current injection. Experiments with cloned Nav 1.8 channels expressed in Xenopus oocytes confirm the inhibition of Nav currents by APETx2. The limited specificity of this toxin should be taken into account when using it as a pharmacological tool. For the use of APETx2 or derivatives as analgesic drugs, this dual action would certainly be an advantage.
Methods
DRG isolation and culture
All animal care and experimental procedures were carried out according to the Swiss Federal Law on Animal Welfare and approved by the Committee on Animal Experimentation of the Canton de Vaud. Adult male Wistar rats (Charles River, l'Arbresle Cedex, France) were killed using CO2, and lumbar DRGs were removed bilaterally. The isolated DRGs were incubated at 37°C for 2 h in Neurobasal A medium (Invitrogen, Zug, Switzerland) containing type P collagenase (0.125%;, Roche, Basel, Switzerland) and trypsinized (0.25%; Invitrogen) for 30 min at 37°C in divalent cation-free PBS solution. Ganglia were then triturated with a disposable 1 mL plastic tip and plated on high molecular weight poly-lysine (0.1 mg·mL−1, MW >300 000; Sigma, Buchs, Switzerland) coated coverslips. neurones were held at 37°C overnight, and medium was replaced the following morning by L15 Leibovitz medium (Invitrogen) supplemented with 10% fetal calf serum (FCS; Gibco, Zug, Switzerland), 5 mM HEPES and pH adjusted to 7.4 using NaOH. neurones were kept at 4°C and used within 24 h of plating (Blair and Bean, 2002).
Recombinant expression of ASIC3
CHO cells were transfected with the rat ASIC3 cDNA clone in the pEAK8 expression vector and grown in DMEM/F12 (Invitrogen) medium supplemented with 3.6% FCS and 1% penicillin/streptomycin (Invitrogen). Puromycin (10 µg·mL−1; PAA Laboratories, Pasching, Austria) was added to the culture medium to achieve stable selection of ASIC3-expressing cells.
Electrophysiology on mammalian cells
Measurements were carried out with an EPC10 patch clamp amplifier (HEKA Electronics, Lambrecht, Germany). Data acquisition was performed using HEKA's Patchmaster software. Voltage was not corrected for the liquid junction potential. The sampling interval was set to 50 µs (20 kHz) and low-pass filtering to 5.0 kHz for all experiments except for ASIC3, Kv experiments, and the Nav use dependence experiments, for which the sampling interval was 100 µs (10 kHz), and the low pass filter was set to 3.0 kHz. Toxin was applied using the gravity-driven MPRE8 perfusion system (Cell MicroControls, Norfolk, VA, USA). Neurones were continuously perfused with either the control or the toxin-containing solution, and voltage protocols were applied during steady-state toxin application. Pipettes were pulled from thin-wall borosilicate glass and had resistances between 0.9 and 3 MΩ when filled with pipette solution. Series resistance compensation was set to 85–95% in all experiments. Voltage-clamp protocols were applied at a sweep frequency of 0.05 Hz (20 s pulse interval). The neurone diameter was estimated from the average of the longest and shortest axes as measured through an eyepiece micrometer scale. Only small-diameter DRG neurones (<32 µm) were included in this study. Capacity transients were partially cancelled using the internal clamp circuitry. The remaining transients and leak were subtracted using the P/8 procedure from a holding potential of −80 mV.
Solutions
The external solution for CHO and current-clamp experiments was composed of the following (in mM): 140 NaCl, 4 KCl, 1 MgCl2, 2 CaCl2, 10 HEPES, 10 MES (2-(N-morpholino)ethanesulfonic acid), 10 glucose and pH adjusted to 7.4 or 6.0 with NaOH. The external solution for DRG voltage-clamp experiments was composed of the following (in mM): 85 choline–Cl, 20 TEA–Cl, 35 NaCl, 3 KCl, 1 MgCl2, 1 CaCl2, 0.1 CdCl2, 10 glucose, 10 HEPES and pH was adjusted to 7.4 using Tris. The pipette solution for measurements of ASIC3-expressing CHO cells was composed of the following (in mM): 90 CsOH, 90 gluconic acid, 10 NaCl, 10 KCl, 1 MgCl2, 60 HEPES, 10 EGTA and pH adjusted to 7.3 using CsOH. For whole-cell voltage-clamp experiments with DRG neurones, we used the following pipette solution (in mM): 70 Cs-Gluconate, 70 CsCl, 3.5 NaCl, 2 MgCl2, 0.1 CaCl2, 1.1 EGTA, 10 HEPES and pH adjusted to 7.3 with CsOH. Intracellular solution for current-clamp experiments contained the following (in mM): 140 KCl, 0.5 EGTA, 5 HEPES and 3 Mg-ATP adjusted to pH 7.3 with KOH. Prior to the experiment, 0.1% BSA (fatty acid-free BSA; Sigma) was added to all external solutions. After establishment of the whole-cell configuration, neurones were allowed to equilibrate with the pipette solution for at least 5 min.
Two-electrode voltage clamp of Xenopus oocytes
Xenopus laevis stage V-VI oocytes were removed and treated with collagenase (Sigma type I) for defolliculation. cRNA of human Nav 1.8 channels (Ekberg et al., 2006) was synthesized using an mMessage mMachine cRNA transcription kit (Ambion Inc., Austin, TX, USA) and injected at 20–40 ng per oocyte. Oocytes were kept at 18°C in ND96 solution containing 96 mM NaCl, 2 mM KCl, 1 mM CaCl2, 2 mM MgCl2, 5 mM HEPES, 5 mM pyruvic acid, 50 µg·mL−1 gentamicin (pH 7.4) and fetal horse serum (2.5%). Currents were recorded 2–6 days after cRNA injection under voltage clamp (Axoclamp 900A, Molecular Devices, CA) using two standard glass microelectrodes (0.5–1 MΩ) filled with 3 M KCl solution. Stimulation, data acquisition (10 kHz sampling, 2 kHz low pass filter) and analysis were performed using pCLAMP software (Version 10, Molecular Devices). All experiments were performed at 20–21°C in ND96 solution containing 0.1% BSA.
Toxin handling and preparation
The synthetic APETx2 toxin from Smartox (La Tronche, France) or synthesized by a laboratory involved in the study (Jensen et al., 2009) was used. The lyophilized toxin was re-suspended in deionized water (supplemented with 0.1% BSA). Aliquots were frozen at −20°C until use. APETx2 stock solution was diluted in 0.1% BSA-containing bath solution before the experiment. The results obtained with APETx2 from the different sources were not different from each other. TTX from Latoxan (Valence, France) was stored as a 1 mM stock solution and diluted in the measuring solution containing 0.1% BSA.
Data analysis and statistics
Normalized concentration–inhibition curves were fitted using the Hill function: In = 1/(1 + (IC50/c)nH), where In is the inhibition, IC50 is the concentration of half-maximal inhibition, c the concentration of inhibitor and nH is the Hill number. Voltage dependence of activation was obtained from conductance–voltage curves using a Boltzmann equation: G(V) =Gmax/(1 + exp[(V−V0.5)/k)], where G is the conductance, Gmax the maximal conductance, V the voltage, V0.5 the voltage of half-maximal activation and k the slope factor. Currents were converted to conductance at each voltage using the following equation: G(V) =I/(V−Vrev), where I is the current and Vrev the reversal potential obtained for each current–voltage (I-V) curve by linear interpolation. Kinetics of inactivation were obtained by fitting a single exponential to the falling phase of the current traces at each voltage: I(V) =Ip(V)*exp(−t/τinactivation(V)), with I as the current, Ip the peak inward current, t the time and τinactivation the time constant of inactivation. Kinetics of recovery from inactivation were obtained by fitting the data to three exponential components: I=A0+Afast*exp(−t/τfast) +Amid*exp(−t/τmid) +Aslow*exp(−t/τslow), with Afast, Amid and Aslow, the relative amplitudes of the components; A0 the initial amplitude; A0+Afast+Amid+Aslow= 1; and τfast, τmid and τslow the time constants of the different components. Data analysis was performed using Heka's Fitmaster and Origin 8.5 software (OriginLab, Northampton, MA, USA). Data are presented as mean ± SEM. Direct comparison between values from paired experiments were performed using paired Student's t-test for comparison of two conditions and with one-way repeated-measures anova followed by Fisher's post hoc test for comparison of three conditions.
Results
Inhibition of ASIC3 by APETx2
In order to validate the synthetic toxin, the inhibition of ASIC3 by synthetic APETx2 was measured using whole-cell voltage clamp from CHO cells expressing homotrimeric rat ASIC3. Typical traces of ASIC3 currents in the absence and presence of 500 nM APETx2 are shown in Figure 1A, and the concentration dependence of ASIC3 inhibition by APETx2 is plotted in Figure 1B. The IC50 value obtained from a Hill fit (see Methods) was 87 ± 9 nM (n= 9), which is close to published values (Diochot et al., 2004; Jensen et al., 2009; Anangi et al., 2010; Karczewski et al., 2010).
Figure 1.
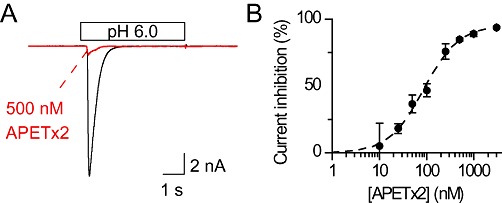
Concentration-dependent inhibition of ASIC3 channels by synthetic APETx2 toxin. (A) CHO cells expressing rat ASIC3 channels were incubated 30 s with or without APETx2 in the pH 7.4 bath solution then exposed for 5 s to a pH 6.0 solution with or without 500 nM APETx2. (B) Concentration dependence of ASIC3 current inhibition by APETx2. The inhibition was calculated for each toxin concentration from the measured ASIC3 peak current induced by pH 6, normalized to the peak current in the absence of toxin. Stimulations were performed every 35 s for 5 s, to allow recovery of channels. The dashed line represents a Hill fit to the experimental data points (n > 3).
Inhibition of voltage-gated Na+ currents in DRG neurones by APETx2
In whole-cell voltage-clamp experiments on acutely dissociated rat DRG neurones, 1 µM APETx2 reversible inhibited the Nav inward current. A typical experiment is illustrated in Figure 2, showing current traces of an activation curve from a neurone under different conditions. Panel i shows the Nav current without any inhibitor, panel ii shows the Nav current in the presence of 1 µM APETx2 and panel iii represents the difference of the two, thus the total APETx2-sensitive current. APETx2 washout was rapid and complete in <20 s. Panels iv–vi show, from the same cell, traces measured in the presence of 300 nM TTX in order to leave only the TTX-R current, without (panel v) or with (panel vi) 1 µM APETx2. Panel vi shows the difference, thus the APETx2-sensitive component of the TTX-R current. The traces shown in the lowest row were obtained by subtraction of the traces of the middle row from the corresponding traces of the top row, yielding the TTX-S component without (panel vii) or with APETx2 (panel viii). In order to quantify the inhibition of TTX-S currents by APETx2, the TTX-R, APETx2-sensitive current (panel vi) was subtracted from the total APETx2-sensitive current (panel iii), yielding the TTX-S APETx2-sensitive current (panel ix). This analysis allowed calculation of the current inhibition of the two Nav current components, indicating that 1 µM APETx2 inhibited 21 ± 6% of the TTX-S and 42 ± 5% of the TTX-R Nav peak current amplitude (measured at −20 and 0 mV, respectively; n= 4).
Figure 2.
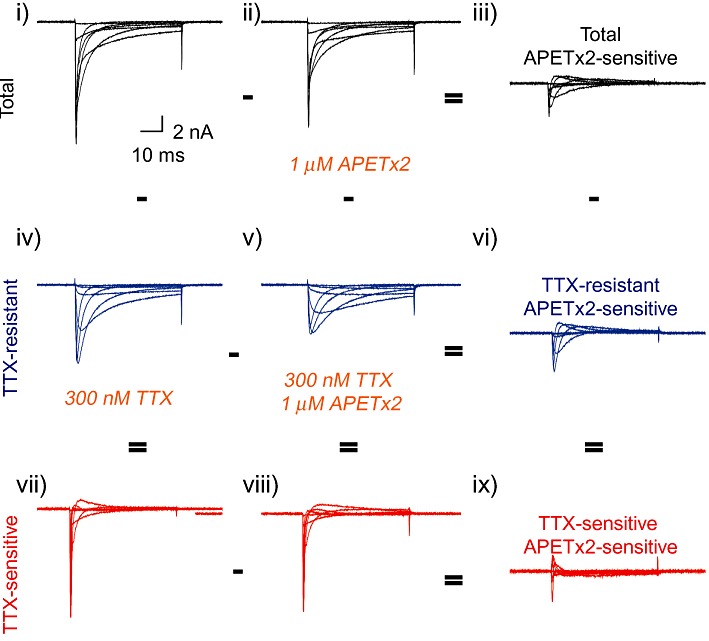
Inhibition of voltage-gated Na+ currents in rat DRG neurones by APETx2. Currents were recorded from acutely dissociated rat DRG neurones. Voltage-gated Na+ currents were elicited by 50 ms voltage steps from a holding potential of −80 mV to test potentials of −40 to +20 mV in 10 mV increments, in the absence of any inhibitor (i), in the presence of 1 µM APETx2 (ii), 300 nM TTX (iv) or both 300 nM TTX and 1 µM APETx2 (v). The total APETx2-sensitive and the TTX-R APETx2-sensitive currents are shown in panels iii and vi respectively. The TTX-S component in the absence (vii) or presence (viii) of APETx2 was obtained by subtracting the TTX-R component (middle row) from the total currents (upper row). Current traces of a representative experiment in DRG neurones are shown.
It has previously been shown that Nav 1.8 currents have slower inactivation kinetics than TTX-S Nav currents, and that Nav 1.9 currents inactivate so slowly that they appear as almost non-inactivating during the 100 ms of the depolarizing pulse (Cummins et al., 1999). In our experimental conditions, we did not see a Nav 1.9-like current (Figure 2, panel iv), because in these conditions Nav 1.9 currents, which require a very negative holding potential for activity, was most likely inactivated (Cummins et al., 1999; Renganathan et al., 2002). The TTX-R APETx2-sensitive component therefore corresponds mostly to Nav 1.8 current. As APETx2 showed strongest inhibition of this Nav current component, we focused the remainder of this study on Nav 1.8 current inhibition by APETx2.
Inhibition of Nav 1.8 currents of rat DRG neurones by APETx2
To isolate the Nav 1.8-mediated currents, we used the protocol shown in the upper panel of Figure 3A. In the typical experiment illustrated in the lower panel of Figure 3A, 1 µM APETx2 inhibited ∼45% of the peak Nav 1.8 inward current at 0 mV. The current–voltage curve of this experiment is shown in Figure 3B. The activation conductance–voltage curve of the Nav 1.8 current in the absence (control and washout) or presence of 1 µM APETx2 is shown in Figure 3C, with the lines representing a fit to the Boltzmann equation. The parameters derived from these data are shown in Table 1. APETx2 induced a positive shift in the voltage dependence of activation, and decreased Gmax. Toxin washout led to functional parameters close to control conditions (Figure 3C, Table 1).
Figure 3.
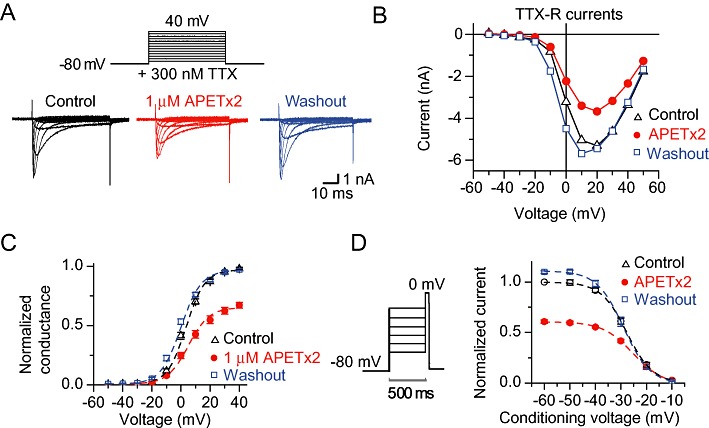
Voltage dependence of Nav 1.8 currents in the absence and presence of APETx2. Currents were recorded from acutely dissociated DRG neurones, with all bath solutions containing 300 nM TTX. (A) Top panel, illustration of the voltage protocol used. Currents were elicited by 50 ms voltage steps from −50 to +40 mV in 10 mV increments from a holding potential of −80 mV. The lower panel illustrates typical current traces obtained without (control), with 1 µM APETx2 and after washout. (B) Current-voltage (I-V) curve of the experiment of panel A without (control), with and after washout of 1 µM APETx2. (C) Conductance-voltage plot in the absence (control), presence and after washout of 1 µM APETx2. The lines represent a fit to the Boltzmann equation (see Table 1 for fit parameters), n= 9. (D) The steady-state inactivation protocol, illustrated in the left panel, was composed of a 500 ms conditioning pulse, directly followed by a 50 ms test pulse to 0 mV. Normalized current amplitudes are plotted in the right panel as a function of the conditioning potential. The lines represent a fit to the Boltzmann equation (see Table 1 for fit parameters), n= 12.
Table 1.
Properties of Nav 1.8 currents in the presence or absence of APETx2
| Condition | Controla | Toxin |
|---|---|---|
| [APETx2] (µM) | 0 | 1 |
| Activation | ||
| V0.5 (mV) | 3.1 ± 0.8 | 6.0 ± 1.0** |
| k (mV) | 7.2 ± 0.4 | 8.6 ± 0.4*** |
| Normalized Gmax | 1 | 0.69 ± 0.03*** |
| n | 9 | |
| Steady-state inactivation | ||
| V0.5IN (mV) | −27.5 ± 1.1 | −24.9 ± 1.0*** |
| k (mV) | 4.7 ± 0.2 | 5.7 ± 0.3** |
| Normalized Imax (at 0 mV) | 1 | 0.55 ± 0.02*** |
| n | 12 | |
| τinactivation (ms) | ||
| at 0 mV | 6.9 ± 0.5 | 14 ± 1.1*** |
| at +20 mV | 1.9 ± 0.1 | 5.1 ± 0.5*** |
| n | 11–22 |
Experimental conditions are described under Methods. Values of Imax and Gmax are normalized to the control situation before toxin exposure.
The indicated control values were obtained before administration of the toxin. Parameters of voltage-dependent gating obtained after washout of the drug are as follows (P-value relative to toxin condition). Activation, V0.5=−1.1 ± 1.0 mV (P= 4.5*10−4), k= 7.6 ± 0.3 mV (P= 1.2*10−4), Gmax= 98 ± 2% of control condition (P < 10−5); steady-state inactivation, V0.5=−29.1 ± 1.0 mV (P < 10−5), k= 4.7 ± 0.2 mV (P= 0.002), Gmax= 110 ± 5% of control (P < 10−5).
The voltage dependence of steady-state inactivation (SSIN) was measured using the protocol shown in the left panel of Figure 3D. The normalized test current amplitude is plotted as a function of the conditioning voltage in the right panel of Figure 3D, with the lines representing a fit to the Boltzmann equation. APETx2 shifted the voltage dependence of SSIN positively and decreased the current amplitude. Summary results from these experiments are shown in Table 1. Washout led to functional parameters similar to those obtained in control conditions before toxin application (Figure 3D, Table 1). Taken together, these data show that APETx2 induced, for Nav 1.8 currents, a small shift in the voltage dependence of activation and inactivation to more depolarized values, decreased Gmax and increased the slope factor k. These effects were readily reversible.
The concentration dependence of Nav 1.8 peak current inhibition by APETx2 is illustrated by traces of a representative experiment in Figure 4A, and the current inhibition is shown as a function of the toxin concentration with the derived IC50, in Figure 4B. In these experiments, the Nav 1.8 current was again isolated by the presence of 300 nM TTX. Figure 4C illustrates the inhibition of Nav 1.8 currents at high APETx2 concentration (20 µM) at different voltages. The kinetics of APETx2 binding and unbinding were measured by eliciting Nav 1.8 current responses by 50 ms depolarizations at different times after the start of 1 µM APETx2 perfusion (binding) and after the start of the washout of APETx2 (unbinding), as presented in Figure 4D. The rate constant of unbinding, koff was 0.29 ± 0.04 s−1 (n= 5). The observed rate constant of APETx2 binding was 0.67 ± 0.04 s−1 (n= 6) at 1 µM, corresponding to an association rate constant of 3.8 × 10⁵ M−1 s−1 after correction for the contribution of the koff to the observed kinetics of block.
Figure 4.
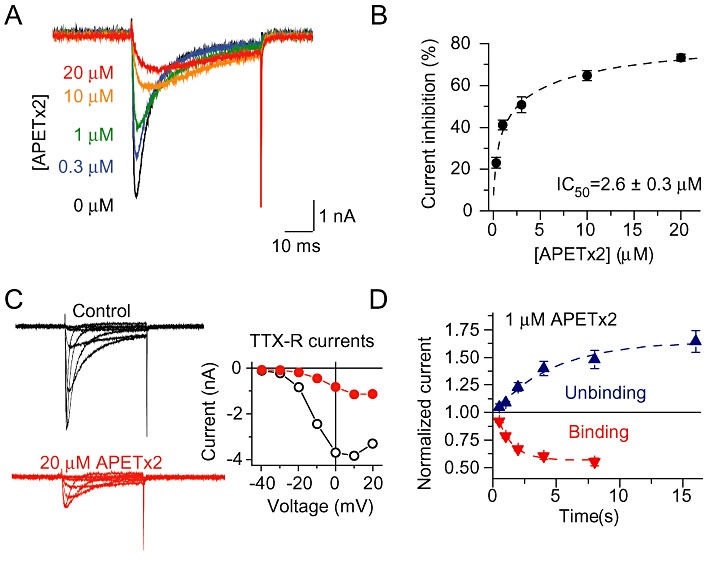
Concentration dependence and kinetics of APETx2 action on Nav 1.8 currents. Currents were recorded from acutely dissociated DRG neurones, with all bath solutions containing 300 nM TTX. (A) Nav 1.8 currents elicited by depolarizations to 0 mV from a holding potential of −80 mV in the presence of the indicated concentrations of APETx2 from a typical experiment. (B) Concentration dependence of current inhibition by APETx2, measured at 0 mV. The line represents a fit to the Hill equation, assuming that at high toxin concentrations inhibition is complete; for fit parameters see text (n≥ 3). (C) Illustration of the effect of high APETx2 concentration (20 µM) on Nav 1.8 currents. Left panels show traces from a typical experiment with 0 µM (control) or 20 µM APETx2. The I-V curves of these experiments are shown in the right panel. (D) Binding and unbinding kinetics of APETx2. The Nav 1.8 current increase (unbinding) or decrease (binding), normalized to the current amplitude before the solution change measured at a pulse potential of 0 mV, is plotted as a function of the time after the start of the APETx2 washout (unbinding) or the APETx2 perfusion (binding). The lines represent exponential fits to the data points (n= 5–6). Data are not corrected for the time necessary for the solution change, which had a 10–90% change time ≍30 ms at the outlet of the perfusion system.
To determine whether inhibition was use-dependent, Nav 1.8 currents were elicited by depolarizations to +20 mV at different frequencies in the absence or presence of 1 µM APETx2. To correct for drug-independent inactivation with increasing stimulation frequency, responses in the presence of 1 µM APETx2 were normalized to the responses obtained at the same frequency in the absence of APETx2. Figure S1 shows representative traces and plots the normalized inhibition as a function of the pulse number at different frequencies, demonstrating that the inhibition was not use-dependent.
APETx2 modulates the inactivation time course of Nav 1.8 channels in rat DRG neurones
Exposure to APETx2 induced a slowing of the open-channel inactivation, as illustrated in Figure 5A at pulse potentials of 0 mV (left panel) and +20 mV (right panel). APETx2 at 1 µM increased the time constant of open channel inactivation at 0 mV (n= 23, P < 10−8) and at +20 mV (n= 20, P < 10−5; Figure 5B).
Figure 5.
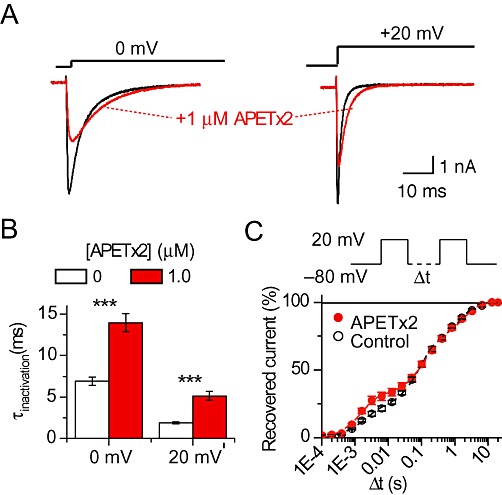
APETx2 modulates the kinetics of Nav 1.8 channel gating. Currents were recorded from acutely-dissociated DRG neurones, with all bath solutions containing 300 nM TTX. (A) APETx2 slows inactivation kinetics. Representative traces obtained for test potentials of 0 or +20 mV in the presence or absence of 1 µM APETx2 are shown. (B) The falling phase of the individual current traces was fitted to a single exponential equation (see Methods), yielding the time constant of inactivation (τinactivation). Values of τinactivation obtained at test potentials of 0 and +20 mV in the presence or absence of 1 µM APETx2 are shown, ***P < 0.001, significant effect of APETx2; n= 20–23, paired t-test. (C) Recovery from inactivation was determined by measuring the current evoked by two 100 ms depolarizations to +20 mV, separated by an interval of increasing duration at −80 mV as illustrated in the top panel. The current amplitude of the second depolarization, normalized to that of the first depolarization, is plotted as a function of the interval Δt for the situation with or without (control) 1 µM APETx2. Three exponential components were necessary to fit the recovery time course (n= 5). Fit parameters, as time constant τ (% relative weight of the component) are as follows with *P < 0.05 and **P < 0.001, significant effect of 1 µM APETx2: (control values given first) the fast component 2.03 ± 0.10 ms ((20 ± 2%) and 1.64 ± 0.06 ms* (31 ± 4% **), the intermediate component 95 ± 12 ms (48 ± 2%) and 139 ± 18 ms** (40 ± 4% *) and the slow component 1600 ± 200 ms (32 ± 1%) and 2030 ± 160 ms (28 ± 2%).
Recovery from inactivation was studied using a standard two-pulse protocol (Figure 5C top panel). Two 100 ms depolarizations to +20 mV were separated by an increasing interval Δt at −80 mV. The peak current amplitude elicited by the second depolarization normalized to that of the first depolarization is plotted as a function of the interval Δt in Figure 5C. Three exponential components were required to fit the recovery time course (see Methods). While the slow component was not affected by the toxin, the fast and intermediate components were altered in the presence of 1 µM APETx2, leading to a slight acceleration of the initial phase of recovery.
Inhibition of recombinant Nav 1.8 channels by APETx2
To confirm the inhibition of Nav 1.8 currents with the cloned channels, we applied the toxin to Xenopus oocytes expressing human Nav 1.8 channels. Figure 6A shows traces of currents elicited by depolarization from −80 to 0 mV in the presence of the indicated concentrations of APETx2, from a typical experiment. Figure 6B plots the concentration dependence of the inhibition by APETx2. At 30 µM, the highest concentration used, inhibition was 60 ± 2% (n= 6). Although the curve appears to saturate at a maximal inhibition of slightly more than 60%, it is equally possible that at higher concentrations inhibition would be complete. In Figure 6B, the black solid line represents the fit of the data to the Hill equation, yielding an IC50 of 6.6 ± 0.5 µM and a maximal inhibition of 65 ± 2%, and the red line is from a fit in which maximal inhibition was set to 100%, yielding an IC50 of 18.7 ± 1.4 µM (n= 4). The observed IC50 is therefore three- to sevenfold higher than the value obtained from DRG neurones. The current–voltage curve in the absence and presence of 30 µM APETx2 is plotted in Figure 6C. APETx2 at 30 µM shifted the V0.5 of activation from 17.1 ± 1.3 to 26.6 ± 1.6 mV (Figure 6D; n= 8, P= 0.003). Due to significant time-dependent increase in amplitude, the inhibition of Gmax by APETx2 could not be quantitatively assessed (Figure 6D). In conclusion, the oocyte experiments confirm the current inhibition and the change in voltage dependence of activation of Nav 1.8 channels by APETx2.
Figure 6.
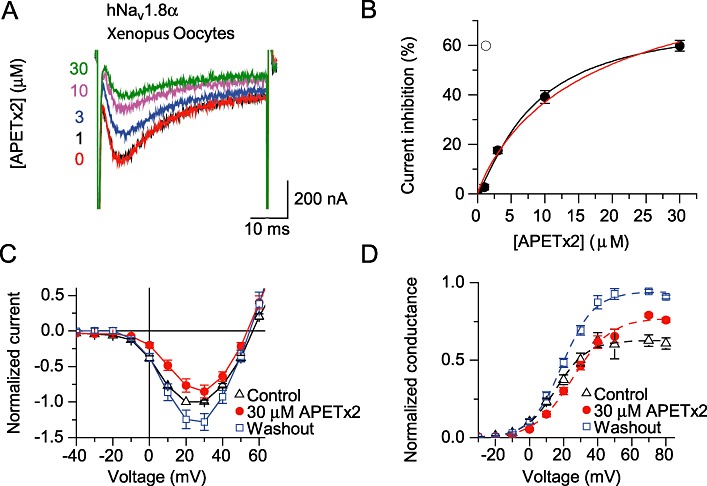
Inhibition of recombinant Nav 1.8 channels expressed in Xenopus oocytes. Recordings are from Xenopus oocytes expressing hNav 1.8 channels from a holding potential of −80 mV. (A) Current traces obtained in the presence of the indicated APETx2 concentrations, elicited by depolarization to 0 mV. (B) Concentration dependence of current inhibition by APETx2. The solid black line represents a fit to the Hill equation with maximal inhibition fitted to 65%, and the red line represents the fit with maximal inhibition set to 100%; for fit parameters see text (n= 4–6). (C) Current–voltage relationship in control, presence and after washout of 30 µM APETx2; currents were normalized to control current at −20 mV for each experiment. (D) Conductance–voltage relationship in control, presence and after washout of 30 µM APETx2 (n= 7).
APETx2 modulates neuronal activity in rat DRG neurones
Neurons were held in whole-cell current clamp close to −60 mV. Only cells with resting membrane potentials ≤−60 mV were included in the experiments. A 100 ms current ramp from 0 to 1 nA was injected to induce APs, as illustrated in Figure 7A. Under these conditions, 1 µM APETx2 reversibly reduced the number of APs (n= 13, P < 10−6; Figure 7B).
Figure 7.
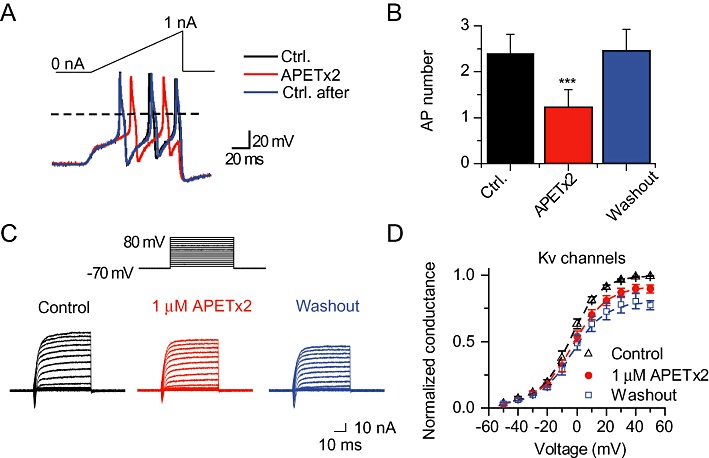
APETx2 inhibits electrical activity in rat DRG neurones. Recordings are from acutely dissociated DRG neurones, in the absence of TTX. (A) In whole-cell current-clamp mode, current injection was adjusted to obtain a membrane potential of ∼-60 mV under resting conditions. As illustrated in the upper panel, a 100 ms current ramp from 0 to 1 nA was applied to induce APs. A typical experiment is shown, with the response in the presence of 1 µM APETx2, between two control responses. (B) The number of APs is shown before, during and after washout of 1 µM APETx2 perfusion (n= 13). (C) In voltage-clamp experiments, Kv currents were elicited by 100 ms step depolarizations to values ranging form −60 to + 80 mV in 10 mV increments. A typical experiment is shown in control, presence and after washout of 1 µM APETx2. (D) Conductance–voltage activation curve of Kv currents in control, presence of toxin and after washout of 1 µM APETx2 (n= 5). The line represents the fit to a Boltzmann equation.
In order to assess a possible effect of APETx2 on Kv channels of DRG neurones, the protocol shown in panel C was applied using a KCl-based pipette solution. The Kv activation curve is shown in Figure 7D. APETx2 at 1 µM did not significantly shift V0.5 (n= 5, P= 0.16), and there was no evidence for a change in Gmax in the presence of APETx2.
Discussion and conclusions
In the present study, we show that the toxin APETx2 of the sea anemone A. elegantissima, frequently used as a selective inhibitor of ASIC3 channels, in addition inhibits Nav currents in rat DRG neurones at concentrations that are used for inhibition of heterotrimeric ASIC3-containing channels. At 1 µM, the APETx2 inhibition of the TTX-R Nav 1.8 current is stronger than that of TTX-S currents. The current inhibition is due to a small positive shift in the voltage dependence of activation and a decrease in the maximal conductance. We show with current-clamp experiments that inhibition of Nav currents by APETx2 translates into a decrease in neuronal excitability.
Inhibition of voltage-gated Na+ channels by APETx2
We observed a concentration-dependent inhibition of the Nav currents in rat DRG neurones. Pharmacological distinction into TTX-S and TTX-R currents showed, at 1 µM APETx2, 21% inhibition of the TTX-S and 42% inhibition of the TTX-R component. Under the experimental conditions chosen, the Nav 1.9 channels were largely inactivated. Therefore, the observed TTX-R current is mostly mediated by Nav 1.8 channels.
The observed inhibition of Nav 1.8 currents by APETx2 is in part due to a small shift in the voltage dependence of activation towards more depolarized values. In addition, the maximal conductance measured at +40 mV was reduced by APETx2. Comparison of the voltage–conductance curves (Figure 3C) shows that the inhibition is maximal in the voltage range around −10 to +10 mV and becomes smaller at more positive pulse potentials. From our data, there is no evidence for voltage dependence in the binding of the toxin. As the current inhibition was rapid when the toxin was applied at negative potentials, we conclude that APETx2 readily binds to Nav 1.8 channels in the closed state.
The positive shift in V0.5 by APETx2 was observed with endogenous and recombinant Nav 1.8 channels, while a significant change in Gmax could only be shown for the endogenous Nav 1.8 current of DRG neurones. In spite of these differences, APETx2 inhibited significantly the Nav 1.8 current in the different experimental conditions. In addition to the observed reduction of the current amplitude, APETx2 had three effects on inactivation, a slowing of the kinetics of inactivation, a positive shift in the voltage dependence of SSIN and an increase in the relative amplitude of the fastest component of recovery from inactivation. These effects suggest that APETx2 destabilizes the inactivated state.
Comparison with other sea anemone toxins acting on voltage-gated Na+ channels
Most peptide toxins from sea anemones belong to either of two main classes, Nav toxins or Kv toxins (Beress et al., 1975; Honma and Shiomi, 2006). On Nav channels, sea anemone toxins bind to site 3 and prolong the open state of the channels, resulting in a slowing of the macroscopic current inactivation (Rogers et al., 1996; Catterall et al., 2007; Smith and Blumenthal, 2007). Most of these toxins also increase the Nav peak current amplitude. Several recently identified sea anemone peptide toxins do not fall into either of the two main categories and constitute a new family (Honma and Shiomi, 2006; Shiomi, 2009). These include toxins acting on K+ channels (BDS-I, BDS-II, APETx1), a toxin likely to inhibit Nav channels.[BcIV (Oliveira et al., 2006)], a toxin with no known target (Am II) as well as APETx2 (see Shiomi, 2009). The phylogenetic tree in supplemental Figure S2A shows the relatedness of different sea anemone toxins, illustrating that the recently identified toxins are different from the two established classes. Comparison of the primary sequence between APETx2 and the sea anemone Nav toxins shows low similarity, although five of the six conserved Cys residues are also conserved in APETx2 (Supplemental Figure S2B). Several residues in the sea anemone Nav toxins that were shown to be critical for their function (see Honma and Shiomi, 2006; Bosmans and Tytgat, 2007; Smith and Blumenthal, 2007) are not conserved in APETx2. It is interesting to note in this context that certain scorpion toxins compete with sea anemone toxins for binding to site 3, although these two classes of toxins are unrelated on the level of the primary sequence and the three-dimensional structure. Solution structures of several Nav-targeting sea anemone toxins and of APETx1 and APETx2 are available. The basic fold of APETx2 consists of a disulphide-bonded core containing a four-stranded β-sheet (Chagot et al., 2005). Despite conservation of this fold between the Nav-targeting class of sea anemone toxins and APETx2, the three-dimensional structures are quite different.
The comparison with Nav-targeting sea anemone toxins thus shows that APETx2 slows inactivation, as do other sea anemone toxins, but is clearly distinct as regards its amino acid sequence and three-dimensional structure and its ability to decrease rather than increase the Nav current amplitude.
Inhibition of ASIC3 and Nav 1.8 in sensory neurones
In DRG neurones, APETx2 showed a concentration-dependent inhibition of ASIC3-like currents with an IC50 of ∼200 nM; the inhibition was however incomplete leaving, at 3 µM APETx2, 51% of the control ASIC3-like current amplitude (Diochot et al., 2004). The ASIC3-like current in the cited study was likely to be mediated at least in part by ASIC3-containing heteromers. In the present study, APETx2 inhibited Nav 1.8-like current with an IC50 of ∼2.6 µM in rat DRG neurones, leading to 20–50% inhibition of Nav 1.8 current in the concentration range 0.2–3 µM.
APETx2 has been used as an ASIC3-selective inhibitor in several in vivo studies in rats to confirm the role of ASIC3 as sensor in acid-induced, inflammatory and postoperative pain (Deval et al., 2008; Karczewski et al., 2010; Deval et al., 2011). In these studies, APETx2 was applied locally or intrathecally, at concentrations between 0.022 and 20 µM. While the effective concentrations in in vivo studies are difficult to estimate, it is expected that at the higher concentrations injected, micromolar concentrations of APETx2 were reached locally, sufficient for partial inhibition of Nav 1.8 channels.
Nav 1.8 is a sensory neuron-specific, voltage-gated, Na+ channel (Akopian et al., 1996) that, owing to its depolarizing gating properties, is an important carrier of current during the action potential upstroke (Blair and Bean, 2002; Renganathan et al., 2001). Several inflammatory modulators are able to affect Nav 1.8 channel expression and function. Studies with Nav 1.8 knockout mice have suggested an important role for Nav 1.8 channels in inflammatory conditions (see Dib-Hajj et al., 2010). Furthermore, several studies have demonstrated the analgesic efficacy of both centrally and peripherally administered inhibitors of Nav 1.8 channels (Ekberg et al., 2006; Jarvis et al., 2007).
Thus, in the studies in which micromolar concentrations of APETx2 were injected, it is likely that a part of the observed analgesic effect of APETx2 was due to its inhibition of Nav 1.8 currents. There is evidence for a role of ASIC3 channels in pain sensing from studies with knockout mice (Price et al., 2001; Sluka et al., 2003), supporting the conclusion that a part of the observed effect of APETx2 on the acute acid-induced and inflammatory response is likely to be due to ASIC3 channel blockade. In addition, the two studies using higher APETx2 concentrations showed in separate experiments with si-RNA, evidence for a role of ASIC3 channels in inflammation- and wound-induced pain (Deval et al., 2008; Deval et al., 2011).
Conclusions
Our observation that APETx2 inhibited Nav, in addition to ASIC3, currents needs to be considered when using APETx2 as a pharmacological tool. ASICs and sensory neuron-specific voltage-gated Na+ channels are potential drug targets of high interest. In the light of the findings reported here, APETx2 might be a basis for the development of more potent inhibitors of Nav 1.8 and/or ASIC3 channels. At present, several drugs acting on the nervous system have more than one target, as, for example, some anti-epileptic drugs. The fact that APETx2 targets two components of pain sensation would certainly be an advantage for the use of APETx2 or its derivatives as analgesic drugs.
Acknowledgments
We thank Jonas Jensen for providing APETx2 toxin and Richard Lewis for access to the hNav1.8 clone. We thank Todd Scheuer, Marc Suter, Gaetano Bonifacio, Aurélien Boillat, Cédric Laedermann and Miguel Van Bemmelen for comments on a previous version of the manuscript.
This work was supported by the Swiss National Science Foundation (Grant 31003–135542) to S.K and National Health & Medical Research Council of Australia (Grant ID 511067) to L.D.R.
Glossary
- AP
action potential
- ASIC
acid-sensing ion channel
- DRG
dorsal root ganglion
- FCS
fetal calf serum
- Kv
voltage-gated potassium channel
- Nav
voltage-gated sodium channel
- nH
Hill coefficient
- TTX
tetrodotoxin
- TTX-S
TTX-sensitive
- TTX-R
TTX-resistant
- V0.5
voltage of half-maximal activation
- V0.5IN
voltage of half-maximal inactivation
Conflicts of interest
The authors state no conflict of interest.
Supporting information
Additional Supporting Information may be found in the online version of this article:
Figure S1 APETx2 inhibition of Nav 1.8 current is not use-dependent. Currents were recorded from acutely dissociated DRG neurones, with all bath solutions containing TTX. A series of 20 50 ms depolarizations from −70 to +20 mV were performed at the frequencies indicated (0.5–10 Hz). (A) A typical experiment at 0.5 Hz is shown. (B) Current inactivation was corrected by dividing the currents obtained with 1μM APETx2 to that obtained without APETx2 at each pulse. This ratio is plotted as a function of the pulse number (1–20) for each stimulation frequency (n = 4 for each condition).
Figure S2 Sequence comparison of APETx2 with other sea anemone toxins. (A) Phylogenic tree, Nav, inhibitor of voltage-gated Na+ channels; K, inhibitor of K+ channels. Ae I from Actinia equina; Am II from Anthopsis maculata; ApA, ApB, from Anthopleura xanthogrammica; APETx1 and APETx2 from Anthopleura elegantissima; AsKS (kaliseptine), AsKC (kalicludines); BDS-I and BDS-II from Anemonia sulcata; BcIV from Bunodosoma caissarum; BgK from Bunodosoma granulifera; Da I from Dofleinia armata; PaTX from Entacmaea actinostoloides; Rp3 from Radianthus paumotensis; Sh1 and ShK from Stychodactyla helianthus. (B) Alignment of the novel sea anemone toxins to some of the classical Nav-targeting sea anemone toxins. Original references are cited in Honma and Shiomi (2006) and Shiomi (2009).
Please note: Wiley-Blackwell are not responsible for the content or functionality of any supporting materials supplied by the authors. Any queries (other than missing material) should be directed to the corresponding author for the article.
References
- Akopian AN, Sivilotti L, Wood JN. A tetrodotoxin-resistant voltage-gated sodium channel expressed by sensory neurones. Nature. 1996;379:257–262. doi: 10.1038/379257a0. [DOI] [PubMed] [Google Scholar]
- Alexander SPH, Mathie A, Peters JA. Guide to Receptors and Channels (GRAC), 5th Edition. Br J Pharmacol. 2011;164(Suppl. 1):S1–S324. doi: 10.1111/j.1476-5381.2011.01649_1.x. [DOI] [PMC free article] [PubMed] [Google Scholar]
- Anangi R, Chen CC, Lin YW, Cheng YR, Cheng CH, Chen YC, et al. Expression in Pichia pastoris and characterization of APETx2, a specific inhibitor of acid sensing ion channel 3. Toxicon. 2010;56:1388–1397. doi: 10.1016/j.toxicon.2010.08.004. [DOI] [PubMed] [Google Scholar]
- Beress L, Beress R, Wunderer G. Isolation and characterisation of three polypeptides with neurotoxic activity from Anemonia sulcata. FEBS Lett. 1975;50:311–314. doi: 10.1016/0014-5793(75)80517-5. [DOI] [PubMed] [Google Scholar]
- Berta T, Poirot O, Pertin M, Ji RR, Kellenberger S, Decosterd I. Transcriptional and functional profiles of voltage-gated Na(+) channels in injured and non-injured DRG neurones in the SNI model of neuropathic pain. Mol Cell Neurosci. 2008;37:196–208. doi: 10.1016/j.mcn.2007.09.007. [DOI] [PubMed] [Google Scholar]
- Blair NT, Bean BP. Roles of tetrodotoxin (TTX)-sensitive Na+ current, TTX- resistant Na+ current, and Ca2+ current in the action potentials of nociceptive sensory neurones. J Neurosci. 2002;22:10277–10290. doi: 10.1523/JNEUROSCI.22-23-10277.2002. [DOI] [PMC free article] [PubMed] [Google Scholar]
- Bosmans F, Tytgat J. Sea anemone venom as a source of insecticidal peptides acting on voltage-gated Na+ channels. Toxicon. 2007;49:550–560. doi: 10.1016/j.toxicon.2006.11.029. [DOI] [PMC free article] [PubMed] [Google Scholar]
- Catterall WA, Goldin AL, Waxman SG. International Union of Pharmacology. XLVII. Nomenclature and structure-function relationships of voltage-gated sodium channels. Pharmacol Rev. 2005;57:397–409. doi: 10.1124/pr.57.4.4. [DOI] [PubMed] [Google Scholar]
- Catterall WA, Cestele S, Yarov-Yarovoy V, Yu FH, Konoki K, Scheuer T. Voltage-gated ion channels and gating modifier toxins. Toxicon. 2007;49:124–141. doi: 10.1016/j.toxicon.2006.09.022. [DOI] [PubMed] [Google Scholar]
- Chagot B, Escoubas P, Diochot S, Bernard C, Lazdunski M, Darbon H. Solution structure of APETx2, a specific peptide inhibitor of ASIC3 proton-gated channels. Protein Sci. 2005;14:2003–2010. doi: 10.1110/ps.051378905. [DOI] [PMC free article] [PubMed] [Google Scholar]
- Chen CC, Zimmer A, Sun WH, Hall J, Brownstein MJ. A role for ASIC3 in the modulation of high-intensity pain stimuli. Proc Natl Acad Sci USA. 2002;99:8992–8997. doi: 10.1073/pnas.122245999. [DOI] [PMC free article] [PubMed] [Google Scholar]
- Cummins TR, Dib-Hajj SD, Black JA, Akopian AN, Wood JN, Waxman SG. A novel persistent tetrodotoxin-resistant sodium current in SNS-null and wild-type small primary sensory neurones. J Neurosci. 1999;19:RC43. doi: 10.1523/JNEUROSCI.19-24-j0001.1999. [DOI] [PMC free article] [PubMed] [Google Scholar]
- Deval E, Noel J, Lay N, Alloui A, Diochot S, Friend V, et al. ASIC3, a sensor of acidic and primary inflammatory pain. EMBO J. 2008;27:3047–3055. doi: 10.1038/emboj.2008.213. [DOI] [PMC free article] [PubMed] [Google Scholar]
- Deval E, Noel J, Gasull X, Delaunay A, Alloui A, Friend V, et al. Acid-Sensing Ion Channels in Postoperative Pain. J Neurosci. 2011;31:6059–6066. doi: 10.1523/JNEUROSCI.5266-10.2011. [DOI] [PMC free article] [PubMed] [Google Scholar]
- Dib-Hajj SD, Cummins TR, Black JA, Waxman SG. Sodium channels in normal and pathological pain. Annu Rev Neurosci. 2010;33:325–347. doi: 10.1146/annurev-neuro-060909-153234. [DOI] [PubMed] [Google Scholar]
- Diochot S, Loret E, Bruhn T, Beress L, Lazdunski M. APETx1, a new toxin from the sea anemone Anthopleura elegantissima, blocks voltage-gated human ether-a-go-go-related gene potassium channels. Mol Pharmacol. 2003;64:59–69. doi: 10.1124/mol.64.1.59. [DOI] [PubMed] [Google Scholar]
- Diochot S, Baron A, Rash LD, Deval E, Escoubas P, Scarzello S, et al. A new sea anemone peptide, APETx2, inhibits ASIC3, a major acid-sensitive channel in sensory neurones. EMBO J. 2004;23:1516–1525. doi: 10.1038/sj.emboj.7600177. [DOI] [PMC free article] [PubMed] [Google Scholar]
- Ekberg J, Jayamanne A, Vaughan CW, Aslan S, Thomas L, Mould J, et al. muO-conotoxin MrVIB selectively blocks Nav1.8 sensory neuron specific sodium channels and chronic pain behavior without motor deficits. Proc Natl Acad Sci USA. 2006;103:17030–17035. doi: 10.1073/pnas.0601819103. [DOI] [PMC free article] [PubMed] [Google Scholar]
- Gonzales EB, Kawate T, Gouaux E. Pore architecture and ion sites in acid-sensing ion channels and P2X receptors. Nature. 2009;460:599–604. doi: 10.1038/nature08218. [DOI] [PMC free article] [PubMed] [Google Scholar]
- Holzer P. Acid-Sensitive Ion Channels and Receptors. In: Canning BJ, Spina D, editors. Sensory Nerves. Vol. 194. Berlin, Heidelberg: Springer; 2009. pp. 283–332. [DOI] [PMC free article] [PubMed] [Google Scholar]
- Honma T, Shiomi K. Peptide toxins in sea anemones: structural and functional aspects. Mar Biotechnol (NY) 2006;8:1–10. doi: 10.1007/s10126-005-5093-2. [DOI] [PMC free article] [PubMed] [Google Scholar]
- Jarvis MF, Honore P, Shieh CC, Chapman M, Joshi S, Zhang XF, et al. A-803467, a potent and selective Nav1.8 sodium channel blocker, attenuates neuropathic and inflammatory pain in the rat. Proc Natl Acad Sci USA. 2007;104:8520–8525. doi: 10.1073/pnas.0611364104. [DOI] [PMC free article] [PubMed] [Google Scholar]
- Jasti J, Furukawa H, Gonzales EB, Gouaux E. Structure of acid-sensing ion channel 1 at 1.9 A resolution and low pH. Nature. 2007;449:316–323. doi: 10.1038/nature06163. [DOI] [PubMed] [Google Scholar]
- Jensen JE, Durek T, Alewood PF, Adams DJ, King GF, Rash LD. Chemical synthesis and folding of APETx2, a potent and selective inhibitor of acid sensing ion channel 3. Toxicon. 2009;54:56–61. doi: 10.1016/j.toxicon.2009.03.014. [DOI] [PubMed] [Google Scholar]
- Karczewski J, Spencer RH, Garsky VM, Liang A, Leitl MD, Cato MJ, et al. Reversal of acid-induced and inflammatory pain by the selective ASIC3 inhibitor, APETx2. Br J Pharmacol. 2010;161:950–960. doi: 10.1111/j.1476-5381.2010.00918.x. [DOI] [PMC free article] [PubMed] [Google Scholar]
- Kellenberger S. Epithelial Sodium and Acid-Sensing Ion Channels. In: Martinac B, editor. Sensing with Ion Channels. Vol. 11. Berlin, Heidelberg: Springer; 2008. pp. 225–246. [Google Scholar]
- Krishtal O. The ASICs: signaling molecules? Modulators? Trends Neurosci. 2003;26:477–483. doi: 10.1016/S0166-2236(03)00210-8. [DOI] [PubMed] [Google Scholar]
- Oliveira JS, Zaharenko AJ, Ferreira WA, Jr, Konno K, Shida CS, Richardson M, et al. BcIV, a new paralyzing peptide obtained from the venom of the sea anemone Bunodosoma caissarum. A comparison with the Na+ channel toxin BcIII. Biochim Biophys Acta. 2006;1764:1592–1600. doi: 10.1016/j.bbapap.2006.08.010. [DOI] [PubMed] [Google Scholar]
- Patino GA, Isom LL. Electrophysiology and beyond: multiple roles of Na+ channel beta subunits in development and disease. Neurosci Lett. 2010;486:53–59. doi: 10.1016/j.neulet.2010.06.050. [DOI] [PMC free article] [PubMed] [Google Scholar]
- Poirot O, Berta T, Decosterd I, Kellenberger S. Distinct ASIC currents are expressed in rat putative nociceptors and are modulated by nerve injury. J Physiol. 2006;576(Pt 1):215–234. doi: 10.1113/jphysiol.2006.113035. [DOI] [PMC free article] [PubMed] [Google Scholar]
- Price MP, McIlwrath SL, Xie J, Cheng C, Qiao J, Tarr DE, et al. The DRASIC cation channel contributes to the detection of cutaneous touch and acid stimuli in mice. Neuron. 2001;32:1071–1083. doi: 10.1016/s0896-6273(01)00547-5. [DOI] [PubMed] [Google Scholar]
- Renganathan M, Cummins TR, Waxman SG. Contribution of Na(v)1.8 sodium channels to action potential electrogenesis in DRG neurones. J Neurophysiol. 2001;86:629–640. doi: 10.1152/jn.2001.86.2.629. [DOI] [PubMed] [Google Scholar]
- Renganathan M, Dib-Hajj S, Waxman SG. Na-v 1.5 underlies the ‘third TTX-R sodium current’ in rat small DRG neurones. Brain Res Mol Brain Res. 2002;106:70–82. doi: 10.1016/s0169-328x(02)00411-4. [DOI] [PubMed] [Google Scholar]
- Rogers JC, Qu YS, Tanada TN, Scheuer T, Catterall WA. Molecular determinants of high affinity binding of à-scorpion toxin and sea anemone toxin in the S3-S4 extracellular loop in domain IV of the Na+ channel à subunit. J Biol Chem. 1996;271:15950–15962. doi: 10.1074/jbc.271.27.15950. [DOI] [PubMed] [Google Scholar]
- Shiomi K. Novel peptide toxins recently isolated from sea anemones. Toxicon. 2009;54:1112–1118. doi: 10.1016/j.toxicon.2009.02.031. [DOI] [PubMed] [Google Scholar]
- Sluka KA, Price MP, Breese NM, Stucky CL, Wemmie JA, Welsh MJ. Chronic hyperalgesia induced by repeated acid injections in muscle is abolished by the loss of ASIC3, but not ASIC1. Pain. 2003;106:229–239. doi: 10.1016/S0304-3959(03)00269-0. [DOI] [PubMed] [Google Scholar]
- Smith JJ, Blumenthal KM. Site-3 sea anemone toxins: molecular probes of gating mechanisms in voltage-dependent sodium channels. Toxicon. 2007;49:159–170. doi: 10.1016/j.toxicon.2006.09.020. [DOI] [PubMed] [Google Scholar]
- Vukicevic M, Kellenberger S. Modulatory effects of acid-sensing ion channels on action potential generation in hippocampal neurones. Am J Physiol Cell Physiol. 2004;287:C682–C690. doi: 10.1152/ajpcell.00127.2004. [DOI] [PubMed] [Google Scholar]
- Wemmie JA, Price MP, Welsh MJ. Acid-sensing ion channels: advances, questions and therapeutic opportunities. Trends Neurosci. 2006;29:578–586. doi: 10.1016/j.tins.2006.06.014. [DOI] [PubMed] [Google Scholar]
- Zhang M, Liu XS, Diochot S, Lazdunski M, Tseng GN. APETx1 from sea anemone Anthopleura elegantissima is a gating modifier peptide toxin of the human ether-a-go-go- related potassium channel. Mol Pharmacol. 2007;72:259–268. doi: 10.1124/mol.107.035840. [DOI] [PubMed] [Google Scholar]
Associated Data
This section collects any data citations, data availability statements, or supplementary materials included in this article.