

Abstract
Quantitative susceptibility mapping (QSM) is a novel technique which allows determining the bulk magnetic susceptibility distribution of tissue in vivo from gradient echo magnetic resonance phase images. It is commonly assumed that paramagnetic iron is the predominant source of susceptibility variations in gray matter as many studies have reported a reasonable correlation of magnetic susceptibility with brain iron concentrations in vivo. Instead of performing direct comparisons, however, all these studies used the putative iron concentrations reported in the hallmark study by Hallgren and Sourander (1958) for their analysis. Consequently, the extent to which QSM can serve to reliably assess brain iron levels is not yet fully clear. To provide such information we investigated the relation between bulk tissue magnetic susceptibility and brain iron concentration in unfixed (in situ) post mortem brains of 13 subjects using MRI and inductively coupled plasma mass spectrometry. A strong linear correlation between chemically determined iron concentration and bulk magnetic susceptibility was found in gray matter structures (r = 0.84, p < 0.001), whereas the correlation coefficient was much lower in white matter (r = 0.27, p < 0.001). The slope of the overall linear correlation was consistent with theoretical considerations of the magnetism of ferritin supporting that most of the iron in the brain is bound to ferritin proteins. In conclusion, iron is the dominant source of magnetic susceptibility in deep gray matter and can be assessed with QSM. In white matter regions the estimation of iron concentrations by QSM is less accurate and more complex because the counteracting contribution from diamagnetic myelinated neuronal fibers confounds the interpretation.
Abbreviations: GRE, gradient recalled echo; HEIDI, homogeneity enabled incremental dipole inversion; NIST, National Institute of Standards and Technology; QSM, quantitative susceptibility mapping; R2*, effective transverse relaxation rate; SHARP, sophisticated harmonic artifact reduction for phase data
Keywords: Quantitative susceptibility mapping, Brain iron, Myelin, Phase imaging, Post mortem
Highlights
► Brain iron concentration correlates with bulk magnetic susceptibility. ► Iron is the dominant contributor to magnetic susceptibility in gray matter tissue. ► Iron and susceptibility are weaker correlated in WM, indicating effects of myelin.
Introduction
Quantitative susceptibility mapping (QSM) is a novel post-processing technique which allows the calculation of the bulk magnetic susceptibility distribution of tissue in vivo from gradient echo (GRE) magnetic resonance phase images (Li and Leigh, 2004; Reichenbach, 2012). QSM based on single-scan clinical data recently became feasible due to increased computational power and novel algorithms that enable both improved pre-processing of the input GRE data (T. Liu et al., 2011a; Schweser et al., 2011) and reconstruction of susceptibility maps with reduced artifact level (Wharton and Bowtell, 2010). Susceptibility maps acquired from volunteers have been shown to demonstrate unprecedented anatomical contrast in both white and gray matter regions (T. Liu et al., 2011b; Petridou et al., 2009; Schäfer et al., 2011; Schweser et al., 2011; Shmueli et al., 2009; Wharton and Bowtell, 2010). The clinical potential of QSM is still under investigation but it is anticipated that susceptibility maps of patients will provide novel insights into disease induced tissue changes (Reichenbach, 2012). In particular, at magnetic field strengths greater than 1.5 T the contrast-to-noise characteristics of GRE phase images are superior to magnitude images (Duyn et al., 2007) substantiating that QSM has the potential to be more sensitive with respect to magnetic tissue properties than conventional magnitude-based techniques such as mapping transverse relaxation rates (Aquino et al., 2009; Haacke et al., 2005; Langkammer et al., 2010). Moreover, susceptibility maps can be calculated from any single-echo GRE dataset that is routinely acquired with the well-established susceptibility weighted imaging (SWI) technique (Deistung et al., 2008; Reichenbach and Haacke, 2001) and, thus, comes at no additional cost with routine clinical protocols.
Variations of the magnetic susceptibility of brain tissue can have several different biophysical origins. It is currently assumed that the susceptibility of gray matter is dominated by tissue iron which is predominantly stored in ferritin macromolecules (Hallgren and Sourander, 1958). The ferritin complex is a globular storage protein for iron and known to be paramagnetic so that iron increases the bulk magnetic susceptibility of the tissue (Schenck et al., 1992). Iron stores in the human brain have received increasing interest as abnormally increased brain iron concentrations have been found in a variety of neurological disorders including Alzheimer's disease, Parkinson's disease and multiple sclerosis (Berg and Youdim, 2006; Khalil et al., 2011). Therefore, much interest has focused on techniques for reliable assessment of brain iron concentrations in vivo. Recent experiments in normal controls suggested relatively high correlations between tissue susceptibility assessed by QSM and the presumed regional iron concentrations (Bilgic et al., 2012; Wharton and Bowtell, 2010; Wu et al., 2012) taken from the histochemical post mortem study by Hallgren and Sourander (1958). In particular, the bulk tissue magnetic susceptibility of white matter is, however, also affected substantially by myelin, which is diamagnetic and, consequently, counteracts the effect of iron (Langkammer et al., 2010; Lee et al., 2012; C. Liu et al., 2011; Schweser et al., 2011). In addition, substances such as blood and contributions from calcium and trace elements, have also been found to affect the magnetic susceptibility of tissue (Mitsumori et al., 2009; Schweser et al., 2011; Sedlacik et al., 2007; Shmueli et al., 2011; Yamada et al., 1996). Valid information on the true correlation of QSM measurements with tissue iron concentrations in different regions of the brain can, however, only be derived by direct comparison. Therefore, the goal of this study was to investigate the relationship between chemical brain iron concentration determined by using inductively coupled plasma mass spectrometry and magnetic susceptibility in unfixed (in situ) post mortem brains.
Materials and methods
Deceased subjects
Thirteen deceased subjects (mean age: 63.5 years; age range at death: 38–81 years; 3 females) with an autopsy requested by the local health authority were included in this study. Forensic pathologists examined the corpses to ensure compliance with the inclusion criteria, i.e., post mortem interval shorter than 72 h, no history of a neurological disorder or external evidence of brain trauma, and absence of ferromagnetic material. The local ethics committee approved the study and informed consent was obtained from each individual's next of kin.
MRI
Corpses underwent MRI of the brain within 72 h after death at 3 T (Magnetom TimTrio, Siemens Healthcare, Erlangen, Germany) using a head coil array with 12 receive channels. The subjects were kept refrigerated at 4 °C before scanning and, depending on the length of this period, the body temperature Tbody at the beginning of the MR data acquisition varied between 4 °C and 24 °C. High resolution GRE MR images (Deistung et al., 2008) were acquired with an rf-spoiled, flow compensated 3D gradient echo sequence (TR/TE = 39/20 ms; flip angle = 20°; FOV = 256 × 256 mm2; voxel resolution: 0.5 × 0.5 × 2 mm3; 88 slices; 2 averages; 6/8 Fourier in slice and phase encoding directions; receiver bandwidth = 200 Hz/px; acquisition time approximately 18 min). A double-echo, fast spin echo sequence (TR/TE1/TE2 = 5260/10/73 ms, FOV = 256 × 256 mm²; voxel resolution = 1 × 1 × 3 mm3; 30 slices; acquisition time approximately 9 min) was used for assessing brain anatomy. Additionally, FLAIR and high resolution MP-RAGE sequences were included in the MRI examination protocol. All scans were acquired in axial orientation using GRAPPA with an acceleration factor of 2. To provide a reference for quantitative susceptibility contrast in vivo, one healthy (living) 58‐year‐old male volunteer was recruited and the same protocol was applied. This experiment was approved by the local ethics committee and informed written consent was obtained from the volunteer.
Autopsy and preparation of specimens
Brains were extracted at autopsy within 12 h after MRI and main supplying blood vessels were ligated using surgical sutures to prevent the formation of air bubbles and wash out of blood. The extracted brains were subsequently fixed in a 4% phosphate buffered (pH 7.0 ± 0.5) formaldehyde solution (Carl Roth GmbH, Karlsruhe, Germany) for three to five weeks. Within four days after extraction the formalin was exchanged to ensure sufficient fixation throughout the brains (Dawe et al., 2009).
The fixed brains were cut axially into 10 mm thick slices using an orientation identical to the MRI scans. Tissue structures were taken from several pre-specified gray (globus pallidus, putamen, caudate nucleus, and thalamus) and white (frontal-, occipital- and temporal white matter, body of corpus callosum) matter. The specimens were dissected from both hemispheres at identical positions in the appropriate brain slices where the specific structure showed its maximum extent. Ceramic knifes were used to avoid contamination with iron. To better equalize the volumes of the differently sized dissected individual tissue chunks used for mass spectrometry as well as to increase the statistical power of the analysis, samples taken from white matter were cut in three subunits and those from gray matter in two subunits, respectively. Due to its limited size in the brain section used for dissection the globus pallidus was not divided into subunits. The volume of the resulting specimens was approximately 10 × 10 × 10 mm3, or slightly smaller depending on the anatomy.
Finally, to prepare samples for mass spectrometry, all specimens were freeze dried and weighed before and after freeze drying to enable calculation of wet tissue iron concentrations.
Mass spectrometry
The samples were heated at 250 °C for 30 min in a microwave-heated autoclave UltraCLAVE III (EMLS, Leutkirch, Germany). Consequently, this method measures all iron ions of the plasma regardless of the chemical environment. Iron concentrations were determined with an Agilent 7500ce inductively coupled plasma mass spectrometer (Agilent 7500ce, Agilent Technologies, Santa Clara, CA, USA) at a mass-to-charge ratio of 56 in Helium-mode. Helium was added at a flow rate of 5.3 ml/min to reduce polyatomic interferences of 40Ar16O+ and 40Ca16O+. The accuracy of the method was checked with the NIST RM 8414 bovine muscle (NIST, Gaithersburg, MD, USA) and the obtained results (69.7 mg/kg ± 5.1 mg/kg; n = 38) agreed well with the certified concentrations (71.2 mg/kg ± 9.2 mg/kg; n = 38).
Image processing and analysis
Image analysis was performed blinded to the results of the chemical analysis. Aliasing of the GRE phase was resolved with a Fourier-domain unwrapping technique (Li et al., 2011; Schofield and Zhu, 2003; Schweser et al., in press) and background phase contributions were eliminated with the SHARP technique (radius 5 mm, regularization parameter 0.05). Additionally, voxels with unreliable phase values were identified based on the local phase gradient and by thresholding the GRE magnitude image (Schweser et al., 2011). Finally, quantitative susceptibility maps with well suppressed streaking artifacts were reconstructed from the background corrected phase images using the Homogeneity Enabled Incremental Dipole Inversion (HEIDI) algorithm Schweser et al., 2012b, 2012c. Briefly, this algorithm solves the inverse field-to-source problem from GRE phase to susceptibility in three consecutive steps. HEIDI divides the Fourier space into three sub-domains according to the conditioning of the inverse problem: A sub-domain where the inversion is well-posed, a transition sub-domain where substantial noise amplification occurs, and a sub-domain where the inversion is ill-posed and information about the susceptibility distribution is inherently lost. Inversion in the well-posed and transitional sub-domains is then performed without explicit regularization using a conventional least-squares solver; noise amplification in the transitional domain is addressed by applying a denoising algorithm. Because reconstruction of the ill-posed sub-domain requires a priori knowledge on the susceptibility distribution HEIDI identifies regions in the susceptibility distribution that are homogeneous. This is achieved by thresholding the gradient of the background-corrected phase images. Correction of this information is achieved by incorporating information that is derived from the Laplacian of the phase and the gradient of the magnitude signal. The ill-posed sub-domain is finally reconstructed by solving a weighted total-variation problem with the a priori low gradient information as a weight. Parameters of the HEIDI algorithms were taken from the original HEIDI publication where these values have been optimized in a numerical model. The process of QSM is schematically depicted in Fig. 1.
Fig. 1.

Schematic illustration of the QSM framework with data from a deceased 89-year-old subject: the gradient echo phase is unwrapped and preprocessed with the SHARP algorithm while the magnitude additionally serves for the identification of unreliable voxels (represented by dark pixels). Using a total variation regularization strategy incorporating a priori information from the complex gradient echo signal, the resulting susceptibility maps are reconstructed.
According to Curie's law the magnetic susceptibility of paramagnetic materials, such as ferritin-bound brain iron, is approximately inverse proportional to temperature. The susceptibility maps in this study were, therefore, corrected for each subject with respect to the measured body temperature, Tbody, and converted to the in vivo condition (T = 36.5 °C) (Schenck, 1992):
Subsequently, the zero-points of all resulting susceptibility maps were adjusted for each subject individually to the average susceptibility value of occipital white matter because this region had the lowest inter-subject variance in iron concentration (standard deviation of 9 mg/kg wet tissue in this study (Table 1) or 10 mg/kg wet tissue in Langkammer et al. (2010), respectively). This procedure was required because QSM is intrinsically limited to providing susceptibility differences rather than absolute susceptibility values (Cheng et al., 2009).
Table 1.
Chemically determined mean iron concentrations and mean bulk tissue magnetic susceptibilities grouped by brain regions.
| N | Iron concentration | Bulk susceptibility | |||
|---|---|---|---|---|---|
| (mg/kg wet tissue) | (ppm) | ||||
| Globus pallidus | 25 | 205 ± 39 | (169–239) | 0.155 ± 0.038 | (0.119–0.182) |
| Putamen | 49 | 160 ± 37 | (132–183) | 0.129 ± 0.051 | (0.085–0.170) |
| Caudate nucleus | 49 | 105 ± 27 | (86–121) | 0.078 ± 0.032 | (0.053–0.097) |
| Thalamus | 49 | 50 ± 12 | (41–58) | 0.012 ± 0.035 | (− 0.014–0.039) |
| Corpus callosum | 67 | 29 ± 10 | (21–32) | − 0.012 ± 0.028 | (− 0.031–0.005) |
| Frontal WM | 73 | 47 ± 11 | (36–54) | − 0.009 ± 0.026 | (− 0.008–0.026) |
| Temporal WM | 72 | 46 ± 11 | (39–52) | − 0.003 ± 0.028 | (− 0.021–0.015) |
| Occipital WM | 73 | 36 ± 9 | (29–42) | − 0.000 ± 0.016 | (− 0.007–0.010) |
Values are given in mean ± standard deviation (inter-quartile range).
Susceptibility values are given relative to the reference region (occipital white matter) so that positive and negative values represent more and less diamagnetic bulk magnetic susceptibility relative to the reference region, respectively.
N represents the number of samples included in the analysis.
WM = white matter.
According to the location of the dissected tissue specimens, regions of interest (ROI) were outlined manually on the first echo images of the fast spin echo sequence. The size of these ROIs was identical to the dissected tissue specimens. Subsequently, the ROIs were then transformed automatically to the susceptibility maps using an affine registration and transformation algorithm from FSL (Smith et al., 2004).
Statistical methods
Statistical analyses were performed using STATISTICA 7.1 (StatSoft, Tulsa, USA) and a p‐value below 0.05 was considered as statistically significant. Linear regression models were employed to investigate the relation between chemically determined iron concentrations and bulk tissue susceptibility. All statistical analyses were first carried out for all brain regions, and then for gray and white matter regions separately.
Results
Iron concentrations were obtained from 457 specimens (172 from deep gray matter and 285 from white matter structures). From one subject only one hemisphere was dissected and accidentally contaminated samples were excluded. The mean wet weight of the tissue specimens was 0.62 g (standard deviation: 0.36 g). Inductively coupled plasma mass spectrometry revealed the highest mean iron concentration in the globus pallidus, followed by the putamen, the caudate nucleus, and the thalamus. The iron concentrations were in line with previous post mortem work (Hallgren and Sourander, 1958) and all mean iron concentrations in white matter were lower than in the deep gray matter structures (Table 1). The analysis of the formaldehyde solution before and after the fixation process did not reveal any iron content, indicating that no leakage of tissue iron into the buffer solution had occurred.
The visual appearance of susceptibility maps (Fig. 2) was in line with previous QSM work, although visibility of small vessels was substantially increased, which may be attributed to the increased deoxygenation level of the blood. The results of the regional QSM analysis are summarized in detail in Table 1 where positive and negative values represent paramagnetic and diamagnetic magnetic susceptibilities, respectively, relative to occipital white matter. All deep gray matter structures were paramagnetic relative to white matter structures.
Fig. 2.
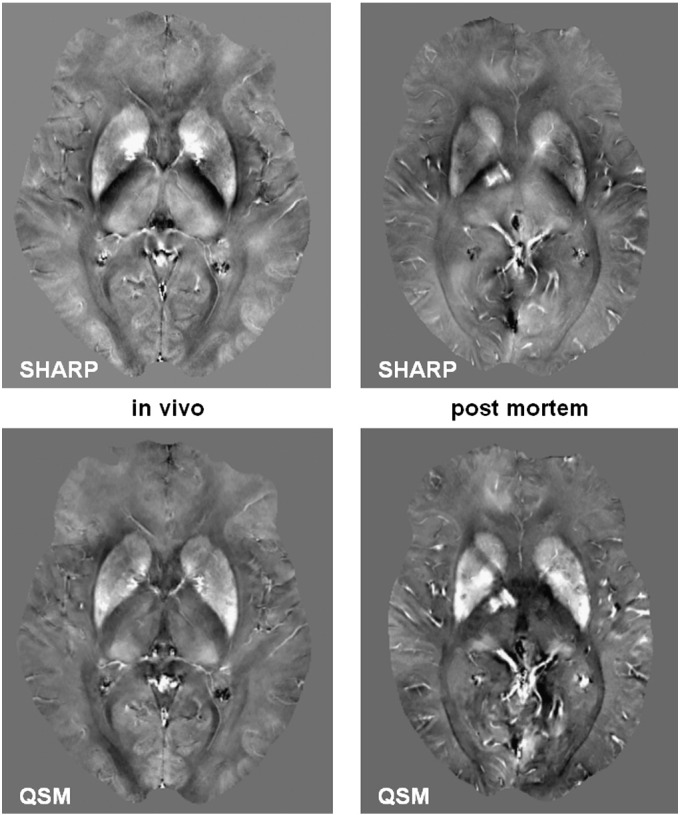
SHARP processed phase (top row) and resulting quantitative susceptibility maps (bottom row) of an in vivo 58-year-old subject (left) with a deceased 57-year-old subject (right). The body temperature of the deceased subject was 23.7 °C at the beginning of the MRI experiment. Substantially more vessels are visible in the post mortem map because of the fully deoxygenated blood. The contrast in the images is equal (SHARP phase from − 1 to 1 rad; QSM from − 0.1 to 0.2 ppm).
Regional magnetic susceptibilities were highly correlated with the results from mass spectrometry, in particular with higher iron concentrations. Fig. 3 illustrates the strong positive linear correlation found between chemical iron concentration and bulk magnetic susceptibility when all regions were included in the analysis (r = 0.87, p < 0.001). The correlation remained high when only gray matter structures were included (r = 0.84, p < 0.001) and substantially decreased when only white matter structures were considered in the analysis (r = 0.27, p < 0.001). Including all regions, linear regression yielded χ = 0.00097 ppm ∗ [Fe] − 0.040 ppm, where [Fe] is the iron concentration in mg/kg wet tissue mass and the susceptibility value χ is again referenced to the mean susceptibility of occipital white matter. When only including gray matter or white matter regions in the regression, slopes of 0.00089 ppm/(mg/kg) and 0.00055 ppm/(mg/kg), respectively, were obtained. Detailed results of the regression analysis are listed in Table 2.
Fig. 3.

Correlation of bulk magnetic susceptibility with measured iron concentration. The line represents the regression of all data points and the dotted lines indicate the 95% confidence intervals.
Table 2.
Results of the linear regression analysis of bulk magnetic susceptibility and measured iron concentration.
| Bulk susceptibility |
|||
|---|---|---|---|
| r | Regression slope | Regression offset | |
| (ppm per mg/kg wet weight) | (ppm) | ||
| All structures | 0.87 | 0.00097 ± 0.00003 | − 0.037 ± 0.002 |
| Gray matter | 0.84 | 0.00089 ± 0.00005 | − 0.022 ± 0.006 |
| White matter | 0.27 | 0.00055 ± 0.00012 | − 0.023 ± 0.005 |
| Theory for ferritin (36.5 °C) | – | 0.00132 | – |
Slope and offset values are given in mean ± standard deviation.
The p-values were below 0.001 in all analyses.
r = Pearson regression coefficient.
Regression equation: χ = slope ∗ iron concentration (in mg/kg wet tissue) ± offset.
Discussion
In this study, the relation between iron concentration and magnetic susceptibility in the human brain was investigated by QSM and inductively coupled plasma mass spectroscopy of post mortem tissue specimens. The results confirmed that the magnetic susceptibility is very sensitive to variations in iron concentration in the human brain.
The experimentally determined slopes of the linear correlation functions using all and using only deep gray matter regions are in line with the susceptibility of ferritin as predicted by theoretical considerations (Schenck, 1992): considering the effective number of Bohr magnetons (3.78) and an estimated density of brain tissue of 1.04 g/cm3 (Barber et al., 1970), the paramagnetic contribution of ferritin to the tissue susceptibility may be estimated to be 0.00132 ppm ∗ [Fe] at 36.5 °C. This agreement between theoretical and experimental findings supports the notion that most of the iron in the brain is bound to ferritin proteins (Hallgren and Sourander, 1958). The slightly smaller susceptibility values (see Table 2) compared to the theoretical values may be explained by either abundance of iron in chemical forms that are less paramagnetic (such as oxygenated heme or other low spin iron species) (Schenck et al., 1992) or by a systematic underestimation of the calculated susceptibility (Wharton and Bowtell, 2010), which is, however, only approximately 7% with HEIDI. In particular in white matter, the lower slope might additionally be explained by the high abundance of diamagnetic myelin (Langkammer et al., 2012; Li et al., 2012; Schweser et al., 2011, 2012b): The increased myelin content of white matter compared to gray matter systematically decreases the susceptibility of the white matter regions and, due to the low mean susceptibility value of white matter regions, slightly biases the linear fitting. This is also reflected by the regression offset which was significantly lower when all structures were considered compared to only white or gray matter structures (Table 2).
The observed higher correlation coefficient for the deep gray matter structures compared to the white matter structures was also recently found when transverse relaxation rate mapping was used for the assessment of brain iron (Langkammer et al., 2010) and may be attributed to the much broader range of iron concentrations in deep gray matter (about 4-times higher concentrations). The small variation in iron concentration in white matter enhances the relative contribution of confounding effects of several other factors. The scattering of the values is, for example, likely to originate from spatial mismatch of dissected tissue specimens and analyzed regions in the MR images. The tissue samples were collected from identifiable anatomic structures and not based on the magnetic susceptibility maps so that the relatively strong regional variations of susceptibility values within single nuclei (see Fig. 4) may have impacted the results. Substances such as deoxygenated blood, transferrin, hemosiderin, myelin, calcium (Schweser et al., 2010), and orientation dependency of susceptibility (Denk et al., 2011; Liu, 2010) naturally change the bulk voxel susceptibility, thus, compromising the correlation with ferritin-bound iron. Iron in transferrin or deoxygenated heme, for example, is in different electronic states with spin quantum numbers of S = 5/2 and 4/2, respectively, and thus is more paramagnetic than iron bound to ferritin, which has an effective spin quantum number of approximately 3/2 (Schenck, 1992). On the other hand, iron in white matter is collocated to oligodendrocytes which play a major role in myelination (Connor and Menzies, 1996). Myelin and calcium are diamagnetic and thus counteract the effect of iron on susceptibility (Li et al., 2011; Schweser et al., 2011). These factors and the abundance of other trace elements could modify the measured susceptibility. The current understanding of the magnetic susceptibility of brain tissue is still rather limited and thus needs input from histochemical correlation studies. Further work also has to include surrogate markers for myelin and should consider white matter fiber orientations with respect to the main magnetic field to determine this contribution to the total voxel susceptibility. These will be prerequisites for a more accurate assessment of iron in highly myelinated regions (Lee et al., 2010; Li et al., 2012).
Fig. 4.
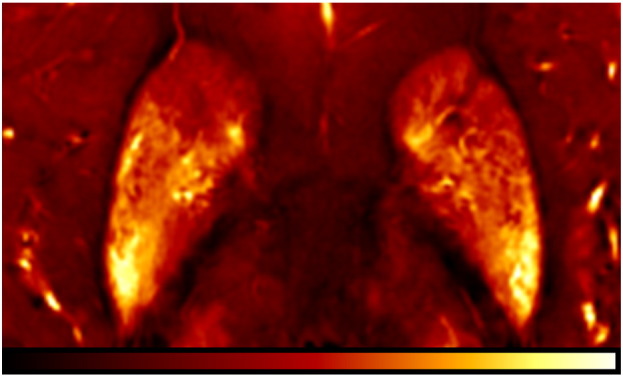
Regional variations of bulk magnetic susceptibility in the basal ganglia in a 54-years-old deceased subject. Image contrast is from − 0.1 ppm (red) to 0.25 ppm (yellow).
The present study was not compromised by changes due to formalin fixation of the brain, which is known to degrade the tissue microstructure and consequently changes the MR signal behavior (Dawe et al., 2009; Schmierer et al., 2008). However, we cannot rule out that a lower tissue temperature than in vivo as well as some degree of autolysis might have impacted our measurements. Little is known about the temperature dependence of tissue susceptibility and whether the magnetic susceptibilities of white and gray matter exhibit different temperature dependences. For example, the structure of the myelin lipid bilayer might change with decreasing temperature and proceeding autolysis may affect its diamagnetism. However, the strong correlation with iron concentration as observed in the present study suggests that iron induced susceptibility changes dominate other potential contributions. This is also supported by the visual comparison of post mortem QSM maps with in vivo QSM maps as exemplarily shown in Fig. 2. Despite the stronger visibility of vessels, which may be explained by the increased abundance of deoxyhemoglobin, no significant changes in the bulk susceptibility of tissue were observed.
Recent work employing QSM has revealed a substantially increased cortical gray-white matter contrast in susceptibility maps when compared to magnitude images (Li et al., 2011; T. Liu et al., 2011b; Schweser et al., 2011). The absence of this pronounced cortical contrast in our subjects is most likely due to normal aging. To demonstrate methodical developments recent studies mainly relied on young volunteers around 30 years. In contrast the mean age of our cohort was 63.5 years, which is an age where cortical gray-white matter contrast is reduced also in conventional MRI (Salat et al., 2009). The similar appearance of in vivo and post mortem susceptibility maps and the lack of cortical contrast even in the SHARP phase images (Fig. 2) demonstrate that this is neither a limitation of the utilized QSM technique nor an effect of post mortem changes, but may be ascribed to aging.
When comparing the results of the present QSM study to recently published work employing the effective transverse relaxation rate R2*, both techniques revealed similar correlations with iron and, thus, represent reasonable measures for the assessment of regional iron concentrations (Aquino et al., 2009; Langkammer et al., 2010). There are, however, several substantial differences of magnetic susceptibility mapping and relaxation rate mapping. First, susceptibility is specific to other underlying biophysical effects of the tissue composition: Diamagnetic substances counteract the effect of paramagnetic substances and therefore influence the resulting bulk susceptibility, whereas the abundance of both substances has an additive effect on the R2* rate, which confounds interpretation of R2* particularly in regions with low iron concentrations such as white matter (Langkammer et al., 2011; Schweser et al., 2011). Moreover, susceptibility maps can be retrospectively calculated from single-echo GRE measurements that were routinely acquired in the course of SWI. However, this comes along with the drawback that QSM only allows determining susceptibility differences rather than absolute susceptibility values. Due to this relative nature, normalization of the maps with respect to a certain reference region (occipital white matter in the present study) is required which may induce minimal susceptibility shifts and may explain the marginally lower correlation coefficient in this study compared to a related post mortem validation study where R2* mapping was used (Langkammer et al., 2010). R2* mapping does not require this normalization step and provides an absolute values but requires a multi-echo GRE sequence. Multi-echo GRE sequences are readily available in clinical routine, do not prolong acquisition time, and can serve for both, QSM and R2* mapping simultaneously. While relaxation rate mapping is a robust and established approach that has been applied in a number of clinical studies, QSM, on the other hand, is a very recent technique and subject to ongoing algorithmic improvements which may overcome the current limitations.
It has to be noted that also the GRE phase, the basis of QSM, itself has been used as a means to locally assess variations in the magnetic susceptibility. With the understanding of some limitations due to the non-local nature of phase this is an efficient and powerful approach that, unfortunately, has been systematically investigated so far only in few studies. One recent study demonstrated that by using sub-ROIs of structures, phase measurements can be compared with each other and provide valuable information about regional alterations in susceptibility (Walsh and Wilman, 2011). However, it is known that the orientation with respect to the main magnetic field as well as the application of a high pass filter render the GRE phase a poor direct measure of total tissue susceptibility (Li et al., 2011; Schweser et al., 2011; Yan et al., 2012). Therefore, filtered phase was not investigated in this work as it requires a more detailed analysis including the factors mentioned above as well as investigation about the influence of different filter types and kernel sizes.
In summary, quantitative magnetic susceptibility mapping provides novel information on the intrinsic biophysical tissue properties which is, to a certain extent, complementary to relaxation rate mapping. It may, therefore, be expected that the combination of relaxation rate mapping and QSM will provide further insight and will be instrumental for disentangling the main contributors yielding an increased accuracy of measurements of iron concentration and non-iron contributions in white matter (Langkammer et al., 2011; Schweser et al., 2012a). Future studies are certainly required to elaborate and compare relaxation rate mapping and QSM with respect to their sensitivity and accuracy as well as specificity to the underlying tissue composition and, in particular, for investigations of pathological conditions.
Conclusion
As this study demonstrates iron represents the dominant source of magnetic susceptibility in deep gray matter, whereas the counteracting diamagnetism of myelin and anisotropic susceptibility effects of fiber bundles are likely to reduce the sensitivity of QSM based iron measurements in white matter. Our results strongly support the finding that ferritin-bound iron is responsible as the major contributor to the paramagnetism observed in gray matter (Hallgren and Sourander, 1958), in good agreement with theoretical predictions by Schenck (1992).
Acknowledgments
This research was funded by a Carl Zeiss Foundation dissertation fellowship for Ferdinand Schweser and a research grant by the German Research Foundation (DFG, RE 1123/9-2). We are grateful to Reinhard Rzanny (Medical Physics Group, Jena University Hospital) and Michaela Soellinger (Medical University of Graz) for helpful support with the data acquisition. Christian Langkammer was supported by the Austrian Science Fund (FWF, project number P23576).
References
- Aquino D., Bizzi A., Grisoli M., Garavaglia B., Bruzzone M.G., Nardocci N., Savoiardo M., Chiapparini L. Age-related iron deposition in the basal ganglia: quantitative analysis in healthy subjects. Radiology. 2009;252:165–172. doi: 10.1148/radiol.2522081399. [DOI] [PubMed] [Google Scholar]
- Barber T.W., Brockway J.A., Higgins L.S. The density of tissues in and about the head. Acta Neurol. Scand. 1970;46:85–92. doi: 10.1111/j.1600-0404.1970.tb05606.x. [DOI] [PubMed] [Google Scholar]
- Berg D., Youdim M.B. Role of iron in neurodegenerative disorders. Top. Magn. Reson. Imaging. 2006;17:5–17. doi: 10.1097/01.rmr.0000245461.90406.ad. [DOI] [PubMed] [Google Scholar]
- Bilgic B., Pfefferbaum A., Rohlfing T., Sullivan E.V., Adalsteinsson E. MRI estimates of brain iron concentration in normal aging using quantitative susceptibility mapping. Neuroimage. 2012;59:2625–2635. doi: 10.1016/j.neuroimage.2011.08.077. [DOI] [PMC free article] [PubMed] [Google Scholar]
- Cheng Y.C., Neelavalli J., Haacke E.M. Limitations of calculating field distributions and magnetic susceptibilities in MRI using a Fourier based method. Phys. Med. Biol. 2009;54:1169–1189. doi: 10.1088/0031-9155/54/5/005. [DOI] [PMC free article] [PubMed] [Google Scholar]
- Connor J.R., Menzies S.L. Relationship of iron to oligodendrocytes and myelination. Glia. 1996;17:83–93. doi: 10.1002/(SICI)1098-1136(199606)17:2<83::AID-GLIA1>3.0.CO;2-7. [DOI] [PubMed] [Google Scholar]
- Dawe R.J., Bennett D.A., Schneider J.A., Vasireddi S.K., Arfanakis K. Postmortem MRI of human brain hemispheres: T2 relaxation times during formaldehyde fixation. Magn. Reson. Med. 2009;61:810–818. doi: 10.1002/mrm.21909. [DOI] [PMC free article] [PubMed] [Google Scholar]
- Deistung A., Rauscher A., Sedlacik J., Stadler J., Witoszynskyj S., Reichenbach J.R. Susceptibility weighted imaging at ultra high magnetic field strengths: theoretical considerations and experimental results. Magn. Reson. Med. 2008;60:1155–1168. doi: 10.1002/mrm.21754. [DOI] [PubMed] [Google Scholar]
- Denk C., Hernandez Torres E., MacKay A., Rauscher A. The influence of white matter fibre orientation on MR signal phase and decay. NMR Biomed. 2011;24:246–252. doi: 10.1002/nbm.1581. [DOI] [PubMed] [Google Scholar]
- Duyn J.H., van Gelderen P., Li T.Q., de Zwart J.A., Koretsky A.P., Fukunaga M. High-field MRI of brain cortical substructure based on signal phase. Proc. Natl. Acad. Sci. U.S.A. 2007;104:11796–11801. doi: 10.1073/pnas.0610821104. [DOI] [PMC free article] [PubMed] [Google Scholar]
- Haacke E.M., Cheng N.Y., House M.J., Liu Q., Neelavalli J., Ogg R.J., Khan A., Ayaz M., Kirsch W., Obenaus A. Imaging iron stores in the brain using magnetic resonance imaging. Magn. Reson. Imaging. 2005;23:1–25. doi: 10.1016/j.mri.2004.10.001. [DOI] [PubMed] [Google Scholar]
- Hallgren B., Sourander P. The effect of age on the non-haemin iron in the human brain. J. Neurochem. 1958;3:41–51. doi: 10.1111/j.1471-4159.1958.tb12607.x. [DOI] [PubMed] [Google Scholar]
- Khalil M., Langkammer C., Ropele S., Petrovic K., Wallner-Blazek M., Loitfelder M., Jehna M., Bachmaier G., Schmidt R., Enzinger C., Fuchs S., Fazekas F. Determinants of brain iron in multiple sclerosis: a quantitative 3T MRI study. Neurology. 2011;77:1691–1697. doi: 10.1212/WNL.0b013e318236ef0e. [DOI] [PubMed] [Google Scholar]
- Langkammer C., Krebs N., Goessler W., Scheurer E., Ebner F., Yen K., Fazekas F., Ropele S. Quantitative MR imaging of brain iron: a postmortem validation study. Radiology. 2010;257:455–462. doi: 10.1148/radiol.10100495. [DOI] [PubMed] [Google Scholar]
- Langkammer C., Krebs N., Goessler W., Scheurer E., Ebner F., Yen K., Fazekas F., Ropele S. Determinants of R2* relaxation in white matter: insights from postmortem analyses. Proc. Int. Soc. Magn. Reson. Med. 2011;19:4512. [Google Scholar]
- Langkammer C., Krebs N., Goessler W., Scheurer E., Yen K., Fazekas F., Ropele S. Susceptibility induced gray-white matter MRI contrast in the human brain. Neuroimage. 2012;59:1413–1419. doi: 10.1016/j.neuroimage.2011.08.045. [DOI] [PMC free article] [PubMed] [Google Scholar]
- Lee J., Shmueli K., Fukunaga M., van Gelderen P., Merkle H., Silva A.C., Duyn J.H. Sensitivity of MRI resonance frequency to the orientation of brain tissue microstructure. Proc. Natl. Acad. Sci. U.S.A. 2010;107:5130–5135. doi: 10.1073/pnas.0910222107. [DOI] [PMC free article] [PubMed] [Google Scholar]
- Lee J., Shmueli K., Kang B.T., Yao B., Fukunaga M., van Gelderen P., Palumbo S., Bosetti F., Silva A.C., Duyn J.H. The contribution of myelin to magnetic susceptibility-weighted contrasts in high-field MRI of the brain. Neuroimage. 2012;59:3967–3975. doi: 10.1016/j.neuroimage.2011.10.076. [DOI] [PMC free article] [PubMed] [Google Scholar]
- Li L., Leigh J.S. Quantifying arbitrary magnetic susceptibility distributions with MR. Magn. Reson. Med. 2004;51:1077–1082. doi: 10.1002/mrm.20054. [DOI] [PubMed] [Google Scholar]
- Li W., Wu B., Liu C. Quantitative susceptibility mapping of human brain reflects spatial variation in tissue composition. Neuroimage. 2011;55:1645–1656. doi: 10.1016/j.neuroimage.2010.11.088. [DOI] [PMC free article] [PubMed] [Google Scholar]
- Li W., Wu B., Avram A.V., Liu C. Magnetic susceptibility anisotropy of human brain in vivo and its molecular underpinnings. Neuroimage. 2012;59:2088–2097. doi: 10.1016/j.neuroimage.2011.10.038. [DOI] [PMC free article] [PubMed] [Google Scholar]
- Liu C. Susceptibility tensor imaging. Magn. Reson. Med. 2010;63:1471–1477. doi: 10.1002/mrm.22482. [DOI] [PMC free article] [PubMed] [Google Scholar]
- Liu C., Li W., Johnson G.A., Wu B. High-field (9.4 T) MRI of brain dysmyelination by quantitative mapping of magnetic susceptibility. Neuroimage. 2011;56:930–938. doi: 10.1016/j.neuroimage.2011.02.024. [DOI] [PMC free article] [PubMed] [Google Scholar]
- Liu T., Khalidov I., de Rochefort L., Spincemaille P., Liu J., Tsiouris A.J., Wang Y. A novel background field removal method for MRI using projection onto dipole fields (PDF) NMR Biomed. 2011;24:1129–1136. doi: 10.1002/nbm.1670. [DOI] [PMC free article] [PubMed] [Google Scholar]
- Liu T., Liu J., de Rochefort L., Spincemaille P., Khalidov I., Ledoux J.R., Wang Y. Morphology enabled dipole inversion (MEDI) from a single-angle acquisition: comparison with COSMOS in human brain imaging. Magn. Reson. Med. 2011;66:777–783. doi: 10.1002/mrm.22816. [DOI] [PubMed] [Google Scholar]
- Mitsumori F., Watanabe H., Takaya N. Estimation of brain iron concentration in vivo using a linear relationship between regional iron and apparent transverse relaxation rate of the tissue water at 4.7T. Magn. Reson. Med. 2009;62:1326–1330. doi: 10.1002/mrm.22097. [DOI] [PubMed] [Google Scholar]
- Petridou N., Schafer A., Gowland P., Bowtell R. Phase vs. magnitude information in functional magnetic resonance imaging time series: toward understanding the noise. Magn. Reson. Imaging. 2009;27:1046–1057. doi: 10.1016/j.mri.2009.02.006. [DOI] [PubMed] [Google Scholar]
- Reichenbach J.R. The future of susceptibility contrast for assessment of anatomy and function. Neuroimage. 2012 doi: 10.1016/j.neuroimage.2012.01.004. (Epub ahead of print) [DOI] [PubMed] [Google Scholar]
- Reichenbach J.R., Haacke E.M. High-resolution BOLD venographic imaging: a window into brain function. NMR Biomed. 2001;14:453–467. doi: 10.1002/nbm.722. [DOI] [PubMed] [Google Scholar]
- Salat D.H., Lee S.Y., van der Kouwe A.J., Greve D.N., Fischl B., Rosas H.D. Age-associated alterations in cortical gray and white matter signal intensity and gray to white matter contrast. Neuroimage. 2009;48:21–28. doi: 10.1016/j.neuroimage.2009.06.074. [DOI] [PMC free article] [PubMed] [Google Scholar]
- Schäfer A., Forstmann B.U., Neumann J., Wharton S., Mietke A., Bowtell R., Turner R. Direct visualization of the subthalamic nucleus and its iron distribution using high-resolution susceptibility mapping. Hum. Brain Mapp. 2011 doi: 10.1002/hbm.21404. Sep 20, http://dx.org/doi/10.1002/hbm.21404, (Epub ahead of print) [DOI] [PMC free article] [PubMed] [Google Scholar]
- Schenck J.F. Health and physiological effects of human exposure to whole-body four-tesla magnetic fields during MRI. Ann. N. Y. Acad. Sci. 1992;649:285–301. doi: 10.1111/j.1749-6632.1992.tb49617.x. [DOI] [PubMed] [Google Scholar]
- Schenck J.F., Dumoulin C.L., Redington R.W., Kressel H.Y., Elliott R.T., McDougall I.L. Human exposure to 4.0-Tesla magnetic fields in a whole-body scanner. Med. Phys. 1992;19:1089–1098. doi: 10.1118/1.596827. [DOI] [PubMed] [Google Scholar]
- Schmierer K., Wheeler-Kingshott C.A., Tozer D.J., Boulby P.A., Parkes H.G., Yousry T.A., Scaravilli F., Barker G.J., Tofts P.S., Miller D.H. Quantitative magnetic resonance of postmortem multiple sclerosis brain before and after fixation. Magn. Reson. Med. 2008;59:268–277. doi: 10.1002/mrm.21487. [DOI] [PMC free article] [PubMed] [Google Scholar]
- Schofield M.A., Zhu Y. Fast phase unwrapping algorithm for interferometric applications. Opt. Lett. 2003;28:1194–1196. doi: 10.1364/ol.28.001194. [DOI] [PubMed] [Google Scholar]
- Schweser F., Deistung A., Lehr B.W., Reichenbach J.R. Differentiation between diamagnetic and paramagnetic cerebral lesions based on magnetic susceptibility mapping. Med. Phys. 2010;37:5165–5178. doi: 10.1118/1.3481505. [DOI] [PubMed] [Google Scholar]
- Schweser F., Deistung A., Lehr B.W., Reichenbach J.R. Quantitative imaging of intrinsic magnetic tissue properties using MRI signal phase: an approach to in vivo brain iron metabolism? Neuroimage. 2011;54:2789–2807. doi: 10.1016/j.neuroimage.2010.10.070. [DOI] [PubMed] [Google Scholar]
- Schweser F., Deistung A., Sommer K., Reichenbach J.R. Disentangling contributions from iron and myelin architecture to brain tissue magnetic susceptibility by using Quantitative Susceptibility Mapping (QSM) Proc. Int. Soc. Magn. Reson. Med. 2012;20:409. [Google Scholar]
- Schweser F., Deistung A., Sommer K., Reichenbach J.R. Improved quantitative susceptibility mapping (QSM) with HEIDI. Proc. Int. Soc. Magn. Reson. Med. 2012;20:2359. [Google Scholar]
- Schweser, F., Deistung, A., Sommer, K., Reichenbach, J.R., in press. Towards real-time quantitative susceptibility mapping: superfast dipole inversion (SDI). Magn. Reson. Med. [DOI] [PubMed]
- Schweser F., Deistung A., Sommer K., Reichenbach J.R. Quantitative susceptibility mapping for investigating subtle susceptibility variations in the human brain. Neuroimage. 2012;62:2083–2100. doi: 10.1016/j.neuroimage.2012.05.067. [DOI] [PubMed] [Google Scholar]
- Sedlacik J., Rauscher A., Reichenbach J.R. Obtaining blood oxygenation levels from MR signal behavior in the presence of single venous vessels. Magn. Reson. Med. 2007;58:1035–1044. doi: 10.1002/mrm.21283. [DOI] [PubMed] [Google Scholar]
- Shmueli K., de Zwart J.A., van Gelderen P., Li T.Q., Dodd S.J., Duyn J.H. Magnetic susceptibility mapping of brain tissue in vivo using MRI phase data. Magn. Reson. Med. 2009;62:1510–1522. doi: 10.1002/mrm.22135. [DOI] [PMC free article] [PubMed] [Google Scholar]
- Shmueli K., Dodd S.J., Li T.Q., Duyn J.H. The contribution of chemical exchange to MRI frequency shifts in brain tissue. Magn. Reson. Med. 2011;65:35–43. doi: 10.1002/mrm.22604. [DOI] [PMC free article] [PubMed] [Google Scholar]
- Smith S.M., Jenkinson M., Woolrich M.W., Beckmann C.F., Behrens T.E., Johansen-Berg H., Bannister P.R., De Luca M., Drobnjak I., Flitney D.E., Niazy R.K., Saunders J., Vickers J., Zhang Y., De Stefano N., Brady J.M., Matthews P.M. Advances in functional and structural MR image analysis and implementation as FSL. Neuroimage. 2004;23(Suppl. 1):S208–S219. doi: 10.1016/j.neuroimage.2004.07.051. [DOI] [PubMed] [Google Scholar]
- Walsh A.J., Wilman A.H. Susceptibility phase imaging with comparison to R2* mapping of iron-rich deep grey matter. Neuroimage. 2011;57:452–461. doi: 10.1016/j.neuroimage.2011.04.017. [DOI] [PubMed] [Google Scholar]
- Wharton S., Bowtell R. Whole-brain susceptibility mapping at high field: a comparison of multiple- and single-orientation methods. Neuroimage. 2010;53:515–525. doi: 10.1016/j.neuroimage.2010.06.070. [DOI] [PubMed] [Google Scholar]
- Wu B., Li W., Guidon A., Liu C. Whole brain susceptibility mapping using compressed sensing. Magn. Reson. Med. 2012;67:137–147. doi: 10.1002/mrm.23000. [DOI] [PMC free article] [PubMed] [Google Scholar]
- Yamada N., Imakita S., Sakuma T., Takamiya M. Intracranial calcification on gradient-echo phase image: depiction of diamagnetic susceptibility. Radiology. 1996;198:171–178. doi: 10.1148/radiology.198.1.8539373. [DOI] [PubMed] [Google Scholar]
- Yan S.Q., Sun J.Z., Yan Y.Q., Wang H., Lou M. Evaluation of brain iron content based on magnetic resonance imaging (MRI): comparison among phase value, R2* and magnitude signal intensity. PLoS One. 2012;7:e31748. doi: 10.1371/journal.pone.0031748. [DOI] [PMC free article] [PubMed] [Google Scholar]