

Abstract
The aim of this study was to investigate the cross-sectional and prospective associations between physical activity and body composition in adolescence. This is a prospective study, including 4,103 adolescents belonging to the Pelotas (Brazil) 1993 birth cohort, who were followed up at the mean ages of 11.3 and 14.7 years. Subsample analyses included 511 individuals with accelerometry and deuterium dilution data at 13.3 years. Sum of skinfolds at age 11.3 years was highly correlated with skinfolds at age 14.7 years (rho = 0.74, P < 0.001). More than 85% of participants remained in the same quintile or changed by not more than one quintile during the 3.4 year period. Tracking of physical activity was considerably lower, although still significant; the correlation was 0.24 (P < 0.001) and 61.4% of the adolescents moved one or less quintiles. In fully-adjusted models, no significant cross-sectional or longitudinal associations were found between physical activity and body composition, neither in boys nor in girls. These null results were confirmed in the 511 individuals with accelerometry and deuterium data. We provide evidence of tracking of physical activity and particularly body composition during adolescence. Our results do not support the hypothesis that physical activity and fatness are strongly related in adolescents.
Keywords: motor activity, fatness, epidemiology, adolescence
Introduction
Childhood and adolescent physical activity have both short and long-term impacts on health (Hallal, Bertoldi, Goncalves, & Victora, 2006). Although the lay public often associates higher levels of physical activity with body composition changes, studies on the association between physical activity and body composition in adolescence present inconsistent results (Reichert, Menezes, Wells, Dumith, & Hallal, 2009). One of the likely explanations is the paucity of prospective studies in this field; it is known that cross-sectional studies are limited in their ability to explore the direction of associations between two variables each of which may influence the other. The widespread use of body mass index (BMI) as a measure of adiposity is another problem, given the fact that it incorporates both fat and lean mass, which are likely to be influenced by physical activity in opposite directions (Hallal, Victora, Azevedo, & Wells, 2006; Wells, Coward, Cole, & Davies, 2002). Finally, there is a paucity of studies with objective data on physical activity; most studies so far rely on self-reported data on activity levels, which might again move effect estimates towards the null hypothesis.
The association between physical activity and body composition may be regarded as a two-way street. On one hand, low levels of physical activity may result in accumulation of fat mass, while in opposite, higher levels of physical activity may increase lean mass (Riddoch et al., 2009). On the other hand, body composition may affect physical activity; for example, higher levels of adiposity may impede exercise directly and indirectly, (Metcalf et al., 2010) such as obese children having lower self-esteem, thus being less likely to exercise (Raustorp, Archer, Svensson, Perlinger, & Alricsson, 2009). Most studies so far have among children and adolescents focused only on the effects of physical activity on later body composition, thus treating the association as a one-way street. Few authors have explored the bidirectional association between physical activity and body composition (Ekelund, Brage, Besson, Sharp, & Wareham, 2008; Metcalf et al., 2010). Also, most studies have been conducted in high-income populations (Reichert et al., 2009).
There is also evidence that physical activity and body composition track over time, in part reflecting genotype and the long-term impact of early life exposures (Boreham et al., 2004). The aim of the present study was to investigate the bidirectional cross-sectional and prospective associations between physical activity and body composition in Brazilian adolescents, as well as to evaluate tracking of these two variables. In order to account for the complex relationships between the two variables, we constructed a conceptual model guiding our analyses (Figure 1). Pathways “A” and “F” represent the possible cross-sectional associations between physical activity and body composition. Pathways “B” and “C” represent the study of tracking of the two variables over time. Pathways “D” and “E” represent the prospective associations between physical activity and body composition.
Figure 1.
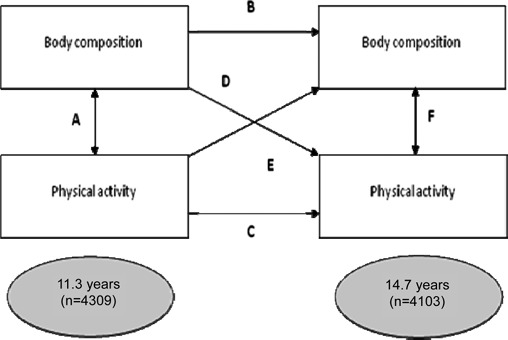
Conceptual model guiding the evaluation of the two way cross-sectional and longitudinal associations between physical activity and body composition, as well as tracking of these two variables.
Methods
Of all (n = 5,265) children born in the calendar year of 1993 in the city of Pelotas, in Southern Brazil, 5,249 (99.7%) are part of the 1993 Pelotas (Brazil) birth cohort study (Azevedo, Horta, Gigante, Victora, & Barros, 2008). All cohort members were sought at the mean ages of 11.3 ± 0.4 and 14.7 ± 0.4 years. Follow-up rates were 87.5% and 85.2%, respectively. At the mean age of 13.3 ± 0.4 years, 511 cohort members were approached for a comprehensive study on body composition and physical activity. These individuals were selected because this subsample had complete data on weight and length/ height at the ages of 1, 3 and 6 months, and 1 and 4 years. Out of these 511 individuals, 90% could be measured at the mean age of 13.3 years.
Physical activity
At 11.3, 13.3 and 14.7 years, individuals completed an interviewer-administered comprehensive questionnaire on physical activity. The questionnaire comprises a list of activities typically practised by adolescents in the region (created following pilot testing with open-ended questions) with the possibility to add additional activities not included in the list. For each activity, individuals were asked whether they had practised it or not over the last seven days. For all positive answers, participants were requested to report the number of days of practice over the last seven days and the mean duration of practice per day. In addition to these activities, participants were asked about their mode of travel to and from school (commuting activity) (Bastos, Araujo, & Hallal, 2008). Three different physical activity scores (minutes per week) were derived from the questionnaire: (a) leisure-time physical activity was derived by multiplying the number of days where a given activity was reported by the average daily duration, and summing the values across different physical activities; (b) commuting physical activity was estimated by multiplying the daily duration of walking or cycling to and from school by five (number of school days per week); (c) total physical activity was the sum of variables “a” and “b”. Physical activity scores were divided into quintiles, and the proportion of adolescents reaching 300 minutes per week of total physical activity was calculated. In the cross-sectional and prospective associations, we present the total physical activity score only; results using leisure-time physical activity or commuting separately were highly consistent with those using total physical activity (results available upon request).
At the 13.3 years follow up visit, individuals wore an ActiGraph GT1M accelerometer from Wednesday to the next Monday. Over 90% of the participants used the device for three or more days for at least 600 min · day−−1. Further details on data cleaning, reduction and derivation of variables are available elsewhere (Reichert et al., 2009). For this analysis, we generated the weekly minutes spent on moderate-to-vigorous physical activity using a cut-off point of > 2000 counts per minute and the proportion of adolescents reaching 60 minutes of moderate-to-vigorous physical activity per day.
Body composition
Triceps and subscapular skinfolds were measured in triplicate by trained interviewers in all follow up waves and thereafter averaged. These interviewers were trained in the measurements prior to data collection and every two months during fieldwork. Data on body weight and height were also collected during all visits using standardised equipment. Body mass index (BMI) was calculated as weight divided by height squared.
Individuals followed up at 13.3 years also had their body composition measured through deuterium dilution (Wells, Hallal, Wright, Singhal, & Victora, 2005). Lean mass was calculated from total body water using age- and sex-specific values for the hydration of lean tissue (Wells et al., 2002) Fat mass (in kg) was calculated as the difference of lean mass and weight.
Data analysis
In order to evaluate tracking of body composition (pathway “B”) and physical activity (pathway “C”), we used (a) Spearman's correlation coefficients because both variables showed a positively skewed distributions; and (b) frequency of quintile crossing over the 3.4-years period. For evaluating the cross-sectional and prospective associations between physical activity and body composition, we used unadjusted and fully-adjusted regression models, which included socioeconomic status, maternal pre-pregnancy body mass index, maternal smoking during pregnancy, birth order, maternal schooling and pubertal status. Pubertal status was assessed using the Tanner tables. All analyses were stratified by gender, and all prospective analyses included baseline values of the outcome variable in the model. We log-transformed physical activity and sum of skinfolds, but because results were consistent with those using untransformed variables, we opted to present the latter (results using the transformed variables are available upon request).
Ethics
The study protocol was approved by the Federal University of Pelotas Medical School Ethics Committee. Written informed consent was obtained from parents or guardians and verbal consent was obtained from adolescents prior to data collection.
Results
At the 11.3 years follow-up visit, 4,452 individuals were located and 4,442 of these provided data on all variables of interest and were included in the present study (Table I). At the 14.7 years visit, 4,325 individuals contributed with data. Out of the 511 individuals included in the 13.3 years subsample, 457 provided valid accelerometer data and 450 data on fat mass estimated by deuterium dilution. In our cohort, 66.8% of the participants have white skin colour, and individuals are from all social classes, representing the socioeconomic heterogeneity of the city's population. In the 13.3 years subsample, 76.8% of the girls already had the menarche; mean age at menarche among them was 11.7 (s = 1.0) years. In the 14.7 years visit, 96.4% of the girls had the menarche. At 13.3 years of age, 48.7% of the boys reported to have hair under the arms, and 19.2% reported to shave regularly.
Table I.
Physical activity (PA) and body composition characteristics of the adolescents belonging to the 1993 Pelotas (Brazil) birth cohort study.
| 11.3 ± 0.3 years |
13.3 ± 0.3 years |
14.7 ± 0.3 years |
||||
|---|---|---|---|---|---|---|
| Variable | Mean (s) | n | Mean (s) | n | Mean (s) | n |
| Questionnaire-based PA | ||||||
| Leisure-time MVPA (min · week−−1) | 341 (471) | 4319 | 318 (450) | 511 | 356 (496) | 4325 |
| % < 300 min/wk | 62.7% | 65.8% | 61.9% | |||
| Commuting physical activity (min · week−1) | 92 (76) | 4419 | 101 (82) | 511 | 89 (88) | 4324 |
| % < 300 min · week−1 | 97.1% | 94.9% | 95.1% | |||
| Total physical activity (min · week−1) | 433 (478) | 4293 | 419 (455) | 511 | 445 (508) | 4324 |
| % < 300 min · week−1 | 51.9% | 53.0% | 51.8% | |||
| Accelerometry-based PA | ||||||
| MVPA (min · week−1) | 508 (221) | 457 | ||||
| % < 300 min · week−1 | 17.9% | |||||
| Anthropometry and body composition | ||||||
| Weight (kg) | 39.9 (10.4) | 4442 | 51.2 (12.0) | 510 | 57.4 (12.7) | 4106 |
| Height (cm) | 145.8 (7.9) | 4442 | 158.0 (8.4) | 511 | 163.1 (8.2) | 4103 |
| Body mass index (kg · m−1) | 18.6 (3.6) | 4442 | 20.4 (3.9) | 510 | 21.5 (4.0) | 4103 |
| Triceps skinfold (mm) | 13.4 (6.8) | 4428 | 14.9 (8.0) | 511 | 14.1 (7.6) | 4104 |
| Subscapular skinfold (mm) | 9.1 (5.8) | 4425 | 10.6 (5.9) | 511 | 11.4 (6.4) | 4102 |
| Fat mass (kg) | 11.9 (7.7) | 450 | ||||
| Lean mass (kg) | 38.9 (7.2) | 450 | ||||
MVPA: moderate-to-vigorous physical activity.
The proportion of individuals practising fewer than 300 min · week−1 of moderate-to-vigorous physical activity according to the questionnaire was about 50% for all visits. Mean weight increased by 11.3 kg between 11.3 and 13.3 years and by 6.2 kg between 13.3 and 14.7 years. Mean height increased by 12.2 and 5.1 cm over the same periods, respectively. Mean fat mass at 13.3 years was 10.1 kg (s = 7.6) among boys and 14.0 (s = 7.1) among girls.
Tracking
Figure 2 presents Spearman's correlation coefficients for physical activity and body composition indicators measured at 11.3 and 14.7 years of age. Tracking of commuting physical activity was stronger than tracking of leisure-time physical activity or the total physical activity score. Tracking was similar for boys and girls. Tracking effects were much stronger for body composition variables than for physical activity. In boys and girls combined, the correlation coefficients were 0.74 for sum of skinfolds and 0.84 for BMI.
Figure 2.
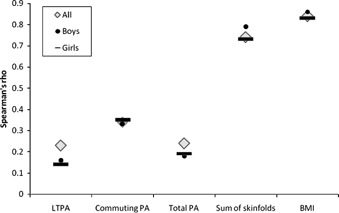
Spearman's correlation coefficient for tracking of different physical activity (PA) and body composition indicators from 11.3 to 14.7 years. LTPA: leisure-time physical activity. Body composition tracks more strongly than PA; commuting PA tracks more strongly than leisure-time PA; all P values < 0.001.
Using log-transformed variables, the Pearson correlation between total physical activity at 11.3 and 14.7 years was 0.17 among males and 0.16 among females, similar to that obtained using the untransformed variables. Pearson coefficients for the tracking of the log of the sum of skinfolds were 0.79 among males and 0.75 among females, again similar to those for the untransformed variables.
We also examined tracking of total physical activity and body composition using quintiles (Table II). In terms of sum of skinfolds, 85.2% of the adolescents continued in the same quintile or moved only one quintile in the period. Regarding physical activity, the corresponding statistic was 61.2%.
Table II.
Tracking of physical activity and body composition from 11.3 to 14.7 years of age – categorical analysis.
| Total physical activity at 14.7 years (quintiles) |
|||||
| Total physical activity quintiles at 11.3 years | 1st | 2nd | 3rd | 4th | 5th |
| 1st | 302 | 153 | 152 | 121 | 87 |
| (37.1%) | (18.8%) | (18.7%) | (14.8%) | (10.7%) | |
| 2nd | 213 | 179 | 183 | 132 | 122 |
| (25.7%) | (21.6%) | (22.1%) | (15.9%) | (14.7%) | |
| 3rd | 161 | 148 | 175 | 162 | 166 |
| (19.8%) | (18.2%) | (21.6%) | (20.0%) | (20.4%) | |
| 4th | 121 | 141 | 169 | 205 | 190 |
| (14.6%) | (17.1%) | (20.5%) | (24.8%) | (23.0%) | |
| 5th | 127 | 103 | 149 | 193 | 244 |
| (16.6%) | (12.6%) | (18.3%) | (23.7%) | (29.9%) | |
| Sum of skinfolds at 14.7 years (quintiles) |
|||||
| Sum of skinfolds quintiles at 11.3 years | 1st | 2nd | 3rd | 4th | 5th |
| 1st | 514 | 196 | 77 | 15 | 6 |
| (63.6%) | (24.3%) | (9.5%) | (1.9%) | (0.7%) | |
| 2nd | 196 | 277 | 207 | 94 | 23 |
| (25.6%) | (34.8%) | (26.0%) | (11.8%) | (2.9%) | |
| 3rd | 67 | 195 | 252 | 229 | 61 |
| (8.3%) | (24.3%) | (31.3%) | (28.5%) | (7.6%) | |
| 4th | 28 | 90 | 193 | 291 | 209 |
| (3.5%) | (11.1%) | (23.8%) | (35.9%) | (25.8%) | |
| 5th | 11 | 44 | 81 | 179 | 495 |
| (1.4%) | (5.4%) | (10.0%) | (22.1%) | (61.1%) | |
Cross-sectional associations
No significant cross-sectional associations were observed between physical activity and body composition either in boys or in girls, at 11.3 years of age (Table III). The association that was closer to statistical significance was the one between physical activity and sum of skinfolds at 11.3 years among boys, but the P value was not statistically significant (0.08). In the unadjusted analyses among boys, each additional minute per day of moderate-to-vigorous physical activity (by accelerometry) was related to −0.03 kg (P = 0.03) of fat mass (by deuterium dilution). Among girls, no unadjusted association between accelerometry-based physical activity and fat mass were detected (P = 0.94). After adjustment, the association among boys was completely removed (P = 0.57).
Table III.
Cross-sectional associations between physical activity and body composition.
| 11.3 years |
14.7 years |
|||||||
|---|---|---|---|---|---|---|---|---|
|
Boys |
Girls |
Boys |
Girls |
|||||
| Exposure variable/Outcome variable/model | Coefficient (95% CI) | P | Coefficient (95% CI) | P | Coefficient (95% CI) | P | Coefficient (95% CI) | P |
| Sum of skinfolds/physical activity/unadjusted | −1.6 (−3.4; 0.2) | 0.08 | −0.6 (−2.0; 0.8) | 0.38 | −1.3 (−3.1; 0.4) | 0.14 | −0.6 (−2.0; 0.8) | 0.38 |
| Sum of skinfolds/physical activity/adjusted∗ | 0.8 (−1.6; 3.1) | 0.52 | −0.5 (−2.0; 1.0) | 0.53 | −1.5 (−4.1; 1.1) | 0.26 | 0.5 (−0.8; 1.7) | 0.48 |
| Physical activity/sum of skinfolds/unadjusted | −0.00089 (−0.0019; 0.0011)& |
0.08 | −0.0006 (−0.0018; 0.0007)& |
0.38 | −0.0008 (−0.0018; −0.0003) |
0.14 | −0.0006 (−0.0018; −0.0007) |
0.38 |
| Physical activity/sum of skinfolds/adjusted∗ | 0.0004 (−0.0009; 0.0017)& |
0.52 | −0.00004 (−0.0018; 0.0009)& |
0.53 | −0.0007 (−0.0018; 0.0004) |
0.26 | 0.0006 (−0.0010; 0.0022) |
0.48 |
Adjusted for socioeconomic status, maternal pre-pregnancy body mass index, maternal smoking during pregnancy, birth order, maternal schooling and pubertal status.
The numbers are small because they reflect the effect of each extra minute of physical activity per week on the sum of skinfolds (mm).
Prospective associations
In the unadjusted analyses, a one mm higher sum of skinfolds at 11.3 years was associated with 56 minutes per week lower physical activity at 14.7 years in boys. Also, each extra 10 minutes of physical activity at 11.3 years was associated with a reduction of 0.026 kg of fat mass at 13.3 years, again among boys. No significant associations were observed in the unadjusted analysis among girls. In fully-adjusted models, there was no statistically significant prospective association between physical activity and body composition, either in boys or in girls; and whether using reference techniques (accelerometry and deuterium) or large-sample techniques (physical activity by questionnaire and sum of skinfolds). The main variable responsible for differences between the unadjusted and adjusted analyses was pubertal status (Table IV). The prospective association between physical activity at 11.3 years and sum of skinfolds at 14.7 years did not change by restricting the analyses to adolescents who were overweight at baseline (data available upon request).
Table IV.
Prospective associations between physical activity and body composition.
| Unadjusted |
Fully-adjusted∗ |
|||||||
|---|---|---|---|---|---|---|---|---|
| Boys | Girls | Boys | Girls | |||||
| Exposure variable/Outcome variable | Coefficient (95% CI) | P | Coefficient (95% CI) | P | Coefficient (95% CI) | P | Coefficient (95% CI) | P |
| Sum of skinfolds at 11.3 years/physical activity at 14.7 years | −56.1 (−106.8; −5.4) | 0.03 | −1.4 (−36.3; 35.5) | 0.94 | −16.4 (−83.5; 50.7) | 0.63 | 24.0 (−15.3; 63.3) | 0.23 |
| Physical activity at 11.3 years/Sum of skinfolds at 14.7 years | −0.00045 (−0.0015; 0.00061) |
0.41 | 0.00035 (−0.0011; 0.0018) |
0.63 | 0.00007 (−0.00085; 0.00098) |
0.89 | 0.00099 (−0.00007; 0.0020) |
0.07 |
| Fat mass at 13.3 years (deuterium)/physical activity at 14.7 years (questionnaire) | −1.6 (−12.8; 9.7) | 0.78 | −3.7 (−10.4; 3.0) | 0.27 | 1.7 (−12.4; 15.8) | 0.81 | −1.4 (−8.8; 6.1) | 0.72 |
| Sum of skinfolds at 11.3 years/physical activity at 13.3 years (accelerometry) | −0.29 (−0.64; 0.05) | 0.10 | −0.05 (−0.36; 0.26) | 0.75 | 0.08 (−0.31; 0.46) | 0.70 | 0.01 (−0.33; 0.35) | 0.95 |
| Physical activity at 13.3 years (accelerometry)/sum of skinfolds at 14.7 years | −0.03 (−0.08; 0.01) | 0.13 | −0.02 (−0.08; 0.05) | 0.63 | −0.02 (−0.06; 0.03) | 0.46 | −0.03 (−0.08; 0.01) | 0.10 |
| Physical activity at 11.3 years (questionnaire)/fat mass at 13.3 years | −0.0026 (−0.0049; −0.0003) |
0.03 | 0.0009 (−0.0016; 0.0035) |
0.47 | −0.00057 (−0.0023; 0.0011) |
0.51 | 0.00087 (−0.00068; 0.0024) |
0.27 |
Adjusted for socioeconomic status, maternal pre-pregnancy body mass index, maternal smoking during pregnancy, birth order, maternal schooling, pubertal status and baseline levels of the outcome variable.
&The numbers are small because they reflect the effect of each extra minute of physical activity per week on the sum of skinfolds (mm).
Discussion
In a population-based cohort from a middle-income country, we tested the cross-sectional and prospective associations between physical activity and body composition, as well as the magnitude of tracking of these variables throughout adolescence. The fact that commuting physical activity tracked strongly during the period is probably explained by social variables. In a previous analysis, we showed that the main predictor of commuting mode to and from school was socioeconomic position (Hallal et al., 2006a). Because few families changed their socioeconomic position in this 3.4-years period, it was reasonable to expect that commuting physical activity would present a strong tracking effect. The fact that body composition tracks so strongly itself suggests that physical activity may have limited capacity to impact on body composition during this time period. This interpretation is supported by the prospective analyses displayed in the results. One should argue that, in the absence of pro-activity interventions, it is very unlikely that obese adolescents during early adolescence will change their body composition ranking substantially over the next few years.
A systematic review of the prospectively-assessed effect of physical activity on adolescent fatness showed that most studies found an inverse association between the variables, particularly when individuals were already obese at baseline (Reichert et al., 2009). Studies of the reverse pathway (i.e. effect of body composition on physical activity) are rare, (Li, O'Connor, Buckley, & Specker, 1995) and systematic reviews are not available. In the Early Bird study which examined children from the ages 7 to 10 years, it was concluded that physical inactivity seems to be a result of fatness instead of being its cause (Metcalf et al., 2010).
The strengths of our study include its prospective nature, the large sample size, the substantial time interval between measurements and the wealth of data on potential confounders. In addition, it is worth mentioning that very little data on these associations are available from low and middle-income countries. The main limitation is reliance on regional skinfolds for assessing adiposity, and on questionnaire data for physical activity in the whole sample. However, the analyses of isotope data on fat mass and accelerometer data on physical activity at an intermediate time point (13.3 years) in about 500 adolescents led to similar findings as the main analyses. Thus, measurement error is not the likely explanation of the absence of association between physical activity and body composition. Another possibility is a dilution of the association between physical activity (exposure) and body composition (outcome) due to the instability of physical activity; although our cohort is prospective, we rely on repeated cross-sectional measures of physical activity.
Tracking of body composition in childhood and adolescence has been documented previously (Boreham et al., 2004; Cheng et al., 2009; Peeters et al., 2007). Studies on the tracking of physical activity in adolescence have found contradictory results, with most studies suggesting a low to moderate tracking effect (Fortier, Katzmarzyk, Malina, & Bouchard, 2001; Malina, 1996; Nelson, Gordon-Larsen, Adair, & Pop kin, 2005). In Northern Ireland, Boreham and colleagues showed, in accordance with our findings, that tracking of body composition indicators (weight, BMI and sum of skinfolds) was stronger than the tracking of physical activity (Boreham et al., 2004). Cross-sectional associations between physical activity and body composition should be interpreted with caution due to reverse causality (Mamabolo et al., 2007; Rizzo, Ruiz, Oja, Veidebaum, & Sjostrom, 2008). For these reasons, prospective studies are needed in this field (Hallal et al., 2006a; Mattocks et al., 2008). Data from the Avon Longitudinal Study of Parents and Children (ALSPAC) in the UK show that physical activity, measured by accelerometry at 12 years, was inversely associated with fat mass at 14 years both in boys and girls (Riddoch et al., 2009). There are at least two possible explanations for the discrepancies between the Pelotas and ALSPAC findings. First, due to the different natures and expressions of physical activity in high vs. low and middle income countries, (Guthold, Ono, Strong, Chatterji, & Morabia, 2008; Hallal, Victora, Wells, & Lima, 2003) the association with body composition may vary from setting to setting. Second, the different statistical method employed in each study may explain part of the discrepancies. In the ALSPAC study, final body composition was not adjusted for baseline body composition, thus making it difficult to disentangle the tracking effects from the prospective associations (Riddoch et al., 2009). However, even if we repeat the statistical approach used in the ALSPAC cohort (data available upon request) our findings do not show the same, thus proving that the statistical method is not the explanation for the discrepancy in our findings.
There has been much speculation that secular declines in physical activity level have played a key role in the emergence of the childhood obesity epidemic. Our data cast doubt on this interpretation in this particular population, as we find little indication of physical activity impacting on body composition in Brazilian adolescents, whereas in contrast, tracking of adiposity was very strong. It is important to bear in mind, however, that we examined a 3.4-years period, and that long-term associations between physical activity and body composition may show up in studies with longer follow-up. It is important to stress that our findings do not mean that physical activity would not be an effective strategy for reducing obesity. Regardless of whether lower activity induced obesity, numerous studies demonstrate that activity interventions can promote weight loss among obese adolescents, (Reichert et al., 2009) and therefore, should be encouraged. Here it seems essential to differentiate the roles of activity at preventing unhealthy weight gain and at promoting weight loss among obese individuals. These are two different concepts that need to be dealt with separately. In spite of the role of physical activity, it seems that we need to look elsewhere to account for the increasing prevalence of obesity in Brazilian adolescents.
The difficulty of identifying the direction of associations between physical activity and body composition is well known in this field (Ekelund et al., 2008). A particularly valuable study on this issue showed that fatness in early infancy predicted activity in later infancy, whereas activity level in early infancy did not predict fatness in late infancy. Cross-sectional associations were evident at both time points (Li et al., 1995), implying that the prospective impacts of physical activity during childhood should ideally be addressed only by taking this reciprocal association with body composition into account. Prospective studies which have collected these variables over time may wish to reanalyse their datasets in order to study the effects of body composition on later physical activity.
Contributors
P.C. Hallal had the original idea for these analyses, coordinated the 11.3 years follow up visit of the 1993 Pelotas cohort, performed the literature review, and led the writing process. F.F. Reichert coordinated the 13.3 years sub-study, and co-led the analysis of the accelerometry data. U. Ekelund was responsible for checking the quality of the physical activity data collected in the cohort and co-led the analyses of the accelerometry data. S.C. Dumith was responsible for the data analyses and coordinated the 14.7 years visit of the 1993 Pelotas cohort. A.M. Menezes and C.G. Victora are the principal investigators of the 1993 Pelotas Birth Cohort Study, reviewed the research protocol and provided inputs on the manuscript at all stages. J.C. Wells was responsible for the body composition data in all visits, critically reviewed the text and the analyses. All authors revised early drafts of the manuscript and agreed with its final version.
Acknowledgements
This analysis was supported by the Wellcome Trusts initiative entitled Major Awards for Latin America on Health Consequences of Population Change. Earlier phases of the 1993 cohort study were funded by the European Union, the National Program for Centers of Excellence (Brazil), the National Research Council (Brazil) and the Ministry of Health (Brazil). Pedro C Hallal is a Newton International Fellow, funded by the Royal Society.
References
- Azevedo M.R., Horta B.L., Gigante D.P., Victora C.G., Barros F.C. Fatores associados ao sedentarismo no lazer de adultos na coorte de nascimentos de 1982, Pelotas, RS. Revista de Saúde Pública. 2008;42:70–77. doi: 10.1590/s0034-89102008000900010. [DOI] [PMC free article] [PubMed] [Google Scholar]
- Bastos J.P., Araujo C.L., Hallal P.C. Prevalence of insufficient physical activity and associated factors in Brazilian adolescents. Journal of Physical Activity and Health. 2008;5(6):777–794. [PubMed] [Google Scholar]
- Boreham C., Robson P.J., Gallagher A.M., Cran G.W., Savage J.M., Murray L.J. Tracking of physical activity, fitness, body composition and diet from adolescence to young adulthood: The Young Hearts Project, Northern Ireland. International Journal of Behavioral Nutrition and Physical Activity. 2004;1(1):14. doi: 10.1186/1479-5868-1-14. [DOI] [PMC free article] [PubMed] [Google Scholar]
- Cheng S., Volgyi E., Tylavsky F.A., Lyytikainen A., Tormakangas T., Xu L., et al. Trait-specific tracking and determinants of body composition: A 7-year follow-up study of pubertal growth in girls. BMC Medicine. 2009;7:5. doi: 10.1186/1741-7015-7-5. [DOI] [PMC free article] [PubMed] [Google Scholar]
- Ekelund U., Brage S., Besson H., Sharp S., Wareham N.J. Time spent being sedentary and weight gain in healthy adults: Reverse or bidirectional causality? American Journal of Clinical Nutrition. 2008;88(3):612–617. doi: 10.1093/ajcn/88.3.612. [DOI] [PubMed] [Google Scholar]
- Fortier M.D., Katzmarzyk P.T., Malina R.M., Bouchard C. Seven-year stability of physical activity and musculoskeletal fitness in the Canadian population. Medicine and Science in Sports and Exercise. 2001;33(11):1905–1911. doi: 10.1097/00005768-200111000-00016. [DOI] [PubMed] [Google Scholar]
- Guthold R., Ono T., Strong K.L., Chatterji S., Morabia A. Worldwide variability in physical inactivity a 51-country survey. American Journal of Preventive Medicine. 2008;34(6):486–494. doi: 10.1016/j.amepre.2008.02.013. [DOI] [PubMed] [Google Scholar]
- Hallal P.C., Bertoldi A.D., Goncalves H., Victora C.G. [Prevalence of sedentary lifestyle and associated factors in adolescents 10 to 12 years of age] Cadernos de Saúde Pública. 2006;22(6):1277–1287. doi: 10.1590/s0102-311x2006000600017. [DOI] [PubMed] [Google Scholar]
- Hallal P.C., Victora C.G., Azevedo M.R., Wells J.C. Adolescent physical activity and health: A systematic review. Sports Medicine. 2006;36(12):1019–1030. doi: 10.2165/00007256-200636120-00003. [DOI] [PubMed] [Google Scholar]
- Hallal P.C., Victora C.G., Wells J.C., Lima R.C. Physical inactivity: Prevalence and associated variables in Brazilian adults. Medicine and Science in Sports and Exercise. 2003;35(11):1894–1900. doi: 10.1249/01.MSS.0000093615.33774.0E. [DOI] [PubMed] [Google Scholar]
- Li R., O'Connor L., Buckley D., Specker B. Relation of activity levels to body fat in infants 6 to 12 months of age. The Journal of Pediatrics. 1995;126(3):353–357. doi: 10.1016/s0022-3476(95)70447-7. [DOI] [PubMed] [Google Scholar]
- Malina R.M. Tracking of physical activity and physical fitness across the lifespan. Research Quarterly for Exercise and Sport. 1996;67(Suppl. 3):S48–57. doi: 10.1080/02701367.1996.10608853. [DOI] [PubMed] [Google Scholar]
- Mamabolo R.L., Kruger H.S., Lennox A., Monyeki M.A., Pienaar A.E., Underhay C., Czlapka-Matyasik M. Habitual physical activity and body composition of black township adolescents residing in the North West Province, South Africa. Public Health Nutrition. 2007;10(10):1047–1056. doi: 10.1017/S1368980007668724. [DOI] [PubMed] [Google Scholar]
- Mattocks C., Ness A., Deere K., Tilling K., Leary S., Blair S.N., et al. Early life determinants of physical activity in 11 to 12 year olds: Cohort study. British Medical Journal. 2008;336(7634):26–29. doi: 10.1136/bmj.39385.443565.BE. [DOI] [PMC free article] [PubMed] [Google Scholar]
- Metcalf B.S., Hosking J., Jeffery A.N., Voss L.D., Henley W., Wilkin T.J. Fatness leads to inactivity, but inactivity does not lead to fatness: A longitudinal study in children (EarlyBird 45) Archives of Disease in Childhood. 2010. doi: 10.1136/adc.2009.175927. [DOI] [PubMed]
- Nelson M.C., Gordon-Larsen P., Adair L.S., Popkin B.M. Adolescent physical activity and sedentary behavior: Patterning and long-term maintenance. American Journal of Preventive Medicine. 2005;28(3):259–266. doi: 10.1016/j.amepre.2004.12.006. [DOI] [PubMed] [Google Scholar]
- Peeters M.W., Beunen G.P., Maes H.H., Loos R.J., Claessens A.L., Vlietinck R., et al. Genetic and environmental determination of tracking in subcutaneous fat distribution during adolescence. American Journal of Clinical Nutrition. 2007;86(3):652–660. doi: 10.1093/ajcn/86.3.652. [DOI] [PubMed] [Google Scholar]
- Raustorp A., Archer T., Svensson K., Perlinger T., Alricsson M. Physical self-esteem, a five year follow-up study on Swedish adolescents. International Journal of Adolescent Medicine and Health. 2009;21(4):497–507. doi: 10.1515/ijamh.2009.21.4.497. [DOI] [PubMed] [Google Scholar]
- Reichert F.F., Menezes A.M., Wells J.C., Dumith S., Hallal P.C. Physical activity as a predictor of adolescent body fatness: A systematic review. Sports Medicine. 2009;39(4):279–294. doi: 10.2165/00007256-200939040-00002. [DOI] [PubMed] [Google Scholar]
- Riddoch C.J., Leary S.D., Ness A.R., Blair S.N., Deere K., Mattocks C., et al. Prospective associations between objective measures of physical activity and fat mass in 12–14 year old children: The Avon Longitudinal Study of Parents and Children (ALSPAC) British Medical Journal. 2009;339:b4544. doi: 10.1136/bmj.b4544. [DOI] [PMC free article] [PubMed] [Google Scholar]
- Rizzo N.S., Ruiz J.R., Oja L., Veidebaum T., Sjostrom M. Associations between physical activity, body fat, and insulin resistance (homeostasis model assessment) in adolescents: The European Youth Heart Study. American Journal of Clinical Nutrition. 2008;87(3):586–592. doi: 10.1093/ajcn/87.3.586. [DOI] [PubMed] [Google Scholar]
- Wells J.C., Coward W.A., Cole T.J., Davies P.S. The contribution of fat and fat-free tissue to body mass index in contemporary children and the reference child. International Journal of Obesity and Related Metabolic Disorders. 2002;26(10):1323–1328. doi: 10.1038/sj.ijo.0802077. [DOI] [PubMed] [Google Scholar]
- Wells J.C., Hallal P.C., Wright A., Singhal A., Victora C.G. Fetal, infant and childhood growth: Relationships with body composition in Brazilian boys aged 9 years. International Journal of Obesity. 2005;29(10):1192–1198. doi: 10.1038/sj.ijo.0803054. [DOI] [PubMed] [Google Scholar]