

Abstract
Reaction time (RT) variability on a Stop Signal task was examined among children with attention deficit hyperactivity disorder (ADHD) symptoms and/or dyslexia in comparison to typically developing (TD) controls. Children's go-trial RTs were analyzed using a novel ex-Gaussian method. Children with ADHD symptoms had increased variability in the fast but not the slow portions of their RT distributions compared to those without ADHD symptoms. The RT distributions of children with dyslexia were similar to those of TD-controls. It is argued that variability in responding may be underpinned by impairments in response preparation or timing during Stop Signal tasks.
Attention deficit hyperactivity disorder (ADHD) is a prevalent and debilitating neurodevelopmental disorder characterized by difficulties with attention, hyperactivity, and impulsivity (American Psychiatric Association, 2000). A deficit in response inhibition has been identified as one of several possible endophenotypes of ADHD (Castellanos & Tannock, 2002; Doyle et al., 2005) and current models of ADHD emphasize impaired response inhibition as either the core deficit in ADHD (Barkley, 1997, 1999; Quay, 1997) or as one of three independent pathways to the disorder (Sonuga-Barke, Bitsakou, & Thompson, 2010).
Deficits in response inhibition have also been found in dyslexia (e.g., Willcutt, Pennington, Olson, Chhabildas, & Hulslander, 2005a); a neurodevelopmental disorder that co-occurs more frequently with ADHD than would be expected by chance (Willcutt & Pennington, 2000). Dyslexia is characterized by difficulties in acquiring reading and spelling skills at a level commensurate with an individual's age (Hulme & Snowling, 2009; Snowling, 2009) and it is well accepted that a phonological deficit is the proximal cognitive cause of dyslexia (Vellutino, Fletcher, Snowling, & Scanlon, 2004). Research demonstrating impaired response inhibition in dyslexia has been interpreted as evidence for the shared etiology hypothesis—that the frequent co-morbidity between ADHD and dyslexia is due to shared risk factors (De Jong, Oosterlaan, & Sergeant, 2006).
The Stop Signal task (Logan, 1994) has been widely used as a measure of the ability to inhibit prepotent and ongoing responses in the ADHD literature (see Willcutt, Doyle, Nigg, Faraone, & Pennington, 2005b, for a review). Like other measures used to index the construct of behavioral inhibition (e.g. the Go/No-Go task) the Stop Signal task involves responding to a primary go-stimulus (e.g., a choice reaction time task) and intermittently withholding a response when presented with a less frequent (usually ∼25% of trials) secondary stop-stimulus (e.g., an auditory or visual cue) which follows the go-stimulus with fixed or variable stimulus-onset asynchronies (the stop-signal delay (SSD)) (see Logan, 1994; Logan, Schachar, & Tannock, 1997). Mean reaction time (MRT) to the go-stimulus is recorded and stop signal reaction time (SSRT), an index of inhibitory control, is typically calculated by subtracting the SSD from MRT (Logan et al., 1997).
Research using the Stop Signal task to examine inhibition in ADHD has generally used conventional data analytic approaches based on comparing MRTs and SSRTs of children with and without ADHD. In addition to having longer SSRTs than children without ADHD (see Alderson, Rapport, & Kofler, 2007; Lijffijt, Kenemans, Verbaten, & Engeland, 2005; Oosterlaan, Logan & Sergeant, 1998 for reviews), children with ADHD have been found to be slower (longer MRTs) and more variable (greater standard deviation of reaction times (SDRT)) in their response to go-trials in the Stop Signal paradigm (Alderson et al., 2007; Kunsti, Oosterlaan, & Stevenson, 2001; Lijffijt et al., 2005; Oosterlaan et al., 1998); a finding that has been replicated in children with dyslexia (Willcutt et al., 2005a). Together, findings such as these have led to a debate as to whether long SSRTs, characteristic of children with ADHD, reflect slow inhibitory processing or whether they are a consequence of slower and/or more variable reaction times (RTs) on the Stop Signal task go-trials (Alderson et al., 2007; Alderson, Rapport, Sarver & Kofler, 2008; Liddle et al., 2009). Indeed, slower and more variable RTs have been found to be characteristic of ADHD responding on a number of different tasks (e.g., Alderson et al., 2007; Castellanos et al., 2005; Epstein et al., 2011; Johnson et al., 2007; Klein, Wendling, Huettner, Ruder, & Peper, 2006; Leth-Steenson, King Elbaz, & Douglas, 2000; Lijffijt et al., 2005; Oosterlaan et al., 1998) and intra-individual variability has been put forward as a candidate endophenotype of ADHD (Castellanos & Tannock, 2002; Doyle et al., 2005).
Investigating group differences in responding on the Stop Signal task in terms of MRTs and SDRTs (a measure of intra-individual variability) yields interesting findings. However, there is increasing recognition that details of the distributions of RTs can potentially be very informative about the nature of underlying mechanisms (Heathcote, Popiel, & Mewhort, 1991; Ratcliff & Murdock 1976). There are a number of possible reasons for the differences in response patterns between participants with and without ADHD on Stop Signal tasks: (1) The RT distributions of children with ADHD may have a similar shape but a higher mean than those of controls— indicative of generally slower responding; (2) The RT distributions of children with ADHD might be characterized by a larger skew, indicating more long responses falling within the tail of the distribution, but with a similar mean value; and (3) The RT distributions of children with ADHD may be more variable overall indicating a larger spread of responses around the mean, but with a similar mean value.
EX-GAUSSIAN ANALYSIS
Luce (1986) suggests that the ex-Gaussian model provides a good method for describing RT distributions. An ex-Gaussian (Figure 1, c) is formed from the mathematical combination (convolution) of a normal (or Gaussian) distribution (Figure 1, a) and an exponential distribution (Figure 1, b). The exponential function accounts for the positive skew observable in RT distributions. The ex-Gaussian has been found to provide a good fit to RT data from a number of different paradigms (Heathcote et al., 1991; Hockley, 1984; Mewhort, Braun, & Heathcote, 1992; Ratcliff, 1979).
FIGURE 1.
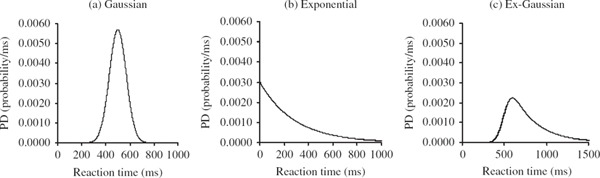
Probability density (PD) functions for (a) a Gaussian distribution with μ = 500 and σ = 70 (b) an exponential distribution with τ = 285. The convolution of the Gaussian and exponential distributions results in the positively skewed ex-Gaussian distribution (c).
Estimates of three parameters, μ (mu), σ (sigma), and τ (tau), are obtained from fitting an ex-Gaussian distribution to RT data: mu and sigma represent the mean and standard deviation of the Gaussian component of the distribution; tau represents the exponential component and characterizes the comparatively long RTs in the tail of the distribution. Unlike other methods of examining skew (or the number of long RTs within a RT distribution), which involve rank ordering RTs and dividing the distribution into separate bins, tau integrates information from all RTs in the distribution. Conventional measures of central tendency and variation can also be expressed as functions of ex-Gaussian parameters (Ratcliff, 1979): the mean of the overall distribution is the sum of mu and tau (μ + τ), and the overall variance is the sum of sigma squared and tau squared (σ2 + τ2).
To date few studies have used ex-Gaussian analyses to examine the nature of RT variability in children with ADHD and none have used this method to investigate the RT distributions of children with dyslexia. Of the seven studies that have used this technique in the ADHD literature (Buzy, Medoff, & Schweitzer, 2009; Epstein et al., 2006, 2011; Geurts et al., 2008; Hevery et al., 2006; Leth-Steensen et al., 2000; Vaurio, Simmonds, & Mostofsky, 2009), the majority have found that tau, which represents the exponential component or the positive skew in RT distributions (usually elevated in ADHD), is most sensitive to group differences. Leth-Steensen et al. (2000) found that of all the Ex-Gaussian parameters, tau discriminated best between children with and without ADHD on a four-choice RT task. However, on tasks requiring greater executive control (e.g. Continuous Performance Tasks, Go/No-Go tasks and working memory tasks), the RT distributions of children with ADHD have been found to be characterized by significantly larger values of both tau and sigma, reflecting increased variability throughout the RT distribution, compared to those of typically developing (TD) controls (Hervey et al., 2006; Vaurio et al., 2007; Buzy et al., 2009). Hervey et al. (2006) also found that in comparison to controls, children with ADHD demonstrated significantly faster RTs in the normal part of their RT distributions (smaller values of mu) on the Connors’ Continuous Performance test; perhaps reflecting their impulsive nature.
Epstein et al. (2006) investigated the effect of stimulant medication on ADHD responding during a Continuous Performance Task and found that the effect of medication was largest on tau. Stimulant medication acted to slow down the responses of children with ADHD (evidenced by increased values of mu) and reduce the variability in their responses around the mean (evidenced by decreased values of sigma) while also reducing the number of extremely long responses within their RT distributions (evidenced by a reduction in the values of Tau) (Epstein et al., 2006). More recently, Epstein et al. (2011) replicated the finding of increased RT variability, as measured by the ex-Gaussian indicator tau, in children with ADHD across a number of different tasks (including the Stop Signal task). In this study increased values of sigma were not related to ADHD group status. Instead sigma, along with the other ex-Gaussian parameters, was largely related to event rate manipulations (all three ex-Gaussian parameters (mu, sigma and tau) increased as the event rate or ISI (1 sec, 3 sec, or 5 sec) slowed). Geurts et al. (2008) also investigated RT variability in children with and without ADHD using a short (3 min) two-choice RT task however they did not find significant difference in sigma or tau between the groups. Both Geurts et al. (2008) and Vaurio et al. (2009) suggest that ADHD related variability may become more apparent on longer tasks (e.g., the tasks used by Epstein et al. (2011), were each around 21 min long) or under conditions that require a higher degree of response control (e.g., on Go/No-Go or Stop Signal tasks compared to on a choice RT task).
Although RT variability is a consistent finding in the ADHD literature the cause of this phenomenon is unclear. Epstein, Hwang, Antonini, Langberg, Altaye, and Arnold (2010) found that in comparison to TD-controls, children with ADHD continued to have longer RTs to trials immediately following an omission error. They suggested that omission errors may be the initial sign of an attentional lapse and that the subsequent long RTs may indicate continued inattention or impaired error monitoring in children with ADHD. In line with this view a number of other researchers have suggested that the variability associated with ADHD, particularly the long RTs that contribute to large values of tau, may reflect impairments in attentional processes (Bellgrove, Hester, & Garavan, 2004; Hervey et al., 2006; Leth-Steensen et al., 2000). Other possible explanations of the increased response variability in ADHD include deficient state regulation (Kunsti et al., 2001), deficits in motor timing (Rubia et al., 2001) or impairments in the neural mechanisms involved in response preparation (Vaurio et al., 2009).
This article presents a novel analysis of children's RTs to go-trials in a Stop Signal task using an ex-Gaussian model. The children in this study completed the Stop Signal task as part of a larger study investigating the cognitive profiles of children with ADHD symptoms and/or dyslexia and data pertaining to summary measures of SSRT, MRT, and SDRT for the four groups are presented in Gooch, Snowling, and Hulme (2011). By conducting this more fine-grained analysis of the children's go-trial RT distributions we hope to determine the mechanisms underpinning the more variable responses on the Stop Signal task that have been found to be characteristic of children with symptoms of ADHD (Gooch et al., 2011; see also Alderson et al., 2007; Kunsti et al., 2001; Lijffijt et al., 2005; Oosterlaan et al., 1998).
Given previous findings (e.g., Buzy et al., 2009; Epstein et al., 2006, 2011; Hervey et al., 2006; Leth-Steensen et al., 2000; Vaurio et al., 2009) it seems reasonable to predict that (1) the RT distributions of children with ADHD symptoms will be characterized by a larger proportion of very slow RTs (increased tau) than those of children without ADHD symptoms, perhaps resulting from fluctuations in attention, and that 2) the RT distributions of children with ADHD symptoms will show a larger spread of RTs (increased sigma) than those of children without ADHD symptoms, perhaps as the result of an impairment in the mechanisms involved in response preparation.
A further aim of this study was to investigate the impact of co-morbid dyslexia on the responding of children with ADHD symptoms during the Stop Signal paradigm and to consider what this can tell us about the co-morbidity between these two developmental disorders. The finding that children with dyslexia, like children with ADHD, have slow and more variable RTs on the Stop Signal task (e.g., Willcutt et al., 2005a) has been interpreted as support for the “shared aetiology” hypothesis (De Jong et al., 2006). Alternatively, it has been proposed that co-morbid ADHD and dyslexia could be characterized by a unique “cognitive subtype” (Rucklidge & Tannock, 2002; see de Jong et al., 2006 for a discussion) in which cognitive deficits are different, or more severe, than those apparent in either ADHD or dyslexia alone. By exploring how the RT distributions of children with ADHD symptoms + dyslexia differ in comparison to children with either single disorder (ADHD symptoms-only and dyslexia-only) we hope to tests these alternative hypotheses.
METHOD
In the current study we examine the go-trial RT distributions from 97 children who completed the Stop Signal task as part of a larger test battery (see Gooch et al., 2011).
Participants
Children with ADHD symptoms and/or dyslexia were recruited from a Child and Adolescent Mental Health Service (CAMHS) Department, the Centre for Reading and Language, Dyslexia Action and from schools in York, England. TD children were recruited from the same schools as the children with ADHD symptoms and dyslexia. Ethical clearance for this study was granted by the University of York, Department of Psychology, Ethics Committee and by the York, NHS Research Ethics Committee. Informed parental consent was obtained and the children completed consent forms prior to participating.
All children completed a screening assessment including the Matrices, Vocabulary, Word Reading and Spelling subtests from the British Abilities Scales-II (BAS II; Elliott, Smith, & McCulloch, 1996) and their parents and teachers were asked to complete an ADHD symptoms rating scale (e.g. Barkley & Murphy, 1998; Hulslander et al., 2004). Parents concerned about their child's attention/behavior or reading skills were also asked to complete the Strengths and Difficulties Questionnaire (SDQ; Goodman, 2005). Children were excluded if they obtained a below average non-verbal ability score (BAS II Matrices T score < 40). None of the participating children had known neurological or sensory impairments. Children were assigned to groups according to the criteria outlined below. Children who met criteria for both ADHD symptoms and dyslexia were assigned to the ADHD symptoms + dyslexia group. Participants who were receiving psychostimulant medication for ADHD (n = 9; methylphenidate in all cases) were asked to discontinue their medication at least 24 h prior to the research session.
Classification of ADHD symptoms
The rating scale used to measure ADHD symptoms in this study contained statements pertaining to each of the 18 Diagnostic and Statistical Manual of Mental Disorders (4th ed. [DSM-IV]; American Psychiatric Association, 2000) ADHD symptoms. Nine of the statements targeted symptoms of inattention (e.g. “Is good at sustaining attention on tasks or play activities”) and nine targeted symptoms of hyperactivity/impulsivity (e.g., “Runs about or climbs excessively in situations in which it is inappropriate”). Respondents were asked to rate the child's behavior over the past 6 months on a four-point scale from 0 (false) to 3 (true) for each statement (this rating scale can be obtained from the authors). As in previous studies in which similar rating scales were used (e.g., Willcutt et al., 2005a) ratings of 2 or 3 were deemed clinically significant and thus scored as a positive symptom (scoring was reversed for positively worded items). Completed questionnaires were returned from both parents and teachers for 52 of the children, only teacher ratings were received for 39 of the children and only parent ratings were received for 10 of the children.
Internal reliability of the ADHD symptoms rating scale was high (Cronbach's alpha of .95 and .94 for parent and teacher ratings, respectively) and as with similar ADHD rating scales the correlations between parent and teacher ratings were moderate (overall ADHD symptom ratings correlated at r = .53, inattentive symptom ratings correlated at r = .39 and hyperactive-impulsive symptom ratings correlated at r = .66). Furthermore, there was a strong correlation (r = .78) between the total number of ADHD symptoms and the children's ratings on the SDQ hyperactivity subscale suggesting that these two scales measure similar constructs.
Children were classed as having ADHD symptoms if they had six or more symptoms in either the inattention or hyperactivity/impulsivity domain, or if they had more than six symptoms in both domains as rated by either their parent or teacher; 44 children met criteria for ADHD symptoms. The majority were rated as inattentive (n = 22) or as showing deficits in both domains (n = 20). Only two children were rated as having only hyperactive/impulsive symptoms and in the interest of obtaining a homogenous group of children with ADHD symptoms these children were excluded from the study. Of the children with ADHD symptoms, 15 had previously received a clinical diagnosis of ADHD combined-type, in the absence of any other co-morbid diagnosis, by an experienced multidisciplinary CAMHS team in York. The remaining 27 children were recruited on the basis of substantial parental/teacher concerns about their attention and behavior but did not have a clinical diagnosis. In Gooch et al. (2011) we report a comparison of the children with ADHD symptoms with and without a clinical diagnosis of ADHD, which shows that both groups performed within the average range for their age on measures of non-verbal IQ and they did not differ significantly in terms of age, verbal IQ, reading, or spelling scores. Furthermore, although children with a diagnosis of ADHD tended to be rated by parents as showing more symptoms of inattention and hyperactivity/impulsivity than children without a diagnosis, overall teacher ratings did not significantly differ between the groups and both groups were rated as having significantly more symptoms of ADHD than TD-controls.
Children with additional diagnoses of other behavioral disorders (e.g., Autism Spectrum Disorders, conduct disorder or oppositional defiant disorder), as reported by parents or clinicians in the CAMHS team, were not recruited to the study to rule out the possibility that such co-morbidities could account for the increased response variability associated with ADHD (e.g., Geurts et al., 2008).
Classification of dyslexia
Children who obtained standard scores of 85 or below (i.e., greater that 1 standard deviation from the mean) on either the BAS II Word Reading or the Spelling scales, were classified as having dyslexia (n = 42). Those with standard scores above 85 were considered to be normal readers (n = 59).
Sample characteristics
Four groups of children aged between 6 years and 14.75 years (mean = 10.33, SD = 2.17) completed the Stop Signal task: 17 with ADHD symptoms-only (6 female), 17 with dyslexia-only (5 female), 25 with ADHD symptoms + dyslexia (6 female) and 38 TD-controls (21 female). Children in the TD-control group performed within the normal range for their age on the BAS II Matrices, Word Reading and Spelling scales (standard scores greater than 85) and did not meet criteria for ADHD symptoms as rated by teachers or parents. Teachers also confirmed the absence of any difficulties with attention, behavior, or learning in these children.
From Table 1 it can be seen that the groups did not differ significantly in age or non-verbal ability (Matrices) but children with ADHD symptoms + dyslexia obtained lower Vocabulary scores than the other groups. As expected, children with ADHD symptoms (ADHD symptoms-only and ADHD symptoms + dyslexia) were rated by both teachers and parents as having more symptoms of ADHD than children without ADHD symptoms (dyslexia-only and TD-controls). In addition, children with dyslexia (dyslexia-only and ADHD symptoms + dyslexia) had lower reading and spelling scores than children without dyslexia (ADHD symptoms-only and TD-controls). Importantly, the percentage of children with predominantly inattentive symptoms was similar across the groups (53% in the ADHD symptoms-only group and 52% in the ADHD symptoms + dyslexia group) and children with ADHD symptoms + dyslexia did not exhibit more symptoms of ADHD than the ADHD symptoms-only group or more severe reading difficulties than children with dyslexia-only. Thus the co-occurrence of ADHD symptoms and dyslexia was not confounded with ADHD subtype or severity.
TABLE 1.
Characteristics of Children With ADHD Symptoms-Only, Dyslexia-Only, ADHD Symptoms + Dyslexia and TD-Controls Who Completed the Stop Signal Task; Means (Standard Deviations) and Results From One-Way ANOVAs
| TD-Controls (n = 38) | ADHD Symptoms-Only (n = 17) | Dyslexia-Only (n = 17) | ADHD Symptoms + Dyslexia (n = 25) | F | P | ηp2 | |||||
|---|---|---|---|---|---|---|---|---|---|---|---|
| Age | 10.48a | (2.55) | 9.54a | (2.60) | 10.69a | (1.77) | 10.33a | (1.42) | .94 | .42 | .03 |
| Vocabulary (VIQ)12 | 47.39a | (7–73) | 47.82ab | (7.87) | 46.53a | (3.86) | 41.24b | (8.02) | 4.32 | .01 | .12 |
| Matrices (NVIQ)1‘2 | 52.79a | (5.73) | 51.82a | (6.17) | 51.41a | (7.52) | 51.72a | (5.53) | .28 | .84 | .01 |
| Word reading13 | 106.76a | (10.66) | 101.53a | (12.41) | 75.47c | (6.44) | 81.92b | (8.22) | 57.64 | <.01 | .65 |
| Spelling1,3 | 108.45a | (10.78) | 100.76a | (10.24) | 79.18b | (8.99) | 75.28b | (6.48) | 79.24 | <.01 | .72 |
| (n = 10)y | (n = 14)y | (n = 15)y | (n = 23)y | ||||||||
| Parent rated inattention (9) | 2.00a | (1.70) | 7.36b | (1.39) | 3.07a | (1.71) | 6.70b | (1.79) | 34.07 | <.01 | .64 |
| Parent rated hyperactivity/impulsivity (9) | 1.10a | (1.20) | 5.14b | (3.37) | 1.33a | (1.54) | 4.57b | (3.45) | 8.09 | <.01 | .30 |
| (n = 34)z | (n = 17)z | (n = 16)z | (n = 20)z | ||||||||
| Teacher rated inattention (9) | .82a | (1.27) | 4.7 lc | (2.80) | 2.38b | (1.67) | 6.00c | (2.51) | 32.24 | <.01 | .54 |
| Teacher rated hyperactivity/impulsivity (9) | .35a | (−69) | 4.18b | (2.65) | .81a | (1.05) | 3.15b | (2.60) | 22.20 | <.01 | .45 |
Subtests from BAS-II, 2T scores, 3Standard scores, ySubsample with parent ratings of attention deficit hyperactivity disorder (ADHD) symptoms, zSubsample with teacher ratings of ADHD symptoms. Means with common subscripts are not significantly different after Games-Howell correction for multiple comparisons (p < .05). NVIQ = non-verbal IQ; TD = typically developing; VIQ = verbal IQ.
Procedure
Behavioral inhibition was assessed using a computerized Stop Signal task, which was adapted for use with children from that described by Logan et al. (1997) by reducing the number of experimental trials and increasing the time allowed for responding. The primary go-task was a visual choice RT task; a 500 msec central fixation point was followed by the presentation of either the letter x or o for 2,000 msec. On 25% of the trials a stop-signal (100 msec, 1000Hz auditory tone) was presented shortly after the x or o appeared on the screen informing the participant that they must inhibit their response to the go-task on that trial (stop-task). The children were instructed to press the letter on the keyboard corresponding to the letter on the screen as quickly as possible but to try to stop their response if they heard the stop-signal.
The delay between the presentation of the visual stimulus and the onset of the stop-signal (stop-signal delay; SSD) was initially set to 250 msec and was adjusted up or down in 50 msec increments depending on the accuracy of the child's response (Logan et al., 1997). This procedure converged on the SSD at which the child failed to inhibit on 50% of the trials. After completing two blocks of practice trials (24 go-task trials followed by the random presentation of 18 goand 6 stop-trials) with feedback on accuracy and speed, the children completed three blocks of trials each comprising 30 go-task trials interspersed with 10 stop-task trials. On each trial RT and response accuracy were recorded.
Data Screening
Four children (1 child with ADHD symptoms + dyslexia and 3 TD-controls) obtained fewer than 66% correct responses on the Stop Signal task go-trials suggesting that they were not fully engaged in the task. Thus, in line with other studies using the Stop Signal task (e.g., Schachar, Mota, Logan, Tannock, & Klim, 2000) the data from these participants were removed from further analyses. The mean probability of successfully inhibiting on a stop-trial was around .50 for all four groups as intended (ADHD symptoms-only = .53; dyslexia-only = .54; ADHD symptoms + dyslexia = .51; TD-controls = .54). These data confirm that the Stop Signal task tracking algorithm succeeded in converging on a delay that allowed participants to inhibit responses roughly half of the time. Furthermore, none of the remaining children showed extremely low (<.10) or extremely high (>.90) probabilities of responding on the stop-task trials. Extremely high probabilities of responding on a stop-trial indicate that children may not have been attempting to inhibit whereas as extremely low probabilities of responding indicate that the child may have been waiting for the stop-signal.
Only RTs from correct go-trials were included in the ex-Gaussian analysis; since the overall error rates were low (<10%) very few trials were excluded from the analysis. Additionally, given the non decision portion of simple RT is approximately 100 msec (Luce, 1986), all RTs of less than 100 msec (0.11% of the total trials) were discarded as anticipatory errors. Some studies also remove outlying RTs that fall several standard deviations above the mean for each group (e.g., Williams, Strauss, Hultsch, Hunter, & Tannock, 2007; cf. Epstein et al., 2011; Hervey et al., 2006; Vaurio et al., 2009). However, given that we are in interested in whether the increased variability in ADHD is related to an increased number of very long RTs within these children's RT distribution, RTs at the high end of the distribution were not trimmed; trimming outlying RTs is also discouraged by Ulrich and Miller (1994).
Data Treatment
Estimates of the three ex-Gaussian parameters (mu and sigma, which represent the mean and standard deviation of the Gaussian component of the distribution, and tau, which represents the exponential component and characterizes the comparatively long RTs in the tail of the distribution) were obtained for each child by fitting an ex-Gaussian distribution to their set of correct Stop Signal task go-trial RTs using Quantile Maximum Probability Estimator (QMPE) v2.18 software; an open-source ANSI Fortran 90 code for response time distribution estimation (Heathcote, Brown, & Mewhort, 2002). QMPE employs an iterative search routine that provides quantile
maximum likelihood estimates for each of the ex-Gaussian parameters (see Heathcote, Brown, & Cousineau, 2004 for details). The number of RT observations used for each ex-Gaussian fit depended on the accuracy of responding (range 61–90).
Ex-Gaussian Fits
To assess the goodness-of-fit of the ex-Gaussian models to the corresponding empirical distribution for each child, the data from each child's RT distribution were divided into equal frequency bins using the formula 2n 2/5 where n is the number of go-trials in each child's distribution (this ranged from 61 to 90). This formula is the one recommended by Heathcote (1996) and is a heuristic suggested by D'Angostino and Stephens (1986, p. 70). A chi-square statistic was then calculated by comparing the observed and expected number of RTs within each of the RT bins. If either the observed or expected values were less than five in any one bin, this bin was combined with the following bin to ensure that the assumptions of the chi-square test were not violated. The ex-Gaussian curve was also plotted on a histogram of the data for each individual to allow for visual inspection of the goodness of fit.
Altogether ex-Gaussian models were fitted to the RT data from 17 children with ADHD symptoms-only, 17 children with dyslexia-only, 24 children with ADHD symptoms + dyslexia and 35 TD-controls. Of these, the ex-Gaussian model fits for the RT data from 2 children with ADHD symptoms-only, 4 children with dyslexia-only, 3 children with ADHD symptoms + dyslexia, and 4 TD-controls were associated with significant chi-square values at the α = .05 level. Although this suggests that the ex-Gaussian model does not adequately characterize these distributions, following Leth-Steensen et al. (2000), it is reasonable to assume that these fits still provide important information regarding the shapes of these distributions. Therefore, the ex-Gaussian parameters for each of these cases were retained in subsequent analyses (the types of RT distributions associated with these cases are illustrated in the Appendix). The removal of these 13 participants does not alter the overall pattern of results. The main effect of ADHD symptoms on sigma remains significant (F = 5.42, p < .05, ηp2 = .07); none of the other main effects of ADHD symptoms or dyslexia on mu, sigma, or tau reach significance and there are no significant interactions.
For three empirical distributions (1 child with ADHD symptoms + dyslexia and 2 TDcontrols) sigma was estimated to be close to zero suggesting that the ex-Gaussian models were a very poor fit to these RT distributions. Furthermore, because the sigma values were so small chi-square could not be calculated. The ex-Gaussian parameter estimates for these three individuals were therefore not analyzed further (the RT distributions for these cases are shown in the Appendix).
RESULTS
Group Differences in Ex-Gaussian Parameters
The means and standard deviations for the four groups for each of the ex-Gaussian parameters are shown in Table 2, together with the results from 2 × 2 (ADHD symptoms × dyslexia) factorial ANOVAs.
TABLE 2.
Comparison of the Four Groups on the Three Parameters Obtained From the Ex-Gaussian Analysis of Stop Signal Task Go-Trial RTs; Main Effects and Interactions From the 2 × 2 ANOVAs
| TD-Controls | ADHD Symptoms-Only | Dyslexia-Only | ADHD Symptoms + Dyslexia | Main Effect | Interaction | |||||||||||||
|---|---|---|---|---|---|---|---|---|---|---|---|---|---|---|---|---|---|---|
| ADHD | Dyslexia | ADHD × Dyslexia | ||||||||||||||||
| Parameter | M | SD | n | M | SD | n | M | SD | n | M | SD | n | F | ηp2 | F | ηp2 | F | ηp2 |
| μ (Mu) (msec) | 473.52 | 115.58 | 33 | 540.55 | 146.97 | 17 | 494.64 | 95.99 | 17 | 494.48 | 185.90 | 23 | 1.20 | .01 | .17 | .00 | 1.21 | .01 |
| σ (Sigma) (msec) | 82.83 | 49.76 | 33 | 134.13 | 103.25 | 17 | 96.31 | 67.86 | 17 | 116.52 | 97.53 | 23 | 4.31∗ | .05 | .01 | .00 | .82 | .01 |
| τ (Tau) (msec) | 171.56 | 99.87 | 33 | 189.54 | 82.71 | 17 | 171.76 | 80.74 | 17 | 191.38 | 82.59 | 23 | .93 | .01 | .00 | .00 | .00 | .00 |
| MRT (msec)1 | 655.21 | 172.11 | 35 | 734.36 | 176.98 | 17 | 664.17 | 142.31 | 17 | 686.46 | 171.20 | 24 | 1.95 | .02 | .29 | .00 | .61 | .01 |
| SDRT (msec)1 | 204.04 | 83.78 | 35 | 250.65 | 80.12 | 17 | 200.33 | 60.22 | 17 | 248.21 | 67.89 | 24 | 8.37∗∗ | .09 | .04 | .00 | .00 | .00 |
These data are different from those presented in Gooch et al. (2011) as here reaction times (RTs) < 100 msec have been excluded. ADHD = attention deficit hyperactivity disorder; TD = typically developing.
p < .05. ∗∗ p < .01.
For mu (the mean of the Gaussian component of the distribution) it is clear that each of the clinical groups show slightly higher values than the TD-controls however the effect sizes for comparisons between children with and without ADHD symptoms and with and without dyslexia are small (Cohen's d = .23 and .02, respectively).
For sigma (the standard deviation of the Gaussian component) the difference between children with and without ADHD symptoms shows a moderate effect size (d = .47) whereas the effect size for comparisons of children with and without dyslexia is very small (d = .09). Children with ADHD symptoms show reliably larger values of sigma than children without ADHD symptoms.
For tau (the exponential component characterizing the comparatively long RTs in the tail of the distribution) there is weak non-significant trend for children with ADHD symptoms to have larger values than those without ADHD symptoms (but again this effect is very small d = .18). Tau is virtually identical in the TD-controls and dyslexia-only groups and the difference between children with and without dyslexia is very small (d = .09).
None of the planned comparisons comparing the co-morbid group (ADHD symptoms + dyslexia) to each of the separate clinical groups (ADHD symptoms-only, or dyslexia-only) were significant (all ts < 1).
Group Response Time Distributions
To illustrate the differences in the RT distributions between the groups, group response time distributions were derived using the Vincent averaging technique recommended by Ratcliff (1979; see also Heathcote, 1996 and Van Zandt, 2000). This involved dividing the RT distribution for each participant into quantiles (13 quantiles were used in this case) and averaging the corresponding quantiles across the participants in each group. These 13 quantiles were used to form 12 intervals each of which contained equal proportions of the RT data (1/13 in this case). The ex-Gaussian was fitted to these averaged quantiles since they formed a representative sample from the average RT distribution (Heathcote, 1996). The group RT distributions are displayed as Vincent histograms in Figure 2. The Vincent histogram bars are all of an equal area. This area represents the probability of participants within the group responding with a RT that falls within the time interval specified by the width of the bar. The solid curves in Figure 2 represent the ex-Gaussian fits for each of the group RT distributions. Chi-square was calculated for each of the four groups, by comparing the group's average number of observed and expected RTs within each quantile. None of the corresponding chi-squared goodness of fit tests were significant suggesting that the ex-Gaussian model fitted the Vincentized data from each group well. The histograms in Figure 2 illustrate that the RT distributions of the groups with ADHD symptoms-only and ADHD symptoms + dyslexia show greater variability than the RT distributions of the dyslexia-only and TD-control groups.
FIGURE 2.
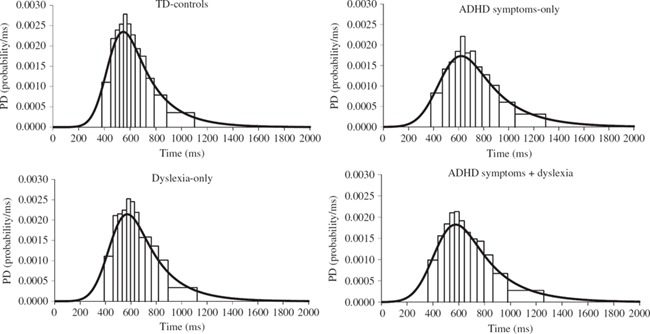
Probability density histograms for the distributions of correct RTs Vincent averaged over the participants in each group. For each of the probability density histograms, the ex-Gaussian distribution for the group is shown (solid line).
DISCUSSION
This study assessed the RT distributions derived from performance on go-trials within a Stop Signal task for children with ADHD symptoms and/or dyslexia, in comparison to TD-controls. The study aimed to determine the source of increased intra-individual variability among children with ADHD symptoms (Gooch et al., 2011; see also Alderson et al., 2007; Lijffijt et al., 2005; Oosterlaan et al., 1998) during the Stop Signal task and to investigate the affect of co-morbid dyslexia on the responding of children with ADHD symptoms. The absence of any difference in mu (the mean of the Gaussian component of the distribution) between children with and without ADHD symptoms suggests that the differences in RTs between these groups do not reflect a generalized slowing of all responses in children with symptoms of ADHD (see also Leth-Steensen et al., 2000). Instead, the results show that children with symptoms of ADHD have increased variability in RTs around the mean in the Gaussian part of the distribution (signified by a larger value of sigma); this pattern was particularly evident in the ADHD symptoms-only group in the current study. Furthermore, the increased variability in responding associated with ADHD symptoms did not appear to reflect an increased number of abnormally slow RTs within these children's distributions; such a pattern would have been signified by a larger value of tau (the exponential component of the distribution). The RT distributions of children with and without dyslexia did not differ in any of the three ex-Gaussian parameters; indeed the RT distributions of children with dyslexia-only and TD-controls were very similar.
The differences in patterns of RT distributions between children with ADHD symptoms (greater variability around the mean of the Gaussian distribution) and children with dyslexia (RT distributions that do not differ from TD-controls) provides further evidence that these two disorders arise from different underlying cognitive mechanisms (see Gooch et al., 2011). Recently it has been suggested that the co-morbidity between ADHD and dyslexia may result from a shared deficit in processing speed (McGrath, Pennington, Shanahan, Santerre-Lemmon, Barnard, & Willcutt, 2011; Shanahan et al., 2006). Given our finding (and that of Bonifacci & Snowling, 2008) that children with dyslexia perform similarly to TD-controls on a basic measure of choice RT further research is clearly necessary to establish the nature and extent of any putative processing speed deficit in dyslexia. It is possible, for example, that a speed of processing deficit might only be found in dyslexic children on tasks requiring speeded access to verbal information while in contrast attentional fluctuations in ADHD lead to processing speed deficits across a much wider variety of tasks. Such a pattern would, in turn, help to clarify the seemingly distinct cognitive impairments that underlie these two disorders.
To date only a few studies have used ex-Gaussian analyses to describe the RT distributions of children with attention difficulties at a fine-grained level. Leth-Steensen et al. (2000) found that the RT distributions of children with ADHD on a choice RT task were characterized by a larger number of abnormally slow RTs signified by larger values of tau; a finding that has been replicated by Vaurio et al. (2009) and Hervey et al. (2006) using RTs from a Go/No-Go task and more recently by Epstein et al. (2011) using a number of different tasks. Leth-Steensen et al. (2000) suggested that larger values of tau may reflect inconsistent effort and fluctuations in attention. In the present study, although there was a weak trend for ADHD symptoms to be associated with larger values of tau, differences between the groups were small.
There are a number of differences between the current study and the previous studies that may account for the failure to replicate the finding that ADHD RTs distributions are often characterized by increased tau (e.g. Epstein et al., 2011; Hervey et al., 2006; Leth-Steensen et al., 2000; Vaurio et al., 2009). First, the lack of a full clinical diagnostic assessment of ADHD is a limitation in this study and may restrict the generalisability of our results to other ADHD samples. However, Geurts et al. (2008) also failed to replicate the effect of ADHD on tau despite using rigorous diagnostic criteria. Second, the Stop Signal task used in the current study is considerably shorter (∼7 min) than the tasks used in other studies examining RT distribution using ex-Gaussian parameters in ADHD (e.g., Epstein et al., 2011; Hervey et al., 2006) and thus RTs may not have been influenced by attentional lapses to the same extent as in longer tasks (Johnson et al., 2007). Consistent with this hypothesis the task used by Geurts et al. (2008) was also short in duration (∼3 min) and the authors argue that this is likely to have contributed to the absence of an effect of ADHD on tau. Finally, our Stop Signal task had a longer ISI (∼2 sec) than is typically used in this paradigm (e.g., Logan et al., 1997; Alderson et al., 2008) to ensure the children had sufficient time in which to make their response. However, Epstein et al.'s (2011) findings suggest that event rate manipulations do not differentially affect children with ADHD compared to TD-controls and that longer ISIs result in slower responding (larger mu) and increased variability (larger sigma and tau) in both groups.
Our finding suggests that it is unlikely that the RT variability associated with ADHD on the Stop Signal task simply reflects fluctuations in effort and/or attention. Rather, in the current study the RT distributions of children with ADHD symptoms were characterized by increased sigma (standard deviation of the Gaussian component) reflecting increased variability throughout the distribution. In an analysis of RTs from Go/No-Go tasks Vaurio et al. (2009) and Hervey et al. (2006) also found that the RT distributions of children with ADHD were characterized by increased values of sigma; Hervey et al. (2006) also found significant group differences in mu reflecting the fact that children with ADHD made more very fast responses than TD children. Importantly, like the Stop Signal task used in the current study, Go/No-Go tasks contain a behavioral control/inhibition component. It follows that impairment in task readiness or response preparation could affect performance on such tasks and this would be reflected in increased variability throughout the task (Vaurio et al., 2009). The trial-to-trial variability characteristic of children with ADHD on tasks that lack an element of inhibitory control (e.g., the simple RT task used by Leth-Steensen) or on very long tasks that challenge the attentional resources of children with ADHD (e.g., those used by Epstein et al., 2011), may on the other hand, result from an increased number of long RTs posited to reflect fluctuations in effort and/or attention (Leth-Steensen et al., 2000). Given the inconstancy in research findings the effect of task type and task length on ex-Gaussian components of the RT distributions of children with ADHD deserves further investigation.
In the light of our findings, we propose that a probable explanation of the increased sigma associated with the go-trial RTs of children with symptoms of ADHD may relate to the response preparation/motor timing demands of the Stop Signal task. Liddle et al. (2009) suggest that in the Stop Signal task, it is vital to exert inhibitory control over go-trial RTs in order to moderate responses so they fall within a narrow time window (i.e., during the Stop Signal task RTs are slowed (e.g., McGarry & Franks, 1997) just enough to increase the chance of inhibitory success while still remaining fast enough to respond before the end of the trial). Furthermore, children will need to adapt their responses to account for the dynamically changing SSD. If this hypothesis is correct, the increased sigma evident in the RT distributions of children with ADHD symptoms in the current study could reflect a difficulty calibrating response times to a given time window to optimize the timing of responses. This explanation is consistent with findings that individuals with ADHD have deficits on tasks that require precise motor timing (e.g., finger tapping) and/or the accurate perception of durations (e.g., time reproduction and duration discrimination tasks; see Toplak, Dockstader, & Tannock, 2006). Indeed it has been suggested that impairments in perceptual and/or motor timing processes are an endophenotype of ADHD that may underpin the intra-individual variability characteristic of the disorder (Castellanos & Tannock, 2002; Rommelse et al., 2008). Further research is needed to understand more fully the relationship between intra-individual variability and timing in ADHD, especially in the light of the fact that our understanding of the cognitive processes that underpin the ex-Gaussian parameters is limited (Matzke & Wagenmaker, 2009).
Finally, we found that the RT distributions of children with dyslexia-only and TD-controls were similar. This contradicts work by Willcutt et al. (2005a) who found that slow and variable responses on a Stop Signal task were characteristic of children with reading disability, in comparison to age-matched controls. The current sample differs from that of Willcutt et al. (2005a) in two ways. First, the children with dyslexia-only in the present sample did not differ from the TD-controls on measures of verbal or non-verbal IQ. Second, dyslexia classification was based on reading and spelling accuracy whereas a composite score that included reading comprehension as well as measures of reading accuracy and spelling was used in the study by Willcutt et al. (2005a). Our finding is in line with Bonifacci and Snowling (2008) who reported that children with dyslexia obtained similar RTs to IQ matched TD-controls. Furthermore, the results of the current study suggest that the increased sigma characteristic of the RT distributions of children with ADHD symptoms cannot be attributed to co-morbid dyslexia.
The results of this study provide support for the hypothesis that increased variability in response times is a fundamental marker ADHD (e.g., Castellanos & Tannock, 2002; Sergeant, Oosterlaan, & Van der Meere, 1999; see Barkley, 2006; Rapport, Chung, Shore, & Isaacs, 2001 for reviews). It has been proposed that the differences in response variability between children with and without ADHD may result from slower cognitive processing (Kalff et al., 2005), slower motor speed (Van Meel, Oosterlaan, Heslenfeld, & Sergeant, 2005), deficient cognitive energetic resources (Sergeant et al., 1999), lack of consistent effort (Oosterlaan & Sergeant, 1996) or deficient attentional processes (Lijffijt et al., 2005). The current study suggests that the cause of the RT variability characteristic of children with ADHD is likely to vary depending on the cognitive demands and length of tasks. The increased variability associated with ADHD symptoms in the current study (increased sigma) could reflect deficits in perceptual and/or motor timing processes (Castellanos & Tannock, 2002; Rommelse et al., 2008), which lead to impairments in the mechanisms involved in response preparation (Vaurio et al., 2009) or a difficulty learning to optimize the timing of responses (Liddle et al., 2009) during the Stop Signal task.
ACKNOWLEDGMENTS
We thank all the children, parents, and teachers that took part in this study and the CAMHS attention team for their help with recruitment. We also gratefully acknowledge Dr. Rob Edwards for his assistance with this analysis.
APPENDIX
Probability density (PD) histograms illustrating the RT distributions, which resulted in significant (figures A, B, and C) or uncalculated (figures D, E, and F) chi-squared statistics when ex-Gaussian fit was tested. The corresponding ex-Gaussian distributions for each of these distributions are displayed on each graph (solid line).
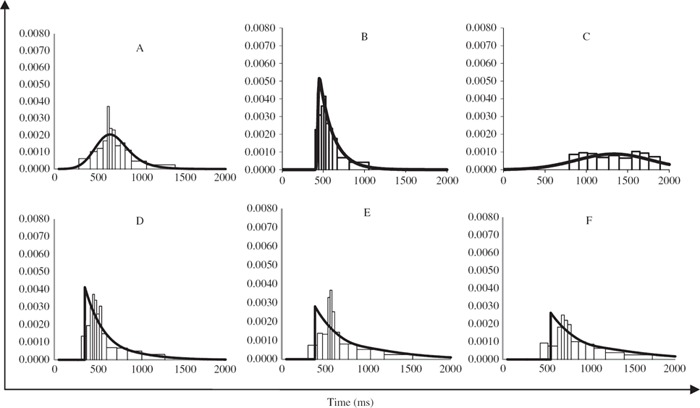
Note. Figures A, B and C are graphical illustrations of the distributions of data that did not conform exactly to the ex-Gaussian and are probably better described by another model (e.g., some are more normally distributed and some are more exponential in nature). It can be seen by inspecting these graphs that the model (line) still resembles the underlying data relatively well and thus it is reasonable to assume that these fits and corresponding ex-Gaussian parameters still provide important information regarding the shapes of these distributions. Figures D, E, and F depict the data from three children that were removed from subsequent analyses (D: μ = 356, σ = 0, τ = 242 (attention deficit hyperactivity disorder symptoms + dyslexia); E: μ = 393, σ = 0, τ = 356 (TD-control); F: μ = 555, σ = 0, τ = 380 (TD-control)). Using Quantile Maximum Probability Estimator (QMPE) sigma values were calculated to be near 0 suggesting that the ex-Gaussian model was a very poor fit to these distributions; Chi Square could not be calculated to test the fit of these distributions to the raw data. To be able to display the ex-Gaussian distributions for each of these distributions on the graphs below we have set sigma to 0.01 (solid line).
REFERENCES
- Alderson R. M., Rapport M. D., Kofler M. J. Attention-deficit/hyperactivity disorder and behavioural inhibition: A meta-analytic review of the stop-signal paradigm. Journal of Abnormal Child Psychology. 2007;35:745–758. doi: 10.1007/s10802-007-9131-6. [DOI] [PubMed] [Google Scholar]
- Alderson R. M., Rapport M. D., Sarver D. E., Kofler M. J. ADHD and behavioural inhibition: A re-examination of the stop-signal task. Journal of Abnormal Child Psychology. 2008;36:989–998. doi: 10.1007/s10802-008-9230-z. [DOI] [PubMed] [Google Scholar]
- American Psychiatric Association. Diagnostic and statistical manual of mental disorders (DSM-IV) (4th ed.) Washington, DC: American Psychiatric Association; 2000. [Google Scholar]
- Barkley R. A. Behavioural inhibition, sustained attention, and executive functions: Constructing a unifying theory of ADHD. Psychological Bulletin. 1997;121(1):65–94. doi: 10.1037/0033-2909.121.1.65. [DOI] [PubMed] [Google Scholar]
- Barkley R. A. Response inhibition in attention deficit hyperactivity disorder. Mental Retardation and Developmental Disabilities Research Reviews. 1999;5:177–184. [Google Scholar]
- Barkley R. A. Attention-deficit hyperactivity disorder: A handbook for diagnosis and treatment. 3rd ed. New York, NY: Guilford Press; 2006. [Google Scholar]
- Barkley R. A., Murphy K. R. Attention deficit hyperactivity disorder: A clinical workbook. 2nd ed. New York, NY: Guilford Press; 1998. [Google Scholar]
- Bellgrove M. A., Hester R., Garavan H. The functional neuroanatomical correlates of response variability: Evidence from a response inhibition task. Neuropsychologia. 2004;42:1910–1916. doi: 10.1016/j.neuropsychologia.2004.05.007. [DOI] [PubMed] [Google Scholar]
- Bonifacci P., Snowling M. J. Speed of information processing in children with dyslexia and children of low-IQ: A test of the modular hypothesis. Cognition. 2008;107(3):999–1017. doi: 10.1016/j.cognition.2007.12.006. [DOI] [PubMed] [Google Scholar]
- Buzy W. M., Medoff D. R., Schweitzer J. B. Intra-individual variability among children with ADHD on a working memory task: An ex-Gaussian approach. Child Neuropsychology. 2009;15(5):441–459. doi: 10.1080/09297040802646991. [DOI] [PMC free article] [PubMed] [Google Scholar]
- Castellanos F. X., Sonuga-Barke E. J. S., Scheres A., Di Martino A., Hyde C., Walters J. R. Varieties of attention-deficit/hyperactivity disorder-related intra-individual variability. Biological Psychiatry. 2005;57:1416–1423. doi: 10.1016/j.biopsych.2004.12.005. [DOI] [PMC free article] [PubMed] [Google Scholar]
- Castellanos F. X., Tannock R. Neuroscience of attention deficit/hyperactivity disorder: The search for endophenotypes. Nature Reviews Neuroscience. 2002;3:617–628. doi: 10.1038/nrn896. [DOI] [PubMed] [Google Scholar]
- D'Angostino R. B., Stephens M. A. Goodness-of-fit techniques. New York, NY: Dekker; 1986. [Google Scholar]
- Jong C. G. W., Oosterlaan J., Sergeant J. A. The role of double dissociation studies in the search for candidate endophenotypes for the comorbidity of attention deficit/hyperactivity disorder and reading disability. International Journal of Disability, Development and Education. 2006;53(2):177–193. [Google Scholar]
- Doyle A. E., Willcutt E. G., Seidman L. J., Biederman J., Chouinard V.-A., Silva J., Faraone S. V. Attentiondeficit/hyperactivity disorder endophenotypes. Biological Psychiatry. 2005;57:1324–1335. doi: 10.1016/j.biopsych.2005.03.015. [DOI] [PubMed] [Google Scholar]
- Elliott C. D., Smith P., McCulloch K. British Ability Scales II (BAS II) Windsor, England: NFER-Nelson; 1996. [Google Scholar]
- Epstein J. N., Conners C. K., Hervey A. S., Tonev S. T., Arnold L. E., Abikoff H. B., Wigal T. Assessing medication effects in the MTA study using neuropsychological outcomes. Journal of Child Psychology and Psychiatry. 2006;47(5):446–456. doi: 10.1111/j.1469-7610.2005.01469.x. [DOI] [PubMed] [Google Scholar]
- Epstein J. N., Hwang M., Antonini T., Langberg J. M., Altaye M., Arnold L. E. Examining predictors of reaction times in children with ADHD and normal controls. Journal of the International Neuropsychological Society. 2010;16(1):138–147. doi: 10.1017/S1355617709991111. [DOI] [PMC free article] [PubMed] [Google Scholar]
- Epstein J. N., Langberg J. M., Rosen P. J., Graham A., Narad M. E., Antonini T. N., Altaye M. Evidence for higher reaction time variability for children with ADHD on a range of cognitive tasks including reward and event rate manipulations. Neuropsychology. 2011;25(4):427–441. doi: 10.1037/a0022155. [DOI] [PMC free article] [PubMed] [Google Scholar]
- Geurts H. M., Grasman R. P. P. P., Verté S., Oosterlaan J., Roeyers H., van Kammen S. M., Sergeant J. A. Intra-individual variability in ADHD, autism spectrum disorders and Tourette's syndrome. Neuropsychologia. 2008;46:3030–3041. doi: 10.1016/j.neuropsychologia.2008.06.013. [DOI] [PubMed] [Google Scholar]
- Gooch D., Snowling M. J., Hulme C. Time perception, phonological skills and executive function in children with dyslexia and/or ADHD symptoms. Journal of Child Psychology and Psychiatry, and Allied Disciplines. 2011;52(2):195–203. doi: 10.1111/j.1469-7610.2010.02312.x. [DOI] [PMC free article] [PubMed] [Google Scholar]
- Goodman R. Strengths and difficulties questionnaire. 2005. Retrieved from http://www.sdqinfo.com/questionnaires/english/c1.pdf.
- Heathcote A. RTSYS: A DOS application for the analysis of reaction time data. Behaviour Research Methods, Instruments and Computers. 1996;28:427–445. [Google Scholar]
- Heathcote A., Brown S., Mewhort D. J. K. Quantile Maximum Likelihood Estimation of response time distributions. Psychonomic Bulletin and Review. 2002;9:394–401. doi: 10.3758/bf03196299. [DOI] [PubMed] [Google Scholar]
- Heathcote A., Brown S. D., Cousineau D. Estimating lognormal, Wald and Weibull RT distributions with a parameter dependent lower bound. Behaviour Research Methods, Instruments, Computers. 2004;36:277–290. doi: 10.3758/bf03195574. [DOI] [PubMed] [Google Scholar]
- Heathcote A., Popiel S.J., Mewhort D. J. K. Analysis of response time distributions: An example using the Stroop task. Psychological Bulletin. 1991;109:340–347. [Google Scholar]
- Hervey A. S., Epstein J. N., Curry J. F., Tonev S., Arnold L. E., Conners C. K., et al. Reaction time distribution analysis of neuropsychological performance in an ADHD sample. Child Neuropsychology. 2006;12:125–140. doi: 10.1080/09297040500499081. [DOI] [PubMed] [Google Scholar]
- Hockley W. E. Analysis of response time distributions in the study of cognitive processes. Journal of Experimental Psychology: Learning, Memory, and Cognition. 1984;6:598–615. [Google Scholar]
- Hulme C., Snowling M. J. Developmental disorders of language learning and cognition. Oxford, England: Wiley-Blackwell; 2009. [Google Scholar]
- Hulslander J., Talcott J., Witton C., DeFries J., Pennington B., Wadsworth S., Willcutt E., Olson R. Sensory processing, reading, IQ, and attention. Journal of Experimental Child Psychology. 2004;88:274–295. doi: 10.1016/j.jecp.2004.03.006. [DOI] [PubMed] [Google Scholar]
- Johnson K. A., Kelly S. P., Bellgrove M. A., Barry E., Cox M., Gill M., Robertson I. H. Response variability in attention deficit hyperactivity disorder: Evidence for neuropsychological heterogeneity. Neuropsychologia. 2007;45:630–638. doi: 10.1016/j.neuropsychologia.2006.03.034. [DOI] [PubMed] [Google Scholar]
- Kalff A. C., De Sonneville L. M. J., Hurks P. P. M., Hendriksen J. G. M., Kroes M., Feron F. J. M., Jolles J. Speed, speed variability, and accuracy of information processing in 5 to 6-year old children at risk of ADHD. Journal of the International Neuropsychological Society. 2005;11:173–183. doi: 10.1017/s1355617705050216. [DOI] [PubMed] [Google Scholar]
- Klein C., Wendling K., Huettner P., Ruder H., Peper M. Intra-subject variability in attention-deficit hyperactivity disorder. Biological Psychiatry. 2006;60:1088–1097. doi: 10.1016/j.biopsych.2006.04.003. [DOI] [PubMed] [Google Scholar]
- Kunsti J., Oosterlaan J., Stevenson J. Psychological mechanisms in hyperactivity. I. Response inhibition deficit, working memory impairment, delay aversion or something else? Journal of Child Psychology and Psychiatry. 2001;42(2):199–210. [PubMed] [Google Scholar]
- Leth-Steensen C., King Elbaz Z., Douglas V. I. Mean response time, variability, and skew in the responding of ADHD children: A response time distributional approach. Acta Psychologica. 2000;104:167–190. doi: 10.1016/s0001-6918(00)00019-6. [DOI] [PubMed] [Google Scholar]
- Liddle E. B., Scerif G., Hollis C. P., Batty M. J., Groom M. J., Liotti M., Liddle P. F. Looking before you leap: A theory of motivated control of action. Cognition. 2009;112(1):141–158. doi: 10.1016/j.cognition.2009.03.006. [DOI] [PMC free article] [PubMed] [Google Scholar]
- Lijffijt M., Kenemans J. L., Verbaten M. N., Engeland H. A meta-analytic review of stopping performance in attention-deficit/hyperactivity disorder: Deficient inhibitory motor control? Journal of Abnormal Psychology. 2005;114(2):216–222. doi: 10.1037/0021-843X.114.2.216. [DOI] [PubMed] [Google Scholar]
- Logan G. D. On the ability to inhibit thought and action: A user's guide to the stop signal paradigm. In: Dagenbach D., Carr T. H., editors. Inhibitory processes in attention, memory, and language. San Diego, CA: Academic; 1994. pp. 189–239. [Google Scholar]
- Logan G. D., Schachar R. J., Tannock R. Impulsivity and inhibition. Psychological Science. 1997;8:60–64. [Google Scholar]
- Luce R. D. Response times: Their role in inferring elementary mental organization. New York, NY: Oxford University Press; 1986. [Google Scholar]
- Matzke D., Wagenmaker E. J. Psychological interpretation of the ex-Gaussian and shifter Wald parameters: A diffusion model analysis. Psychonomic Bulletin & Review. 2009;16(5):798–817. doi: 10.3758/PBR.16.5.798. [DOI] [PubMed] [Google Scholar]
- McGarry T., Franks I. M. A horse race between independent processes: Evidence for a phantom point of no return in the preparation of a speeded motor response. Journal of Experimental Psychology: Human Perception and Performance. 1997;23:1533–1542. doi: 10.1037//0096-1523.23.5.1533. [DOI] [PubMed] [Google Scholar]
- McGrath L.M., Pennington B. F., Shanahan M. A., Santerre-Lemmon L. E., Barnard H. D., Willcutt E. G. A multiple deficit model of reading disability and attention-deficit/hyperactivity disorder: Searching for shared cognitive deficits. Journal of Child Psychology and Psychiatry. 2011;52(5):547–557. doi: 10.1111/j.1469-7610.2010.02346.x. [DOI] [PMC free article] [PubMed] [Google Scholar]
- Mewhort D. J., Braun J. G., Heathcote A. Response time distributions and the Stroop Task: A test of the Cohen, Dunbar, and McClelland (1990) model. Journal of Experimental Psychology: Human Perception and Performance. 1992;18(3):872–882. doi: 10.1037//0096-1523.18.3.872. [DOI] [PubMed] [Google Scholar]
- Oosterlaan J., Logan G. D., Sergeant J. A. Response inhibition in AD/HD, CD, comorbid AD/HD+CD, anxious, and control children: A meta-analysis of studies with the Stop Task. The Journal of Child Psychology and Psychiatry and Allied Disciplines. 1998;39:411–425. [PubMed] [Google Scholar]
- Oosterlaan J., Sergeant J. A. Inhibition in ADHD, aggressive, and anxious children: A biologically based model of child psychopathology. Journal of Abnormal Child Psychology. 1996;24(1):19–36. doi: 10.1007/BF01448371. [DOI] [PubMed] [Google Scholar]
- Quay H. C. Inhibition and attention deficit hyperactivity disorder. Journal of Abnormal Child Psychology. 1997;25(1):7–13. doi: 10.1023/a:1025799122529. [DOI] [PubMed] [Google Scholar]
- Rapport M. D., Chung K., Shore G., Isaacs P. A conceptual model of child psychopathology: Implications for understanding attention deficit hyperactivity disorder and treatment efficacy. Journal of Clinical Child Psychology. 2001;30:48–58. doi: 10.1207/S15374424JCCP3001_6. [DOI] [PubMed] [Google Scholar]
- Ratcliff R. Group reaction time distributions and an analysis of distribution statistics. Psychological Bulletin. 1979;86(3):446–461. [PubMed] [Google Scholar]
- Ratcliff R., Murdock B. B. Retrieval processes in recognition memory. Psychological Review. 1976;83:190–214. [Google Scholar]
- Rommelse N. N., Altink M. E., Oosterlaan J., Beem L., Buitelaar J., Sergeant J. A. Speed, variability, and timing of motor output in ADHD: Which measures are useful for endophenotypic research? Behavioural Genetics. 2008;38:121–132. doi: 10.1007/s10519-007-9186-8. [DOI] [PMC free article] [PubMed] [Google Scholar]
- Rubia K., Taylor E., Smith A. B., Oksannen H., Overmeyer S., Newman S. Neuropsychological analyses of impulsiveness in childhood hyperactivity. British Journal of Psychiatry. 2001;179:138–143. doi: 10.1192/bjp.179.2.138. [DOI] [PubMed] [Google Scholar]
- Rucklidge J. J., Tannock R. Neuropsychological profiles of adolescents with ADHD: Effects of reading difficulties and gender. Journal of Child Psychology and Psychiatry. 2002;43(8):988–1003. doi: 10.1111/1469-7610.00227. [DOI] [PubMed] [Google Scholar]
- Schachar R., Mota V. L., Logan G. D., Tannock R., Klim P. Confirmation of an inhibitory control deficit in attention-deficit/hyperactivity disorder. Journal of Abnormal Child Psychology. 2000;28(3):227–235. doi: 10.1023/a:1005140103162. [DOI] [PubMed] [Google Scholar]
- Sergeant J. A., Oosterlaan J., Van der Meere J. J. Information processing and energetic factors in attention deficit hyperactivity disorder. In: Quay H. C., Hogan A. E., editors. Handbook of disruptive behaviour disorders. New York, NY: Cambridge University Press; 1999. pp. 75–104. [Google Scholar]
- Shanahan M. A., Pennington B. F., Yerys B. E., Scott A., Boada R., Willcutt E. G., DeFries J. C. Processing speed deficits in attention deficit/hyperactivity disorder and reading disability. Journal of Abnormal Child Psychology. 2006;34:585–602. doi: 10.1007/s10802-006-9037-8. [DOI] [PubMed] [Google Scholar]
- Snowling M. J. Changing concepts of dyslexia: Nature, treatment and co-morbidity. Journal Child Psychology and Psychiatry, Virtual Issue. 2009. Retrieved from http://www.wiley.com/bw/vi.asp?ref=0021-9630&site=0021#0436. [DOI] [PubMed]
- Sonuga-Barke E. J., Bitsakou P., Thompson M. Beyond the dual pathway model: Evidence for the dissociation of timing, inhibitory, and delay-related impairments in attention-deficit/hyperactivity disorder. Journal of the American Academy of Child and Adolescent Psychiatry. 2010;49(4):345–355. doi: 10.1016/j.jaac.2009.12.018. [DOI] [PubMed] [Google Scholar]
- Toplak M. E., Dockstader C., Tannock R. Temporal information processing in ADHD: Findings to date and new methods. Journal of Neuroscience Methods. 2006;151:15–29. doi: 10.1016/j.jneumeth.2005.09.018. [DOI] [PubMed] [Google Scholar]
- Ulrich R., Miller J. Effects of truncation on reaction time analysis. Journal of Experimental Psychology: General. 1994;123:34–80. doi: 10.1037//0096-3445.123.1.34. [DOI] [PubMed] [Google Scholar]
- Van Meel C. S., Oosterlaan J., Heslenfeld D. J., Sergeant J. A. Motivational effects on motor timing in attention-deficit/hyperactivity disorder. Journal of American Academy of Child and Adolescent Psychiatry. 2005;44(5):451–460. doi: 10.1097/01.chi.0000155326.22394.e6. [DOI] [PubMed] [Google Scholar]
- Van Zandt T. How to fit a response time distribution. Psychonomic Bulletin and Review. 2000;7(3):424–465. doi: 10.3758/bf03214357. [DOI] [PubMed] [Google Scholar]
- Vaurio R. G., Simmonds D. J., Mostofsky S. H. Increased intra-individual reaction time variability in attention-deficit/hyperactivity disorder across response inhibition tasks with different cognitive demands. Neuropsychologia. 2009;47(17):2389–2396. doi: 10.1016/j.neuropsychologia.2009.01.022. [DOI] [PMC free article] [PubMed] [Google Scholar]
- Vellutino F. R., Fletcher J. M., Snowling M. J., Scanlon D. M. Specific reading disability (dyslexia): What have we learned in the past four decades? Journal of Child Psychology and Psychiatry. 2004;45(1):2–40. doi: 10.1046/j.0021-9630.2003.00305.x. [DOI] [PubMed] [Google Scholar]
- Willcutt E. G., Doyle A. E., Nigg J. T., Faraone S. V., Pennington B. F. Validity of the executive function theory of attention deficit/hyperactivity disorder: A meta-analytic review. Biological Psychiatry. 2005b;57:1336–1346. doi: 10.1016/j.biopsych.2005.02.006. [DOI] [PubMed] [Google Scholar]
- Willcutt E. G., Pennington B. F., Olson R. K., Chhabildas N., Hulslander J. Neuropsychological analyses of comorbidity between reading disability and attention deficit hyperactivity disorder: in search of a common deficit. Developmental Neuropsychology. 2005a;27(1):35–78. doi: 10.1207/s15326942dn2701_3. [DOI] [PubMed] [Google Scholar]
- Williams B. R., Strauss E. H., Hultsch D. F., Hunter M. A., Tannock R. Reaction time performance in adolescence with attention deficit/hyperactivity disorder (ADHD): Evidence of inconsistency in the fast and slow portions of the RT distribution. Journal of Clinical and Experimental Neuropsychology. 2007;29:277–289. doi: 10.1080/13803390600678020. [DOI] [PubMed] [Google Scholar]