Abstract
Protein–protein interactions identified through high-throughput proteomics efforts continue to advance our understanding of the protein interactome. In addition to highly specific protein–protein interactions, it is becoming increasingly more common for yeast two-hybrid, pull-down assays, and other proteomics techniques to identify multiple protein ligands that bind to the same target protein. A resulting challenge is to accurately characterize the assembly of these multiprotein complexes and the competition among multiple protein ligands for a given target. The Association of Biomolecular Resource Facilities–Molecular Interactions Research Group recently conducted a benchmark study to assess participants' ability to correctly describe the interactions between two protein ligands and their target protein using primarily biosensor technologies, such as surface plasmon resonance. Participants were provided with microgram quantities of three proteins (A, B, and C) and asked to determine if a ternary A-B-C complex can form or if protein-B and protein-C bind competitively to protein-A. This article will summarize the experimental approaches taken by participants to characterize the molecular interactions, the interpretation of the data, and the results obtained using different biosensor instruments.
Keywords: biosensor, surface plasmon resonance, biolayer interferometry, mass spectrometry, protein, proteomics, ternary complex, barnase, barstar, bivalent barnase variants, competition, epitope mapping
INTRODUCTION
Mapping of the human protein interactome is critically important to advance our understanding of biology and disease. High-throughput protein interaction technologies, such as yeast two hybrid system, coimmunoprecipitation, mass spectrometry (MS), and protein microarrays, continually identify novel protein–protein interactions and facilitate the mapping of vast protein interaction networks.1,2 Whereas some interactions are between a given protein target and only one specific protein ligand, other proteins have many different binding partners. In these instances, it is important to characterize not only the binding kinetics and affinity of each individual interaction but also whether the different ligands compete for overlapping binding sites on the target protein or if they have distinct epitopes and can assemble together into a multiprotein complex.
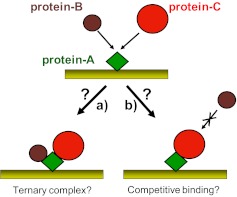
To this end, The Association of Biomolecular Resource Facilities (ABRF)–Molecular Interactions Research Group (MIRG; see ABRF website at www.abrf.org and MIRG website at www.abrf.org/MIRG.) recently conducted a biosensor-focused benchmark study to assess the capability of different volunteer research laboratories to correctly describe the interactions in a three-component protein system involving two protein ligands and a common target protein. Participants were provided with microgram quantities of three proteins of unknown identity: “protein-A, protein-B and protein-C”, and were asked to determine if a ternary A-B-C complex can form or if protein-B and protein-C bind competitively to protein-A (Fig. 1).
FIGURE 1.
Schematic representation of the MIRG Benchmark Study objective. Participants were instructed to immobilize protein-A on a sensor surface and asked to determine if (a) protein-B and protein-C could bind simultaneously to protein-A to form a ternary complex or if (b) protein-B and protein-C bind competitively to protein-A, such that the binding of one protein would prevent the binding of the other.
The protein system used in the benchmark study included the Bacillus amyloliquefaciens extracellular ribonuclease barnase (protein-B) and its intracellular inhibitor barstar (protein-A). Barnase is a single polypeptide chain of 110 residues, with a molecular weight of 12,383, and barstar is also a single polypeptide chain, consisting of 90 residues, with a molecular weight of 10,343. Neither protein contains any disulfide bonds, and the association between the two proteins is extremely tight; the dissociation constant for the reaction has been estimated to be ∼6 × 10–14 M. Hence, the complex is specific and discrete. Barstar activity is completely inhibited in the complex, so its formation has been assessed frequently, simply by measuring the extent of enzyme inhibition.
The interactions between WT barnase and barstar and a host of variants, characterized by structural, thermodynamic, and kinetic methods, have provided considerable insight into the nature of protein association and recognition. Pioneering studies have identified amino acid replacements in barnase and barstar that alter the affinity of this association with experimentally observed binding constants from as weak as Kd = 10−4 M to an approximate Kd = 10−14 M.3,4 Additionally, bivalent barnase proteins can be constructed to form multivalent complexes.5 In this study, several bivalent barnase variants, termed “BiNases”, have been constructed, which consist of two mutant barnase proteins connected by a linker. One of these BiNase proteins, which is identified herein as BiNase2 (protein-C), was selected for use in the MIRG Benchmark Study, as the barstar affinities of the low-affinity domain (10−5 M) and high-affinity domain (10−9 M) were such that only barstar binding to the high-affinity domain would be detectable at the concentrations at which the study participants were instructed to work (10−7–10−10 M). Consequently, a competition between barnase and BiNase2 binding to barstar could be assessed in this concentration range, and the two ligands were distinguishable from each other in biosensor experiments based on mass, with BiNase2 (26 kDa) larger than barnase (12 kDa). As barnase and BiNase2 bind to the same site on barstar, the binding of either protein will prevent binding of the other, so the expected result is competitive binding to barstar, with no formation of a ternary barnase/barstar/BiNase2 complex.
Here, we provide a summary of the participant data reported from the MIRG Benchmark Study, including an overview of the most common experimental approaches taken to characterize the molecular interactions, the participants' interpretation of the data, and the conclusions made regarding competitive binding or formation of a ternary complex. The results from the study provide a benchmark for comparing the capabilities of different laboratories to correctly characterize the interactions in a multicomponent system and provide an example of the many different experimental designs that can be used using biosensor technologies to study such interactions.
MATERIALS AND METHODS
Expression Constructs
Expression plasmids pMT1002, containing the WT barnase fused to the phoA signal peptide and barstar, under control of the Pr promoter of Escherichia coli λ phage, pMT590 containing the R59A,H102Q double mutant of barnase and barstar under control of the tac promoter, and pMT643 containing the barstar C40A,C82A double mutant under control of the tac promoter, were generously provided by Dr. Robert Hartley of the U.S. National Instititues of Health (Bethesda, MD, USA).6,7
Single amino acid substitutions in barnase were constructed from the R59A,H102Q double mutant in pMT590 using the QuickChange site-directed mutagenesis kit (Stratagene, La Jolla, CA, USA). The H102Q single mutant was generated from pMT590 by reverting A59 to the WT R residue using two 51 nt oligonucleotides: N-A59R-C (5′ GGAGACATCTTCTCAAACAGGGAAGGCAAGCTTCCGGGCAAAAGCGGACGA 3′) and N A59R IC (5′ TCGTCCGCTTTTGCCCGGAAGCTTGCCTTCCCTGTTTGAGAAGATGTCTCC 3′) and screened by the generation of a unique HindIII in pMT590. Similarly, a R59A single mutant was generated by reverting Q102 to the WT H residue using two 49 nt oligonucleotides: N-Q102H-C (5′ GATTTACAAAACAACGGACCATTATCAAACGTTTACAAAAATCAGATAA 3′) and N Q102H IC (5′ TTATCTGATTTTTGTAAACGTTTGATAATGGTCCGTTGTTTTGTAAATC 3′), which introduced an AclI site into pMT590.
A tobacco etch virus (TEV)-cleavable, histidine-tagged variant of barstar C40A,C82A was cloned into pET-22b in two steps using PCR. First, the barstar gene was amplified with two 36 nt primers: H TEV Barstar N C (5′ CATCACAGCGAGAACCTGTACTTCCAGGGTAAAAAAGCAGTCATTAACGGG 3′) and Barstar Cterm Hind-IC (5′ CTCCCATTGATAAGCTTAAGAAAGTATGATGGTGAT 3′), and the amplicon was used in a second PCR reaction using a 51-nt primer, Nde His6 TEV N C (5′ GGGGTATATCATATGGGCAGCCATCATCATCATCATCACAGCGAGAACCTG 3′). The final amplified product was purifed, digested with NcoI and HindIII, and ligated into similarly digested pET-22b.
The BiNase variants were cloned in pET-22b by construction from two steps using overlap extension PCR. The first set of amplification reactions consisted of generating suitable coding sequences for the N- and C-terminal monovalent proteins. The coding sequence corresponding to the N-terminal barnase derivative of the bivalent protein was amplified in two steps: first, with the 42-nt primer TEV Barnase Nterm C (5′ AGCGAGAACCTGTACTTCCAGGGTGCACAGGTTATCAACACG 3′) and the 36-nt primer BiNase Q104-R110-Bam-IC (5′ GCCGGGCCCGGATCCTCTGATTTTTGTAAAGGTCTG 3′), and then the product was amplified with the 51-nt oligonucleotide Nde His6 TEV N C (5′ GGGGTATATCATATGGGCAGCCATCATCATCATCATCACAGCGAGAACCTG 3′) and BiNase Q104-R110-Bam-IC. The coding sequence corresponding to the C-terminal barnase derivative of BiNase was amplified with a 36-nt oligonucleotide, BiNase Bam-N5 A11 C (5′ GGGGCGGCGGGATCCAACACGTTTGACGGGGTTGCG 3′), and a 37-nt primer, BiNase Q104 R110 HindIII IC (5′ GCCGGGCCCAAGCTTATCTGATTTTTGTAAAGGTCTG 3′). The PCR products of these two steps were mixed and amplified with Nde His6 TEV N C and BiNase Q104 R110 HindIII IC, cut with NdeI and HindIII, and cloned into similarly digested pET 22b.
Several approaches were evaluated for the expression of BiNase. Production of extracellular BiNase proteins was low; SDS-PAGE analysis showed that considerable unprocessed PhoA signal sequence-fused protein was present in the intracellular fraction, relative to that of secreted protein. Conversely, when BiNase proteins were expressed intracellularly from the tac or T7 promoter, along with the ribonuclease inhibitor barstar, strong binding complexes consisting of the BiNase and barstar copurified. Interestingly, when TEV protease-cleavable histidine-tagged BiNase variants were expressed alone from the T7 promoter without the coexpression of barstar, reasonable yields of protein were obtained, as long as expression was induced at late log phase of cell growth.
Purification of Barnase, Barstar, and BiNase
Growth and induction of barnase and barstar variants expressed from the tac promoter in pMT590 or pMT643 were achieved at 37°C in rich (LB) medium supplemented with ampicillin (100 μg/ml) until mid-log phase, whereupon IPTG was added to 1 mM and growth continued for 4–12 h.
Purification of native barnase and barnase variants was achieved by acidifying the chilled culture (cells and medium) by adding acetic acid to a final concentration of 5%, separating the cells and debris by centrifugation, neutralizing the supernatant to pH 7.0 with ammonium hydroxide, and then precipitating barnase at 80% ammonium sulfate by the addition of 560 g ammonium sulfate/l extract at room temperature. The pellet was resuspended and dialyzed against 20 mM ammonium acetate, pH 5.0, and subjected to cation exchange chromatography (S Sepharose) with 0.4 M NaCl gradient elution. Barnase fractions were concentrated and subjected to size exclusion chromatography on Superdex 75 in 50 mM ammonium acetate, pH 8.0, containing 0.1 M NaCl. This procedure yielded ∼250 mg purified barnase/l culture.
Purification of native barstar and several amino acid replacements from E. coli was achieved by lysing cells using a lysozyme/freeze-thaw treatment, adjusting the cell extract to pH 8.0 with ammonium hydroxide, and enriching barstar with a 40–80% ammonium sulfate cut. Precipitated protein was resuspended, dialyzed against 20 mM ammonium acetate, pH 8.0, and subjected to chromatography using Q Sepharose with 0.2 M NaCl gradient elution. Fractions enriched for barstar were pooled, concentrated, and subjected to size-exclusion chromatography on Superdex 75 in 50 mM ammonium acetate, pH 8.0, containing 0.1 M NaCl. This procedure yielded ∼250 mg purified barstar/l culture.
His-tagged variants of barnase, barstar, and BiNase were grown at 20–25°C rich (LB) medium supplemented with ampicillin (100 μg/ml) until mid-log phase, whereupon IPTG was added to 1 mM, and growth continued for 4–12 h. Harvested cells were resuspended in 50 mM sodium phosphate, pH 8.0, containing 0.3 M NaCl and 10 mM imidazole and lysed by sonication at 4°C, and supernatants were subjected to immobilized metal ion affinity chromatography, washed with buffer containing 25 mM imidazole, and eluted with a 0.3-M imidazole gradient. For experiments where removal of the histidine tag was desirable, histidine-tag cleavage was accomplished by dialyzing purified protein against 20 mM TrisCl, pH 8.0, containing 0.1 mM EDTA and 0.1 mM DTT and subjecting to cleavage with 1:20 (wt:wt) TEV protease. The final product was separated from uncleaved polypeptide and the His-tag sequence by subtractive immobilized-metal affinity chromatography and subjected to size-exclusion chromatography on Superdex 75 in 50 mM ammonium acetate, pH 8.0, 0.1 M NaCl. Yield of proteins from the His-tagged approach were 200–300 mg/l culture. Purified proteins were filter-sterilized and stored at 4°C in 50 mM ammonium acetate, pH 8.0, 0.1 M NaCl, 0.1 mM EDTA, and 0.01% sodium azide.
Tagged, untagged, and TEV-cleaved variants, as well as WT and mutant variants of the barnase, barstar, and BiNase proteins were produced and characterized in detail in internal MIRG laboratories, and his-tagged barstar C40A,C82A (protein-A), WT nontagged barnase (protein-B), and BiNase2 (protein-C), which consist of barnase H102Q at the N-terminus and barnase R59A,H102Q at the C-terminus, were selected for use in the benchmark study. Prior to conducting the study, the identity of each protein was confirmed by MALDI MS, and purity (>95%) was confirmed by SDS-PAGE.
Surface plasmon resonance (SPR) Confirmation of Binding Activities
To confirm that the purified proteins had the anticipated binding activity and competition behavior, SPR experiments were performed in a MIRG laboratory using a Biacore T100 instrument (GE Healthcare, Waukesha, WI, USA). A CM5 sensor chip was first conditioned using two 12-s injections each of 10 mM NaOH, 10 mM HCl, 0.1% SDS, and 10 mM glycine, pH 2.0. Barstar (4 μg/ml in sodium acetate, pH 5.5) was then immobilized to a density of 144 resonance units (RU) using standard 1-ethyl-3-(3-dimethylaminopropyl) carbodiimide (EDC)/N-hydroxysuccinimide (NHS) chemistry with ethanolamine blocking, and a reference surface was generated using EDC/NHS activation and ethanolamine blocking with no immobilized protein. Barstar surface activity was confirmed using multiple injections of 100 nM barnase or BiNase2, with successful regeneration accomplished using 10 mM glycine, pH 2.0, between each analyte injection. All experiments were performed in a running buffer of 10 mM sodium phosphate, pH 7.1, 130 mM sodium chloride, 0.05% Tween 20 (PBS-T), at 25°C, and a flow rate of 50 μl/min.
Competition between barnase and BiNase2 for barstar was demonstrated using the “co-inject” function in the Biacore T100 Control v2.0.2 software. These experiments involved the sequential injection of barnase, immediately followed by an equimolar mixture of barnase + BiNase2 or the reverse experiment with the sequential injection of BiNase2, immediately followed by an equimolar mixture of barnase + BiNase2. The experiment was performed at multiple concentrations of 100–0.14 nM in 3:1 dilution increments to assess possible concentration-dependent effects on the binding interactions and to help establish the experimental parameters to provide as guidance to study participants.
Lyophilization/reconstitution experiments demonstrated significant lyophilization-induced aggregation effects for the study proteins. However, binding activity and the competition result were reproducible in a second MIRG laboratory following shipment on ice, so the aliquotted proteins were shipped to study participants in liquid form.
Benchmark Study Guidance
Study participants were each provided with the material listed in Table 1, as well as the following experimental guidance.
TABLE 1.
Material Provided to Study Participants
| Protein name | MW (kDa) | Volume provided (μl) | Protein concentration (mg/ml) | Protein quantity provided (μg) | Buffer |
|---|---|---|---|---|---|
| Protein-A | 12 | 100 | 1.0 | 100 | 50 mM Ammonium-acetate, pH 8.0, 100 mM NaCl |
| Protein-B | 12 | 100 | 1.0 | 100 | 50 mM Ammonium-acetate, pH 8.0, 100 mM NaCl |
| Protein-C | 26 | 200 | 0.5 | 100 | 50 mM Ammonium-acetate, pH 8.0, 100 mM NaCl |
Background
It is known that these proteins interact in a biologically relevant way. If an immunoprecipitation of molecule A was done, the mixture of components would show evidence of the presence of B and C proteins but not necessarily in equimolar amounts.
Goal
With protein molecule A immobilized to the biosensor surface, one must determine whether a ternary complex can form with molecules A, B, and C. If evidence of the ternary complex is obtained, one must determine if cooperativity/allosteric interaction occurs between binding of molecules B and C. Determination of kinetic or equilibrium affinity constants is not required.
Experimental guidance
Experimental conditions are quite forgiving. The following should work well.
Experimental temperature = 25°C.
Running buffer of neutral pH (7.0–7.5) and 100–200 mM NaCl.
Immobilize molecule “A” using standard EDC/NHS chemistry (recommended buffer for immobilization is acetate pH 5.5).
Regeneration of molecule A surface can be accomplished using 10 mM glycine, pH 2.0.
The relevant affinities of these interactions are tighter binding than Kd = 10 nM, so the concentrations used to characterize binding should be in the submicromolar range. Association and dissociation phases can be monitored in a straightforward manner (i.e., the dissociation half-lives are longer than 1 min), although the association rate is quite fast.
Detailed kinetic characterization (Ka, Kd rate constants) of the individual interactions is not an explicit goal for the study but may make it easier to understand and quantify how the three components interact (or not).
Proteins are shipped on blue ice and can be stored on ice or in the refrigerator.
Study participants were asked to submit a completed results form containing information on experimental parameters, experimental data, and interpretation, as well as provide additional figures or raw data files to support their conclusions. Selected participant figures are reproduced herein, some of which have minor modifications, intended only to aid in the clarity of presentation.
RESULTS
MIRG Assessment of Protein-A, -B, and -C Interactions
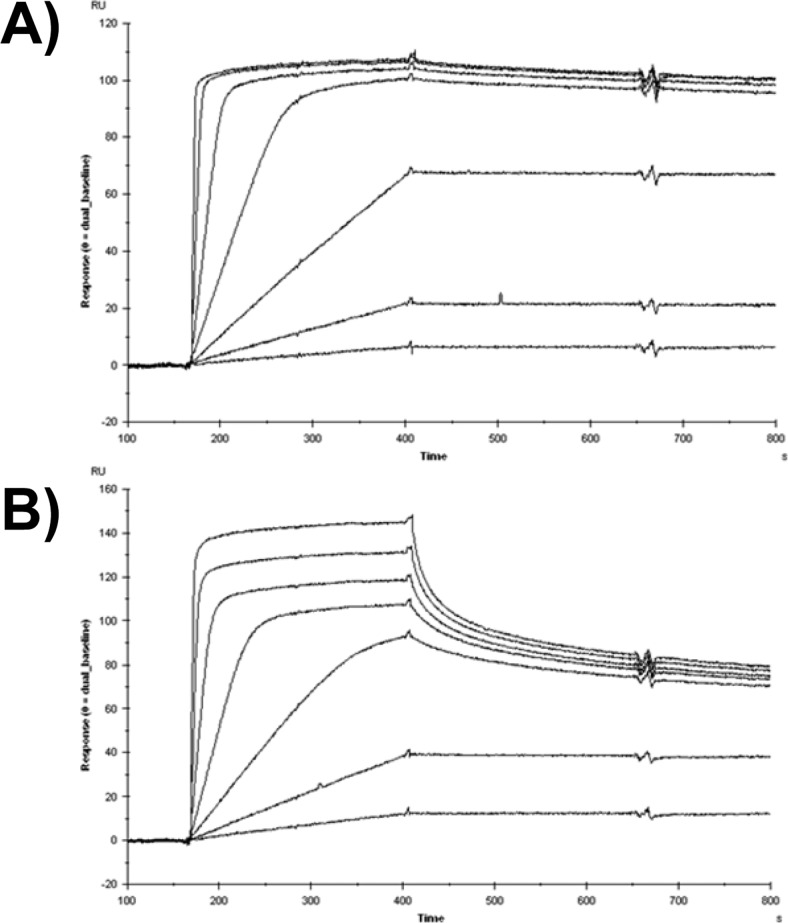
SPR sensorgram data recorded by the MIRG for the binding of barnase or BiNase2 to a barstar surface is shown in Fig. 2. Interaction of the monovalent barnase with monovalent barstar can be described by a simple 1:1 Langmuir model, although accurate kinetic values cannot be determined under these conditions as a result of mass transport limitation related to the exceptionally fast association rate (Fig. 2A). BiNase2 binding is more complex and is interpreted as a bivalent binding mode dominating at lower analyte concentrations (each BiNase2 domain engaging a barstar protein on the surface), with an increased proportion of monovalent binding at higher analyte concentrations (only the higher-affinity domain is bound to the barstar surface). The bivalent interaction blocks two barstar molecules with each BiNase2 molecule and has a slower dissociation rate than the monovalent interaction as a result of avidity, whereas monovalent binding enables more BiNase2 molecules to occupy the surface, resulting in a larger RU signal and a faster dissociation rate (Fig. 2B).
FIGURE 2.
SPR sensorgram data for the binding of (A) barnase “protein-B” (100, 33.3, 11.1, 3.7, 1.2, 0.4, 0.14 nM) or (B) BiNase2 “protein-C” (100, 33.3, 11.1, 3.7, 1.2, 0.4, 0.14 nM) to 144 RU barstar “protein-A” at 25°C.
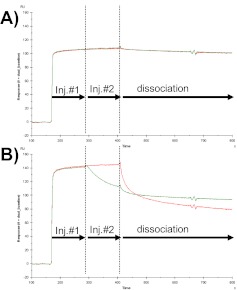
SPR competition experiments were next used to demonstrate that barnase and BiNase2 bind competitively to barstar. The experimental format used, termed “tandem blocking”,8 involved the sequential injection of barnase, immediately followed by a coinjection of an equimolar mixture of barnase + BiNase2, or the reverse experiment with the injection of BiNase2, immediately followed by an equimolar mixture of barnase + BiNase2 (Fig. 3). At high analyte concentrations (e.g., 100 nM), barnase saturates the barstar surface and remains bound during the dissociation phase as a result of the very slow dissociation rate constant, which prevents any BiNase2 molecules from binding during the second injection. Consequently, the sensorgram data for the “barnase followed by barnase + BiNase2” experiment appear identical to the binding of barnase in the absence of BiNase2 (Fig, 3A). In the reverse experiment involving the injection of BiNase2 followed by barnase + BiNase2, the more rapid dissociation of BiNase2 during the coinjection phase (Inj #2) exposes some barstar molecules that are rapidly bound by the smaller barnase protein, resulting in a decrease in mass and reduction in RU signal during the coinjection phase compared with the binding of BiNase2 alone (Fig. 3B). The dissociation for the mixed population of barnase and BiNase2 is also slower than BiNase2 alone, which is expected as a result of the slower dissociation rate for barnase compared with BiNase2. These data confirm the expected result, with barnase and BiNase2 binding competitively to barstar. If the binding had been noncompetitive, then the second injection phase of each experiment would have resulted in the formation of a ternary complex, with an increase in mass on the sensor surface and increase in RU.
FIGURE 3.
SPR sensorgram data for a tandem blocking MIRG competition experiment. (A) Binding of 100 nM barnase in the absence of BiNase2 (red) or in the presence of 100 nM BiNase2 during the coinjection phase (Inj #2; green). (B) Binding of 100 nM BiNase2 in the absence of barnase (red) or in the presence of 100 nM barnase during Inj #2 (green).
Benchmark Study Participant Data
A summary of participation in the MIRG Benchmark Study is shown in Table 2. As intended by the study design, most participants used biosensor-based technologies, including SPR (11 participants) and BLI (one participant). Although these biosensor technologies differ in aspects, such as sensor surfaces and detection principles, the experimental designs are generally similar between technologies, and therefore, the SPR and BLI data will be described collectively below. In addition, two participant groups used MS techniques, as will be described separately below.
TABLE 2.
Summary of Participation in MIRG Benchmark Study
| Technique |
SPR |
BLI |
MS |
|||
|---|---|---|---|---|---|---|
| Instrument | Biacore 2000/3000 | Biacore T100 | ICx Nomadics–SensiQ Pioneer | ForteBio Octet RED 384 | CovalX MALDI HM2 | ESI-MS |
| #Participants | 6 | 4 | 1 | 1 | 1 | 1 |
| Sensor chip | CM5 | CM5 | COOH1 | Super streptavidin | N/A | N/A |
| Immobilization | Amine (EDC/NHS) | Amine (EDC/NHS) | Amine (EDC/NHS) | Biotinylated protein “A” captured on super streptavidin chip | N/A | N/A |
BLI, Biolayer interferometry; ESI, electrospray ionization; N/A, not applicable. ICx Nomadics (Stillwater, OK, USA); ForteBio Octet RED 384 (Menlo Park, CA, USA).
Biosensor Results
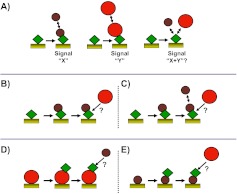
Biosensor competition experiments generally fall into three main categories—termed pre-mix, tandem blocking, and sandwich assay8 (Fig. 4). In the MIRG Benchmark Study, participants used variations of pre-mix and tandem blocking experiments as described below, whereas sandwich assays were not attempted as a result of the experimental guidelines specifying for immobilization of only barstar (protein-A) on the sensor surface. The experiments were performed on a number of different biosensor platforms, including Biacore 2000, Biacore 3000, Biacore T100, SensiQ Pioneer (ICx Nomadics), and ForteBio Octet RED 384, and under a wide range of experimental conditions, including immobilization level (80–1000 RU for SPR; 0.6–1.1 nm for Octet RED 384), flow rate (10–65 μl/min for SPR; 1200 rpm mixing speed for Octet RED 384), association time (30–180 s), and dissociation time (120–600 s; Table 3. The different platforms and experimental parameters that were used resulted in many differences in the appearance of the experimental data, the detailed interpretation of which is not the intent of this publication. Instead, the details below will focus on general qualitative discussion of the participant results and interpretations.
FIGURE 4.
Schematic representation of common biosensor competition experiments. (A) Premix, (B and C) tandem blocking, and (D and E) sandwich assay. See main text for more details.
TABLE 3.
Experimental Conditions Used by Participants Using Biosensor-Based Technologies
| Technique |
SPR |
BLI |
||
|---|---|---|---|---|
| Instrument | Biacore 2000/3000 | Biacore T100 | ICx Nomadics–SensiQ Pioneer | ForteBio Octet RED 384 |
| Immobilization level | 60–1000 RU | 100–700 RU | 250 RU | 0.60–1.1 nm |
| Analyte concentration (nM) | 80–500 | 10–200 | 100 | 304–328 |
| Association time (s) | 30–120 | 60–180 | 180 | 60 |
| Dissociation time (s) | 120–300 | 180–600 | 300–600 | 120 |
| Flow rate (μl/min) or stir speed (rpm) | 20–50 μl/min | 10–30 μl/min | 25–65 μl/min | 1200 rpm |
| Analysis software | Biaevaluation (3), Scrubber2 (2), both (1) | Biaevaluation (1), T100 evaluation (3) | Qdat (ICx Nomadics and BioLogic Software) | ForteBio Data Analysis 6.2 |
BioLogic Software (Australia).
Pre-Mix Biosensor Data
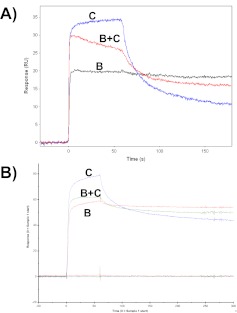
The pre-mix experiment involved measuring the binding signal for protein-B and protein-C individually and then comparing these signals to the signal generated by a mixture of protein-B plus protein-C. If protein-B and protein-C bind noncompetitively and form a ternary complex with protein-A, then the binding signal for the mixture should be the summation of the signals for the individual interactions. Example participant data using this format are shown in Fig. 5. Here, the signal for injection of the B + C mixture is not the summation of the individual protein-B plus protein-C binding signals, but rather, it is intermediate between the signals for protein-B or protein-C alone. This suggests that protein-B and protein-C cannot bind simultaneously to protein-A to form a ternary complex but are instead binding competitively to protein-A.
FIGURE 5.
Example sensorgram data from a “pre-mix” biosensor competition experiment performed by (A) Participant 20 on a Biacore 3000 instrument and (B) Participant 22 on a Biacore T100 instrument. Labels B or C within each panel identify the injections of protein-B and -C or mixtures of proteins-B and -C.
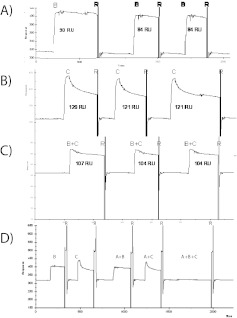
Participant 32 also performed a pre-mix experiment by first testing the binding of protein-B or protein-C alone, followed by protein-B + -C (Fig. 6A–C). As expected, the binding signal for injection of protein-B + -C was not the summation of the individual protein-B and protein-C injections, suggesting competitive binding to the barstar surface. However, Participant 32 also tested the binding of protein-B or protein-C in the presence of protein-A as an analyte in solution (Fig. 6D). At the 1:1 stoichiometric ratio used in the mixed injection, the vast majority of protein-A analyte molecules should be bound to protein-B or protein-C in solution, resulting in a significantly reduced binding response compared with protein-B or protein-C alone. However, the mixed injections of protein-B + -A or protein-C + -A generated similar binding signals to those in the absence of protein-A. Moreover, a three-component mixture of proteins-A + -B + -C in solution resulted in no detectable binding response (Fig. 6D), leading Participant 32 to conclude that a ternary complex can form in solution but not on the sensor surface. The binding observed for the protein-B + -A or protein-C + -A injections can be explained by a low fractional activity for protein-A (10–20% of the molecules were active), thus resulting in a molar excess of protein-B or protein-C in these mixed injections, which are able to bind the protein-A surface. (Knowledge of fractional activity was not necessary to obtain the correct competition result using the MIRG-suggested format with immobilized protein-A, so no information on the fractional activity of protein-A, protein-B, and protein-C was provided to participants in the “Experimental Guidance”.) This highlights an important limitation of using the target protein-A as an analyte in this variation of the pre-mix experiment, as an accurate competition conclusion relies on precise knowledge of fractional activities for each reagent. We have no explanation for the lack of detectable binding signal in the A + B + C injection, as this mixture should have a molar excess of free protein-B and protein-C analyte, which should be capable of binding to the protein-A surface.
FIGURE 6.
Example sensorgram data from a pre-mix biosensor competition experiment performed by Participant 32 using a Biacore T100 instrument. Labels A, B, or C within each panel identify the injection of protein-A, -B, or -C, respectively, whereas R indicates a regeneration step.
Tandem Blocking Biosensor Data
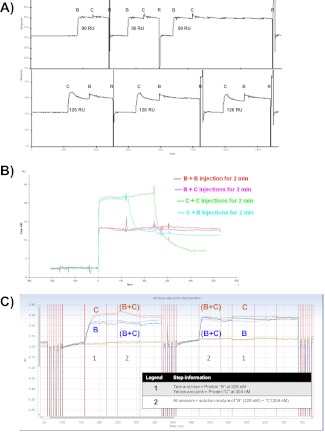
Several variations of the tandem blocking experiment were used by study participants. The simplest of these involves the binding of one analyte, followed by a short dissociation time period, and then the injection of the second analyte (Fig. 7A). In the case of protein-B followed by protein-C, this format gives a clear competition result, as the dissociation rate for protein-B is very slow, such that it remains bound to the surface during the second injection and prevents protein-C binding. However, in the reverse experiment, the more rapid protein-C dissociation exposes some protein-A molecules which can be bound by protein-B in the second injection to generate a binding response. The magnitude of this binding response depends on the extent of protein-C dissociation, which is related to the dissociation time and dissociation rate constant for protein-C.
FIGURE 7.
Example sensorgram data from tandem blocking biosensor competition experiments performed by (A) Participant 32 using a Biacore T100 instrument, (B) Participant 35 using a Biacore 3000 instrument, and (C) Participant 33 using an Octet RED 384 instrument. Labels B or C within each panel identify the injection of protein-B or protein-C, respectively, and R indicates a regeneration step.
When the dissociation time period between injections is minimized, and the protein-B injection immediately follows protein-C, a decrease in signal is observed in the second injection, as some of the rapidly dissociating protein-C molecules are replaced by protein-B molecules (Fig. 7B; “C+B injection”). These data from Participant 35 are similar to the tandem blocking experiment used by MIRG (Fig. 3), except that the replacement of protein-C with protein-B occurs more slowly in the MIRG experiment as a result of the presence of competing protein-C in the second injection, along with protein-B. Participant 33 also used a similar experimental design in a BLI experiment and obtained similar results, as shown on the left side of Fig. 7C. In addition, Participant 33 injected a protein-B + -C mixture, individually followed by protein-B or protein-C alone, and observed minimal binding response for the second injections, as the surface was saturated with analyte during the first injection (see right side of Fig. 7C). Both Participants 35 and 33 correctly concluded, based on these data, that a ternary complex did not form among proteins-A, -B, and -C.
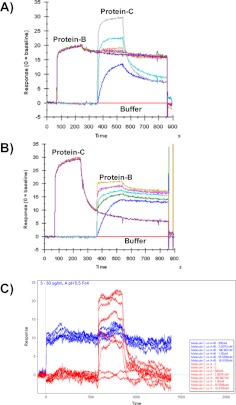
Another variation on the tandem blocking design, used by Participants 37 and 38, involves a series of tandem blocking experiments where the concentration of the first analyte is fixed, but the concentration of the second analyte in the coinjection is varied for each different cycle (Fig. 8). Here, the binding signal for the second analyte is compared with a control experiment that uses running buffer as the first injection. In this case, the binding signals in the control experiment were significantly larger than those obtained when the surface was prebound by the first analyte, leading to the conclusion that protein-B and protein-C compete for binding to protein-A. Had a ternary complex formed, the binding signals in the analyte and control experiments should have been equivalent.
FIGURE 8.
Example sensorgram data from a tandem blocking biosensor competition experiment obtained by (A and B) Participant 37 using a Biacore T100 instrument or (C) Participant 38 using a Biacore 2000 instrument. In each panel, the analyte concentration in the first injection is fixed (or is running buffer), and the analyte concentration in the second injection differs for each cycle.
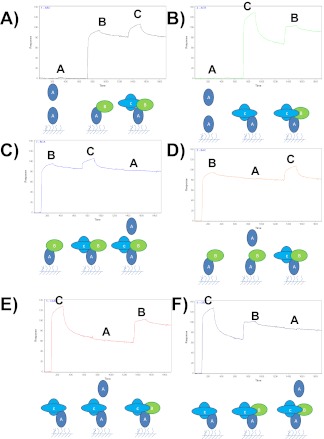
One final variation of the tandem blocking design that was used in the benchmark study involves the inclusion of protein-A as an analyte, in addition to being on the sensor surface. Participant 29 performed a very comprehensive tandem blocking analysis, using all six different combinations of sequential analyte injections, including A → B → C, A → C → B, B → A → C, B → C → A, C → A → B, and C → B → A (Fig. 9). As expected, the data show no evidence for binding of protein-A analyte to the protein-A surface (no evidence for self-association of protein-A), no evidence for binding of protein-A analyte to the protein-B/A complex (as all protein-B is already saturating the protein-A on the surface), and no evidence for binding of protein-A analyte to the protein-C/A complex (as the high-affinity protein-C site is bound to protein-A on the surface, and the low-affinity protein-C domain has too weak of affinity to bind detectable amounts of protein-A at the nanomolar concentrations tested). However, Participant 29 did observe binding signals for all experiments where protein-B was followed by protein-C, or protein-C followed protein-B in the series (Fig. 9). In addition, Participant 29 observed a protein-C binding signal in experiments where protein-B was held at constant concentration, and protein-C was injected at different concentrations, as well as the reverse experiment with protein-C constant and protein-B at different concentrations (Fig. 10A and B). Collectively, these data were interpreted as evidence for ternary complex formation with a complex mechanism as shown in Fig. 10C. We propose a simpler explanation for these results, where the additional binding signals are more likely a result of subsaturation of the protein-A surface with the earlier analyte injections in the series and/or nonspecific binding of the analytes to the sensor surface.
FIGURE 9.
Example sensorgram data from tandem blocking biosensor competition experiments performed by Participant 29 using an ICx Nomadics–SensiQ Pioneer instrument. The participant's schematic representation of the data interpretation is also provided below each sensorgram. Labels A, B, or C within each panel identify the injections of protein-A, protein-B, or protein-C, respectively.
FIGURE 10.
(A and B) Example sensorgram data from tandem blocking biosensor competition experiments obtained by Participant 29 using an ICx Nomadics–SensiQ Pioneer instrument. The injection of protein-B or protein-C is indicated by arrows in the lower portion of each panel. (C) Participant 29's schematic representation of the proposed mechanism of ternary complex formation. The participant's interpretation is described as “a mechanism where A has two binding sites. Both C and B bind both sites on A where B binds both with relatively high affinity, and C binds one site with high affinity and the other with weaker affinity”.
Mass Spectrometry Data
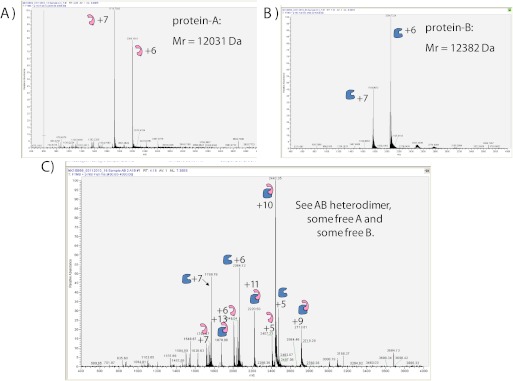
Participant 21 used ESI-MS under nondenaturing conditions to study complex formation between protein-A and either protein-B or protein-C. In addition to verifying the masses of the individual protein-A and protein-B molecules (Fig. 11A and B), this method successfully identified the 1:1 complex between protein-A and protein-B (Fig. 11C). However, protein-C generated very weak signals that were noninterpretable, and thus, complexes with protein-C, including the potential for a ternary A/B/C complex, could not be analyzed (data not shown).
FIGURE 11.
Example ESI-MS obtained by Participant 21 for (A) protein-A, (B) protein-B, or (C) a mixture of protein-A plus protein-B.
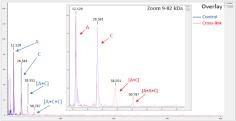
The MS approach used by Participant 31 to investigate complex formation involved allowing the various complexes to form in solution, followed by chemical cross-linking and detection of the high molecular weight complexes using MALDI-TOF MS equipped with a CovalX HM2 high-mass detector.9 Importantly, this approach necessitated the use of higher concentrations (10−6 M) compared with the biosensor-based approaches (10−7−10−10 M). Initial control experiments performed on samples of protein-A, protein-B, or protein-C alone showed the anticipated masses in each case, with no evidence for self-association of any of the proteins (Table 4). In addition, preincubation of protein-A with protein-B or protein-C showed evidence for the expected 1:1 complexes, with no higher-order oligomers, or specific interactions between protein-B and protein-C (Fig. 12A and B). The sample mixture of proteins-A, -B, and -C also showed evidence for the A:B and A:C complexes but additionally, showed the presence of a minor species with masses of 50,831–50,854 Da (Fig. 12C and D). This species was interpreted initially by Participant 31 as being a result of the formation of a ternary A:B:C complex. However, following MIRG disclosure of the identity of the proteins used in the study and the expected complexes among them, this species was attributed to the formation of the A:C:A complex with one barstar protein bound to each domain of the bivalent BiNase2 molecule. This A:C:A complex was observed in this experiment, as the higher protein concentrations that were used resulted in barstar binding to the high- and low-affinity domains of BiNase2. This interaction was not detected by any other participants as a result of the lower concentrations used in the biosensor experiments. In a follow-up study, Participant 31 also confirmed the identity of the A:C:A complex in an independent experiment by mixing protein-C with excess protein-A (Fig. 13 and Table 4).
TABLE 4.
Summary of Participant 31 MS Data for Protein-A, -B, and -C Interactions
| Cross-link | Goal | Concentrations tested (μM) | Mass observed (Da)a | Conclusion |
|---|---|---|---|---|
| A alone | Is protein-A forming an oligomer? | 5.0–0.08 | 12,128 ± 27 | No self-association observed |
| B alone | Is protein-B forming an oligomer? | 5.0–0.08 | 12,283 ± 32 | No self-association observed |
| C alone | Is protein-C forming an oligomer? | 4.7–0.075 | 26,375 ± 58 | No self-association observed |
| Mix A + B | Do protein-A and -B form a complex? If so, what is the stoichiometry? | 5.0–0.645 | 24,412 | 1:1 Complex of A:B |
| Mix A + C | Do protein-A and -C form a complex? If so, what is the stoichiometry? | 5.0–0.645 | 38,515 | 1:1 Complex of A:C |
| Mix B + C | Do protein-B and -C form a complex? If so, what is the stoichiometry? | 5.0–0.645 | 12,272, 26,378 | No interaction between B and C |
| Mix A + B + C | Do protein-A, -B, and -C form a complex? If so, what is the stoichiometry? | 5.0–0.645 | 24,404, 38,551, 50,824b | A:B, A:C, and A:B:C, A:C:A, or B:C:B complexesb |
| Mix C + excess A | Confirm presence of protein-A-C-A complex at micromolar concentration. | 2.4–2.6 | 38,551, 50,787 | 1:2 Complex of C:A, with one A bound to each domain of C |
aMasses reported in this column for mixed samples do not include those for uncomplex species.
b50,824 Da Complex, originally reported as evidence for A:B:C ternary complex; however, after MIRG disclosure of the identity of the barnase/barstar/BiNase2 proteins and the expected complexes among them, this 50,824 Da complex was attributed to the formation of an A:C:A complex with one barstar protein bound to each domain of the bivalent BiNase2.
FIGURE 12.
Example of HM2 high-mass MALDI-TOF spectra obtained by Participant 31 for mixtures of (A) protein-A plus protein-B, (B) protein-A plus protein-C, (C) protein-A plus protein-C incubated for 1 h, followed by addition of protein-B, and (D) protein-A plus protein-B incubated for 1 h, followed by addition of protein-C. In each panel, the blue spectra were obtained in the absence of chemical cross-linking, whereas the red spectra were obtained following chemical cross-linking.
FIGURE 13.
Example HM2 high-mass MALDI-TOF spectra obtained by Participant 31 for a mixture of protein-A plus protein-C. The blue spectrum was obtained in the absence of chemical cross-linking, whereas the red spectrum was obtained following chemical cross-linking.
DISCUSSION
Of the 12 biosensor participants in the benchmark study, nine participants (#20, 22, 33, 34, 35, 36, 37, 38, and 39) correctly concluded that protein-B (barnase) and protein-C (BiNase2) compete for binding to protein-A (barstar), such that the formation of a ternary complex was not possible. Each of these participants used variations of the tandem blocking or pre-mix experiments, and many used both tandem blocking and pre-mix experiments to verify their conclusions. It is noteworthy that despite all arriving at the correct competition conclusion, no two participants did the experiment in exactly the same way, as there were significant differences in experimental parameters, such as flow rate and protein concentration, as well as differences in experimental design, such as including or not including competing molecules in the second injection of the tandem blocking format. This variability highlights the lack of a single “standard” biosensor design that can or should be applied to all experimental systems, as well as the significant flexibility that biosensor platforms offer users in terms of experimental design.
Of the three biosensor participants that did not report the correct study conclusion (Participants #25, 29, and 32), each did so based on different reasoning. Participant 29 concluded that formation of a ternary complex was possible following a very complex mechanism (Fig. 10C), which we suggest is a result of misinterpretation of the experimental data. Participant 32's conclusion that a ternary complex could form in solution but not on the sensor surface apparently resulted from incorrect assumptions on the fractional activity of the protein analytes. On the other hand, Participant 25 was unable to obtain data of suitable quality to confidently reach a conclusion.
In conclusion, the summary of the MIRG Benchmark Study data presented herein provides a useful snapshot into some of the approaches currently used by researchers to characterize protein interactions in multicomponent protein systems. The results demonstrate the flexibility of today's biosensor platforms in allowing numerous variations on common experimental designs, whereas at the same time, showing some of the potential limitations of these experiments and common mistakes in data interpretation. The participation in the study by researchers using MS-based technologies also highlights the continued emergence of these and other novel, label-free techniques as complimentary tools in the characterization of protein interactions.
ACKNOWLEDGMENTS
The authors thank Matthew Robinson, Thomas Neubert, Anthony Yeung, and James Bryson for valuable suggestions and guidance on the design and execution of the benchmark study. In addition, we thank all of the study participants for partaking in the study and timely and thorough submission of study data.
Footnotes
Certain commercial materials, instruments, and equipment are identified in this manuscript to specify the experimental procedure as completely as possible. In no case does such identification imply a recommendation or endorsement by ABRF or MIRG nor does it imply that the materials, instruments, or equipment identified are necessarily the best available for the purpose.
REFERENCES
- 1. Bonetta L. Protein–protein interactions: interactome under construction. Nature 2010;468:851–854 [DOI] [PubMed] [Google Scholar]
- 2. Figeys D. Mapping the human protein interactome. Cell Res 2008;18:716–724 [DOI] [PubMed] [Google Scholar]
- 3. Frisch C, Schreiber G, Johnson CM, Fersht AR. Thermodynamics of the interaction of barnase and barstar: changes in free energy versus changes in enthalpy on mutation. J Mol Biol 1997;267:696–706 [DOI] [PubMed] [Google Scholar]
- 4. Frisch C, Fersht AR, Schreiber G. Experimental assignment of the structure of the transition state for the association of barnase and barstar. J Mol Biol 2001;308:69–77 [DOI] [PubMed] [Google Scholar]
- 5. Deyev SM, Waibel R, Levedenko EN, Schubiger AP, Plückthun A. Design of multivalent complexes using the barnase-barstar module. Nat Biotechnol 2003;21:1486–1492 [DOI] [PubMed] [Google Scholar]
- 6. Hartley RW. Barnase and barstar: expression of its cloned inhibitor permits expression of a cloned ribonuclease. J Mol Biol 1988;202:913–915 [DOI] [PubMed] [Google Scholar]
- 7. Okorokov AL, Hartley RW, Panov KI. An improved system for ribonuclease Ba expression. Protein Expr Purif 1994;5:547–552 [DOI] [PubMed] [Google Scholar]
- 8. Abdiche YN, Malashock DS, Pinkerton A, Pons J. Exploring blocking assays using Octet, ProteOn, and Biacore biosensors. Anal Biochem 2009;386:172–180 [DOI] [PubMed] [Google Scholar]
- 9. Yanes O, Nazabal A, Wenzel R, Zenobi R, Aviles FX. Detection of noncovalent complexes in biological samples by intensity fading and high-mass detection MALDI-TOF mass spectrometry. J Proteome Res 2006;5:2711–2719 [DOI] [PubMed] [Google Scholar]


