

Abstract
Objective
Embolotherapy is a potential means to treat a variety of cancers. Our approach – gas embolotherapy – introduces the droplets upstream from the tumor and then acoustically activates them to form bubbles for occlusion – a process known as acoustic droplet vaporization (ADV). We wanted to provide the first optical documentation of ADV, lodged bubbles, or vessel occlusion in vivo.
Methods
We used the rat cremaster muscle for in vivo microscopy. Perfluorocarbon droplets were administered into the aortic arch. Ultrasound exposures in the cremaster induced vaporization. The cremaster was examined pre- and post-exposure for ADV-related effects. Two sets of experiments compared the effect of exposure in the capillaries versus the first order arteriole.
Results
Bubbles that lodge following capillary exposure are significantly larger (76μm mean length, 36μm mean diameter) than those following feeder vessel exposure (25μm mean length, 11μm mean diameter). Despite the differing sizes in bubbles, the ratio of bubble length to the hydraulic diameter of all lodged bubbles was 2.11 (±0.65; N=112), which agrees with theoretical predictions and experimental observations.
Conclusions
Our results provide the first optical evidence of targeted vessel occlusion through ADV. These findings could lay the groundwork for the advancement of gas embolotherapy.
Keywords: gas embolotherapy, cancer therapy, ultrasound, perfluorocarbon droplets, acoustic droplet vaporization
INTRODUCTION
Cancer cells have been shown to “starve” to death if their blood supply is restricted [3]. An approach that has proven effective in restricting blood supply to tissue and producing permanent damage is the use of a high density of large (40-50 μm) solid emboli [13]. Most previous cancer embolotherapy work has involved procedures that are complicated, requiring either surgical exposure of vessels near the target region or very selective catheter placement to minimize embolization of normal tissue.
A potentially better method of embolotherapy is to use site activated gas emboli, rather than solid emboli, to occlude the arteries and capillary beds. The approach to occlusion involves introducing superheated, but stable, perfluorocarbon (PFC) droplets into the arterial flow upstream from the tumor and then acoustically activating the droplets to form bubbles – a process known as acoustic droplet vaporization (ADV) [12]. This technique has the distinct advantage that the dose of PFC droplets can be delivered in a convenient location, as simple as intravenous infusion, rather than only near the tumor such as requiring arterial access, but have emboli produced locally for precise delivery to the desired treatment region. Droplets of dodecafluoropentane (DDFP, C5F12) can be encapsulated in albumin shells [12]. The droplets may freely circulate, even through capillaries, without lodging until activated by ultrasound. We expect the persistence of the DDFP bubbles to be sufficient to cause tumor necrosis.
There has been an ongoing discussion, especially in the New England Journal of Medicine, about the nature of lodged gas emboli [17, 6]. However, validation of theories has not been possible without visual evidence. ADV provides the opportunity to locally produce bubbles in vivo and we have succeeded in observing and documenting, for the first time, ADV-generated bubbles that are lodged, blood flow that is halted, bubble dislodging and subsequent resumption of flow. These findings facilitate the advancement of gas embolotherapy.
MATERIALS AND METHODS
Droplet preparation
Perfluorocarbon droplets play a key role in our novel approach to gas embolotherapy. We prepared albumin-encapsulated perfluorocarbon droplets in a manner similar to our previous publications [7, 12] by adding 250 μL liquid dodecafluoropentane to a 2-mL glass vial containing 750 μL of 4 mg/mL bovine albumin in normal saline. The final PFC volume fraction was 25%. The vial was sealed and shaken for 45s using an amalgamator. A droplet predilution, used for sizing and intravenous administration, was made by diluting 1 vial of droplets to 10 mL with normal saline.
Animal preparation
All in vivo animal procedures in this study were conducted with the approval and guidance of the University Committee on Use and Care of Animals at the University of Michigan. We used male Sprague-Dawley rats weighing between 300 and 350 g. An isoflurane/oxygen inhalant mixture ensured that anesthesia was induced and maintained. The left carotid cannulation procedure followed previously established protocols [11]. The procedure used for the cremaster muscle preparation was adapted from previous protocols for open muscle cremaster preparation for intravital microscopy studies [1,20]. The anterior aspect of the scrotum was gently shaved and loose hairs were removed. With the rat in the supine position, a longitudinal incision of skin and fascia were made in the midline over the ventral aspect of the scrotum extending from 5-8 mm above inguinal fold to the distal end of the scrotum. The cremaster sack was gently excised using forceps and the connective tissue fascia was carefully separated by blunt dissection around the cremaster sack. A surgical blade was used to make a 5 mm lateral incision at the top of the cremaster muscle taking care to avoid the larger anastomosing vessels. We then used a cautery tool to cut along the edge of the entire cremaster (7 - 9 cm in length), after which, the cremaster was splayed. The cremaster pouch was stretched out radially. Sutures (5-0 Dexon “S”, Davis-Geck, Manati, Puerto Rico, U.S.A.) were placed along the edges of the muscle at 1 cm increments, leaving 6 cm of suture at each location to aid in stretching the tissue over the viewing area. Throughout the procedure, a 10 cm × 10 cm gauze (Kendall, Mansfield, MA, U.S.A.) soaked with 38 °C saline was placed on the cremaster to prevent the tissue from dehydrating and to maintain the appropriate temperature at the tissue location. This ensured minimal compromise of the blood flow due to extraction of the cremaster muscle. Tape secured the ends of the suture at each suture location.
Figure 1 provides a schematic of the experimental setup. A ramp in an acrylic tank held the rat in the supine position. The tank had a rectangular polycarbonate “optical” window (50mm × 45mm) at the bottom. The cremaster was stretched over the window for in vivo microcopy. The tank was filled with 37 °C degassed saline to prevent bubble formation outside the tissue and placed on the platform of the Nikon inverted microscope. A copper coil inside the tank, with circulating temperature-regulated water (HTP-1500, Adroit Medical Systems, Loudon, TN), maintained the bath at 37 °C during the course of the experiment allowing the exposed tissue to remain at body temperature.
FIGURE 1.
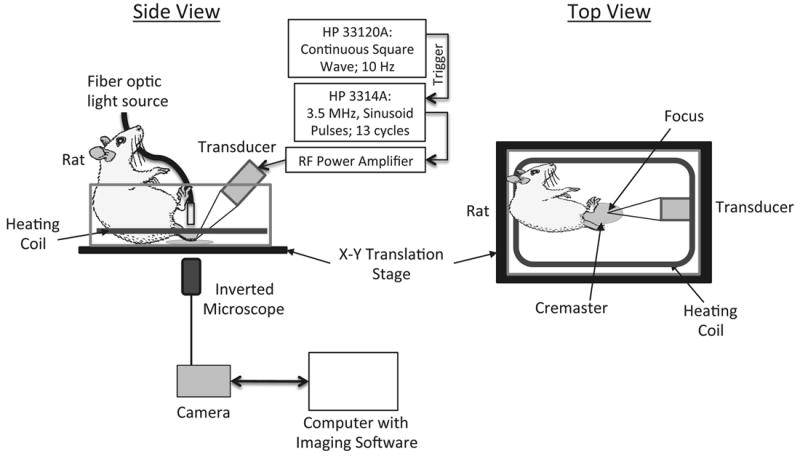
Schematic of the experimental setup.
Optics and acoustics
Intravital microscopy provided real time documentation of blood flow, bubble lodging, occlusion, bubble dislodging, and resumption of blood flow. Such documentation required the capture of video rather than still images. We employed an inverted microscope (Nikon Eclipse TE2000-S, Melville, NY) with a 10X objective (Nikon Plan Fluor 10x, Melville, NY) for optical viewing of the tissue target. A motorized stage system (ProScan II, Prior Scientific Inc., Rockland, MA) facilitated the movement of the tissue in the X and Y plane (horizontal). A 150W metal halide light source illuminated the tissue. A CCD camera (CoolSnap ES, Photometrics, Tucson, AZ) was connected to the microscope and controlled by imaging software (StreamPix v.3.4.2, NorPix, Montreal, Quebec, Canada). The maximum frame rate for the video capture was 19 frames per second (fps) with a frame resolution of 696×520 pixels.
Function Generator 1 (HP 33120A, Hewlett Packard, Palo Alto, CA) was responsible for triggering Function Generator 2 (HP 3314A, Hewlett Packard, Palo Alto, CA) at a rate of 10 Hz. The resulting sinusoidal pulses, which were applied to a 60-dB RF power amplifier (Ritec GA-2500A, Warwick, RI), contained 13 cycles (pulse duration of 3.7 μs) at a center frequency of 3.5 MHz and pulse repetition frequency of 10 Hz. The amplified signal drove a calibrated 3.5 MHz acoustic immersion single-element transducer (A381S, Panametrics, Waltham, MA). The acoustic pressures generated by the transducer were at 6 MPa peak rarefactional. This pressure exceeds the threshold previously determined for ADV [12]. The difference in the experimental setup between [12] and this study may have contributed to this disparity. We aligned the transducer in this study in such a way that it insonated the tissue at the bottom of the tank where acoustic interference from standing waves could have played a role. In contrast, the study in [12] exposed droplets flowing through a tube aligned vertically in the middle of the bulk fluid, thereby minimizing standing waves and resulting interference. The transducer used for this study was 19 mm in diameter and spherically focused at 38 mm. The lateral beam width at the focus was 2.3 mm (-6 dB Full Width Half Max). The -6dB bandwidth was 66%. Our alignment positioned the transducer’s focus at the center of the microscope’s field of view.
Experimental Design
We conducted two sets of experiments: (i) vaporization of droplets in the capillaries, and (ii) vaporization of droplets in the feeder vessel – a first order arteriole. Each set of experiments used five rats. The first experiment placed an area of the cremaster (20-30 capillaries) in the field of view with greater than 90% of the capillaries having visibly discernable flow. The operator began video capture at t=0 seconds, which continued for the duration of the experiment. Ultrasound exposure was initiated at t=30 seconds. The first 60 seconds of vide capture provided baseline images and images related to any effects due to ultrasound alone. The administration of droplets began at t=60 seconds and involved the delivery of 1mL of prediluted droplets (1×10⁸ droplets/mL) over the course of 30 seconds via the left carotid artery. The tissue remained exposed to ultrasound during the administration and till t=3 minutes 30 seconds. Following the termination of ultrasound, the region of exposure and adjacent regions on the cremaster were scanned using the microscope’s translation stage. Video capture while scanning documented these regions. Each experiment ended with the capture of a single digital still image of the entire cremaster, one image per animal.
For the second experiment, a first order arteriole, as it entered the cremaster, provided the site for insonation. Typically 1-3 first order arterioles serve as feeder vessels for the cremaster [21]. This experiment observed bubble lodging and vessel occlusion without extravasation due to capillary damage. Since the acoustics and optics were confocal, the portion of the arteriole at the center of the optical field of view was the ultrasound exposure site. The procedure for video capture, ultrasound exposure and droplet infusion remained the same as the first set of experiments. The feeder vessel stayed exposed to ultrasound during droplet administration and for 2 minutes afterwards.
We extracted frames showing lodged bubbles, obstructed flow, red blood cell (RBC) extravasation (or lack thereof), bubble dislodging, and flow resumption from the video clips for further evaluation. Figures 2a and 2b are representative images that compare the effects of vaporizing droplets in the capillaries and the feeder vessel, respectively. The images in the background of Figures 2a and 2b are that of the cremaster muscle used in the respective experiment. Scanning the tissue at 10x magnification after the exposure was completed captured the images that are inlaid. The arrows indicate the locations where the lodged bubbles were identified. Note that for capillary exposure (Fig. 2a) the tissue was optically scanned during the ultrasound and rescanned without ultrasound for locating the lodged bubbles. For feeder vessel exposure (Fig. 2b), only one spot, the area of insonation, was exposed to ultrasound. Optical scanning of the tissue for bubble identification was only performed once the ultrasound was terminated.
FIGURE 2.
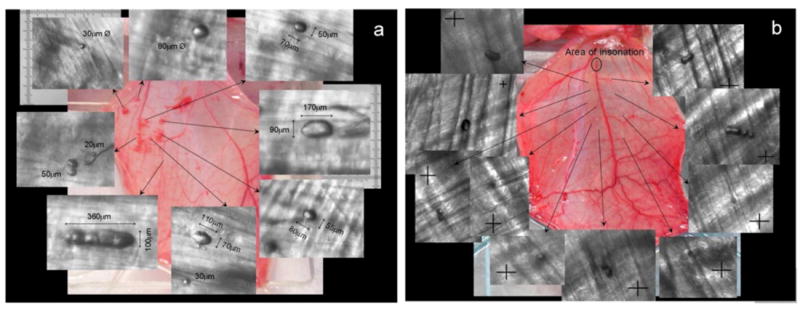
Effect of vaporizing droplets in (a) the capillaries and (b) the feeder vessel. The image in the background is that of the cremaster muscle used in the experiment. Images that are inlaid were captured at 10x magnification at the location indicated by the arrows. RBC extravasation is observed at a gross level in the cremaster following exposure in the capillaries (a) whereas no tissue damage, represented by RBC extravasation, is observed following exposure in the feeder vessel (b). The site of ultrasound exposure in (b) was a first order arteriole (~125 μm) and crosshairs are 25μm × 25μm.
We measured the dimensions of each of the lodged bubbles from images captured during the scan following the termination of ultrasound (represented by the images inlaid in Figures 2a and 2b). The “Ruler Tool” in Photoshop CS4 (Adobe Systems Inc., San Jose, CA) provided the length and diameter (assuming a circular cross-section) of each bubble.
The Mann-Whitney U test was used to establish statistical significance while comparing the dimensions of lodged bubbles from the two experiments. Mann-Whitney is a non-parametric method that makes no assumptions about the data distribution and works well even if the distribution is non-normal or contains outliers [22]. All statistical analyses (mean, standard deviation, p-value based on Mann-Whitney, dimensionless bubble length (bubble aspect ratio), etc.) were performed using scripts written in Matlab installed with the Statistics Toolbox (R2010a, MathWorks, Natick, MA, U.S.A.). Plotting and linear regression was done in Microsoft Excel (version 2011 for Mac, Microsoft Corporation, Seattle, WA, U.S.A.).
RESULTS AND DISCUSSION
Figure 3 shows the effect of vaporizing droplets in the capillaries. Figure 3a, involving ultrasound exposure before the administration of droplets, shows no apparent damage in the visualized area. The capillaries in the rat cremaster are in the 4-7μm range [21]. The droplets administered via the carotid artery had a mean diameter of 2μm (SD ± 0.1 μm; size range 1-30μm with 97.7% by count < 10μm). The white arrow in Figure 3b identifies the site of red blood cell (RBC) extravasation, which occurs due to the rupture of the capillary. These ruptures (Figs. 3b - 3d) can be attributed either to the expansion of the perfluorocarbon gas bubble or the inertial cavitation which involves a violent collapse of the gas bubble. Initial expansion of the gas bubble occurs due to consumption of DDFP and could result in a bubble up to 125 times the initial volume of the droplet [12]. Alternatively, since the ultrasound (insonifying) pressure was significantly higher than threshold values for ADV (~3 MPa) and in the range of threshold values for inertial cavitation (~6 MPa) for perfluorocarbon droplets [9, 7], the cavitation associated with the DDFP gas bubble could have caused the capillary rupture
FIGURE 3.
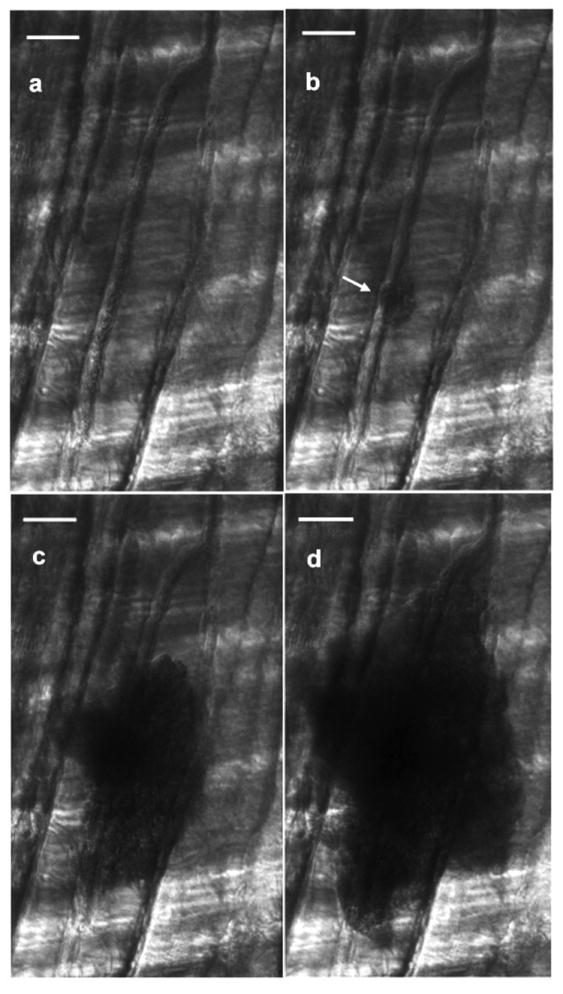
Still images (taken from real-time video) of red blood cell (RBC) extravasation as a result of vaporizing droplets in the capillaries. (a) Baseline exposure where ultrasound is on but no droplets have been administered. (b)-(d) Consecutive frames from video capture (interframe time of 53 milliseconds) after droplet administration. The white arrow in (b) identifies the site of RBC extravasation, which occurs due to the rupture of the capillary. These ruptures can be attributed to the expansion of the perfluorocarbon gas bubble and/or to the inertial cavitation as the gas bubble collapses. Scale bar in each image is 50 microns.
Capillaries are constituted only by endothelial cells surrounded by basement membrane, which makes it likely that mechanical perturbations associated with ADV will induce damage. The RBC extravasation seen in Figure 3 can also be observed at a gross level in Figure 2a. In contrast, Figure 2b does not exhibit the effects of RBC extravasation. Because the ultrasound exposure is limited to one site on a feeder vessel, the capillaries are spared the dynamics of bubble expansion and/or inertial cavitation. As a result they do not appear to be damaged sufficiently to permit RBCs to extravasate into the interstitial spaces. The site of exposure shows no damage either. The first order arteriole, which has a resting diameter of ~125μm, served as the feeder vessel for the site of ultrasound exposure in Figure 2b [16, 8]. It is composed of endothelium surrounded by one or more layers of smooth muscle cells, which may allow it to withstand the ADV-related perturbations. It could also be that the size of the vessels compared to that of the droplets is so large that changes in the droplet occur too far from the vessel walls to cause any damage.
Our experiments compared vaporization of droplets in the capillaries with that in the feeder vessel – a first order arteriole. Table 1 summarizes the results from the quantification of lodged bubbles in both cases. Bubbles lodged following vaporization in the capillaries had an average bubble length of 76μm (±23μm) and diameter of 36μm (±9μm), assuming a circular vessel cross-section. Bubbles that lodged following vaporization in the feeder vessel were 25μm in length (±8μm) and 11μm in diameter (±5μm). The difference in size of the lodged bubbles between capillary exposure and that in the feeder vessel is statistically significant (Mann-Whitney, na=59, nb=53, p<0.01, where “a” is capillary population and “b” is feeder vessel population).
TABLE 1.
Quantification of lodged bubbles
| Rat# | Number of bubbles | Configuration of Bubbles
|
Length | Hydraulic Diameter | ||
|---|---|---|---|---|---|---|
| Non-spherical (Ld ≥ 1.8) | Bubble Reversal | |||||
|
| ||||||
| Capillary | 1 | 13 | 62% | 8% | 77 (±30) | 35 (±7) |
| 2 | 9 | 100% | 0% | 73 (±22) | 39 (±12) | |
| 3 | 10 | 78% | 0% | 70 (±24) | 35 (±12) | |
| 4 | 12 | 93% | 8% | 81 (±19) | 34 (±8) | |
| 5 | 15 | 80% | 7% | 80 (±20) | 35 (±8) | |
|
| ||||||
| Overall | 59 | 83% | 5% (±4%) | *76 (±23) | **36 (±9) | |
|
| ||||||
| Feeder | 1 | 8 | 75% | 0% | 25 (±6) | 12 (±6) |
| 2 | 12 | 100% | 8% | 27 (±10) | 12 (±4) | |
| 3 | 14 | 62% | 7% | 21 (±6) | 11 (±5) | |
| 4 | 9 | 78% | 0% | 25 (±8) | 13 (±5) | |
| 5 | 10 | 100% | 0% | 25 (±9) | 9 (±6) | |
|
| ||||||
| Overall | 53 | 81% | 4% (±4%) | *25 (±8) | **11 (±5) | |
Comparison of the number, configuration, and dimensions of lodged bubbles following the capillary and feeder vessel exposure. Five rats were used for each type of exposure. Bubbles from capillary exposure are larger [L = 76mm(±23); D = 36mm(±9)] than those from feeder vessel exposure [L = 25mm(±8); D = 11mm(±5)].
The results are statistically different in comparison to corresponding values (Mann-Whitney, na=59, nb=53, p<0.01, where “a” is capillary population and “b” is feeder vessel population).
The dimensions of the lodged bubbles equate to a volume of 99,470 μm3 in the case of capillary exposure and 3,290 μm3 following feeder vessel exposure. The volumes were calculated based on an assumption that the shape of a lodged bubble in a straight vessel (sausage-shaped) resembles a cylinder with a spherical cap. The volume of the bubble, then, is the sum of the volume of a cylinder (where length = length of cylindrical portion of the bubble; radius = ½ bubble diameter) and a sphere (where radius = ½ bubble diameter). If the bubbles were spherical, these volumes would correspond to bubble diameters of 57μm and 18μm, respectively (Volume = 4/3πr3, where r is the radius of the bubble). An approximation based on the ideal gas law pV = NRT, indicates a 125x increase in volume (5x increase in diameter) when a droplet vaporizes and forms a bubble [10]. Based on these estimates, bubbles of diameters 57μm and 18μm would be produced from droplets of 11μm and 4μm, respectively.
Multiple factors could be contributing to such a difference in size of the lodged bubbles following the two exposure scenarios. One may be a filtration effect that occurs by vaporizing in the feeder vessel. Bubbles as large as the ones seen in the case of capillary exposure (57μm diameter) could also form in the feeder vessel but they would have been too large to enter into the smaller arterioles and the capillary bed. At the same time, it is reasonable that large droplets (11μm diameter) could make it into the capillaries (4-7μm) by deforming and becoming non-spherical [23]. However, they would have difficulty flowing through the capillaries at the same velocity of RBC’s under normal flow conditions. This would make them easier targets during ultrasound exposure. Additionally, larger droplets have lower surface tension; so they tend to be easier to vaporize [19]. Once vaporization occurs and bubbles are generated, the threshold for vaporization of neighboring droplets (even ones with diameter <5μm) is lowered [14]. Also, the lower flow velocity in the capillaries (0.22 mm/sec) [15] compared to the feeder vessel (33 mm/sec) [18] could provide an opportunity for the bubbles that are produced in the capillaries to coalesce and form larger ones.
The shape of the lodged bubbles is similar to the theoretical predictions by Eckmann’s group, which suggested air emboli lodge in a long sausage-shaped configuration [4]. Our measurements of the lodged bubbles show that all of them (100%) have a dimensionless bubble length (Ld) ≥1.5 and more than 80% have Ld ≥ 1.8 (Table 1). Ld corresponds to the length of the bubble divided by the hydraulic diameter (HD). We assumed a circular vessel cross-section for estimating HD. Ld=1.5 was chosen arbitrarily as the cutoff for a bubble to be considered “non-spherical.” Figure 4 is a scatter plot of the bubble length to hydraulic diameter of all the lodged bubbles that were observed, from both the capillary (closed circles) and feeder vessel exposure (open triangles). A linear trendline of the data points, which represents Ld, shows a slope of 2.11, which is in agreement with the theoretical model and experimental observations by Calderon et al. using straight channels in polydimethylsiloxane (PDMS), who proffered that gas emboli might begin to lodge where Ld ≈ 2 [5]. Although the two exposure sites produce lodged bubbles of different sizes, they all exhibit an aspect ratio, or dimensionless bubble length, of 2.
FIGURE 4.
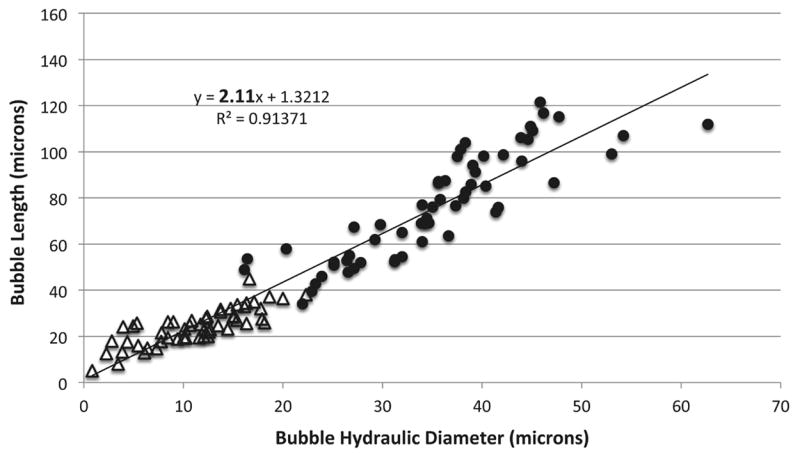
Scatter plot of bubble length to hydraulic diameter of all the lodged bubbles. Open triangles represent bubbles from feeder vessel exposure. Closed circles are bubbles following capillary exposure. A linear trendline, representing Ld, gives a slope of 2.11, which is in agreement with theoretical predictions and experimental observations.
Our in vivo visualization of the “state” of a lodged bubble at a bifurcation is consistent with that seen previously in experiments using PDMS models of straight channels and bifurcations (Fig. 5). Calderon et al. observed that there were three states of bubble lodging (Figs. 5a – 5c) at a bifurcation. The lodged state in Figure 5c compares well with that seen in the capillaries of the rat cremaster (Fig. 5d). These occurrences are also recorded in Table 1. According to Calderon et al., this observed “bifurcation state” (Figs. 5c and 5d) occurs when one of the menisci of the bubble that is splitting at a bifurcation returns, causing the entire bubble to move up just one of the daughter channels. This is referred to as bubble reversal [5]. In such instances the application of pressure causes the rear meniscus to bulge and the bubble to be lodged in one of the channels. Of note is that the bubble in the experiments of Calderon et al., once lodged in this state, could not be dislodged even by increasing pressure across the bubble by up to 55mmHg, which is significantly higher than pressure gradients found in vessels. For example, the pressure gradient along the length (10mm) of a first order arteriole in the rat cremaster is ~14mmHg [2].
FIGURE 5.
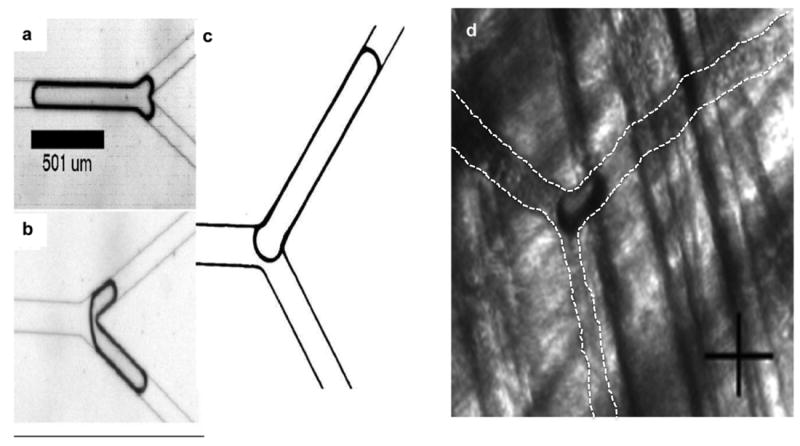
Comparison of lodging states observed by Calderon et al. using straight channels in acrylic (a)-(c) with in vivo observations (d). Calderon et al. observed that there were three states of bubble lodging (a)-(c). States (a) and (b) were not observed during our in vivo experiments. However, the lodged state in (c) compares well with that observed in the capillaries of the rat cremaster (d). White dashed lines indicate affected blood vessel boundaries in (d). Crosshair in (d) is 25μm × 25μm.
Note that lodging states at a bifurcation form only a subset of all lodging states, the other predicted and observed one being the sausage-shaped configuration [4]. This sausage-shaped configuration is seen in bubbles lodged in the straight sections of a vessel. No predictions have been made to-date as to the percentages of lodged bubbles in various configurations. Calderon et al.’s “bifurcation states” (a) and (b) were not observed during our in vivo experiments. This may be because of the differences in environments between the idealized model (PDMS) and the in vivo model. Bubble interaction with PDMS may be different from its interaction with the endothelial glycocalyx layer in the luminal surface of vessels. In addition, on a temporal scale, lodged state (c) would be the last one occurring and requires the greatest amount of pressure to dislodge [5]. Since the observation of lodged bubbles was conducted after the ultrasound exposure was concluded, the bubbles that may have initially lodged as states (a) or (b) could have subsequently been dislodged and re-lodged at state (c), remaining in that state for the remainder of the experiment.
Our observations provide the first quantification, theoretical or empirical, related to lodged-bubble configurations. Only ~5% of all lodged bubbles (n=112) exhibited a bifurcation state. 95% of the observed bubbles were lodged in straight sections of vessels; they, therefore, exhibited the sausage-shaped configuration. There may be multiple reasons for this. Calderon et al. did not vaporize droplets in the PDMS channel. They introduced large air bubbles into the straight portion of a channel and observed lodging at a bifurcation. In our experiments droplets were vaporized to form the bubbles. In the case of the first experiment, droplets were vaporized in the capillaries and the resulting bubbles were most likely formed in the straight sections of the vessels and lodged immediately. In the second experiment, droplets were vaporized in the feeder vessel. The resulting bubbles found their way into smaller vessels before lodging. One reason for their lodging in the straight sections may be the dynamic of coalescence. In order for bubbles to lodge, they have to be in contact with the vessel walls. As they move down the vessel tree, they have to become more elongated in order to continue passing through. This, in turn, slows down the movement of the bubble, which allows smaller bubbles to catch up and eventually coalesce with the first bubble. If this coalescence occurs in the straight portions of the vessel, it facilitates the lodging of the bubble in those sections before reaching the next bifurcation.
We also observed events of bubble dislodging (Fig. 6). The ~25μm diameter bubble was generated via droplet vaporization in the first order arteriole feeder vessel. The observation was made in the capillaries. In each frame a black arrow denotes the bubble, when present. Dashed white lines mark the capillary walls for better visualization. The first frame (Fig. 6a) shows the bubble in its lodged state. The portion of the vessel to the left of the bubble has no flow and individual RBCs can be identified (white arrow). The bubble is dislodged in frame two (Fig. 6b). This could be a result of either the build up of pressure or the decrease in size of the bubble or a combination of both. The arrow in frames 2-5 (Figs. 6b - 6e) identifies the dislodged bubble as it moves through the vessel. Once the bubble is dislodged, flow is restored to that vessel. No noticeable damage was induced at the location where the bubble was lodged. In all bifurcations, the critical pressure for dislodging has been found to be higher than the lodging pressure [5].
FIGURE 6.
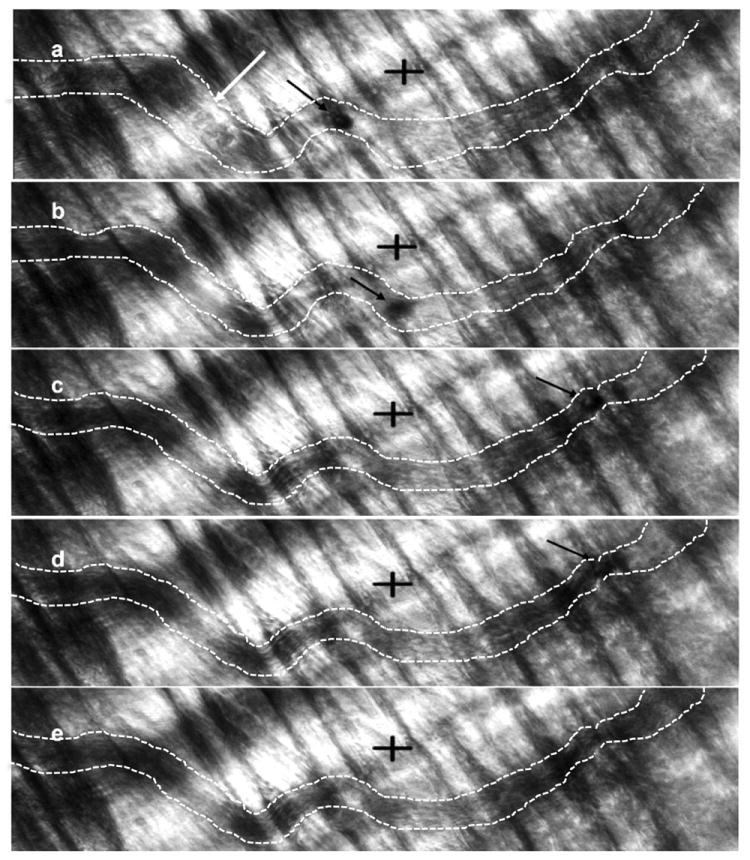
Observation of bubble dislodging in a capillary. Images (a)-(e) are consecutive frames from a video capture. Interframe time was 53 milliseconds. Crosshairs are 50μm × 50μm. The black arrow in each frame identifies the location of the ~25μm bubble. The bubble is lodged in (a). There is no flow to the left of the bubble and individual RBCs can be identified (white arrow). The bubble is dislodged in frame 2 (b) due to pressure buildup and/or decrease in bubble size. Once the bubble is dislodged, the bubble moves along the vessel to the right and flow is restored to the vessel.
CONCLUSION
We have provided the first optical evidence of lodging and dislodging of bubbles in the vasculature that have been site-activated through acoustic droplet vaporization. Vaporizing in the capillaries causes the rupture of these vessels and subsequent RBC extravasation. In contrast, no RBC extravasation is evident when exposure is performed in the feeder vessel. Therefore, the activation site could determine the type of therapy employed. The feeder vessel seems an appropriate site for ADV if restriction of blood supply is the main goal. If, however, the intention is to deliver agents to the interstitial space of the tumor (e.g. chemotherapy agent, drugs, etc.), the capillaries would serve as a better location for ADV. There is also a statistically significant difference in the size of lodged bubbles between capillary exposure (76μm mean length, 36μm mean diameter) and feeder vessel exposure (25μm mean length, 11μm mean diameter). Of note is the finding that although lodged bubbles may be of differing sizes, they all exhibit an aspect ratio (dimensionless bubble length) of 2. Our in vivo observations agree with theoretical predictions as well as experimental observations in straight channels using acrylic and PDMS, both on the shape of lodged bubbles (sausage-shaped/non-spherical) and their dimensions (Ld=2). Our ongoing work includes the study of conversion efficiency (droplets to bubbles), percentage of vascular occlusion, and the viability and efficacy of PFC droplets as vehicles for carrying chemotherapy agents.
Acknowledgments
This research was supported by NIH grant R01EB006476. We thank K.A. Ives (University of Michigan Health System) for her help with animal protocols and procedures.
GRANTS
This research was supported by NIH grant R01EB006476.
References
- 1.Baez S. An open cremaster muscle preparation for the study of blood vessels by in vivo microscopy. Microvasc Res. 1973;5:384–394. doi: 10.1016/0026-2862(73)90054-x. [DOI] [PubMed] [Google Scholar]
- 2.Bakker ENTP, Versluis JP, Sipkema P, VanTeeffelen JWGE, Rolf TM, Spaan JAE, VanBavel E. Differential structural adaptation to haemodynamics along single rat cremaster arterioles. J Physiol. 2003;548:549–555. doi: 10.1113/jphysiol.2002.035907. [DOI] [PMC free article] [PubMed] [Google Scholar]
- 3.Boehm T, Folkman J, Browder T, O’Reilly MS. Antiangiogenic therapy of experimental cancer does not induce acquired drug resistance. Nature. 1997;390:404–407. doi: 10.1038/37126. [DOI] [PubMed] [Google Scholar]
- 4.Branger AB, Eckmann DM. Theoretical and experimental intravascular gas embolism absorption dynamics. J Appl Physiol. 1999;87:1287–1295. doi: 10.1152/jappl.1999.87.4.1287. [DOI] [PubMed] [Google Scholar]
- 5.Calderon AJ, Heo YS, Huh D, Futai N, Takayama S, Fowlkes JB, Bull JL. Microfluidic model of bubble lodging in microvessel bifurcations. Appl Phys Lett. 2006;89:244103. [Google Scholar]
- 6.Eckmann DM, Branger AB, Cavanagh DP. Correction – Gas embolism. N Engl J Med. 2000;342:483. [PubMed] [Google Scholar]
- 7.Fabiilli ML, Haworth KJ, Fakhri NH, Kripfgans OD, Carson PL, Fowlkes JB. The role of inertial cavitation in acoustic droplet vaporization. IEEE Trans Ultrason Ferroelectr Freq Control. 2009;56:1006–1017. doi: 10.1109/TUFFC.2009.1132. [DOI] [PMC free article] [PubMed] [Google Scholar]
- 8.Franken RJPM, Peter FW, Anderson GL, Wang WZ, Werker PMN, Schuschke DA, Kon M, Barker JH. Anatomy of the feeding blood vessels of the cremaster muscle in the rat. Microsurgery. 1996;17:402–408. doi: 10.1002/(SICI)1098-2752(1996)17:7<402::AID-MICR10>3.0.CO;2-3. [DOI] [PubMed] [Google Scholar]
- 9.Giesecke T, Hynynen K. Ultrasound-mediated cavitation thresholds of liquid perfluorocarbon droplets in vitro. Ultrasound Med Biol. 2003;29:1359–1365. doi: 10.1016/s0301-5629(03)00980-3. [DOI] [PubMed] [Google Scholar]
- 10.Halliday D, Resnick R, Walker J. Fundamentals of physics. New York: John Wiley & Sons, Inc.; 1997. p. 485. [Google Scholar]
- 11.Heiser A. Rat Jugular Vein and Carotid Artery Catheterization for Acute Survival Studies. New York: Springer; 2007. Carotid artery catheterization; pp. 49–65. [Google Scholar]
- 12.Kripfgans OD, Fowlkes JB, Miller DL, Eldevik OP, Carson PL. Acoustic droplet vaporization for therapeutic and diagnostic applications. Ultrasound Med Biol. 2000;26:1177–1189. doi: 10.1016/s0301-5629(00)00262-3. [DOI] [PubMed] [Google Scholar]
- 13.Laccourreye O, Laurent A, Polivka M, Wassef M, Domas L, Brasnu D, Merland JJ. Biodegradable starch microspheres for cerebral arterial embolization. Invest Radiol. 1993;28:150–154. doi: 10.1097/00004424-199302000-00014. [DOI] [PubMed] [Google Scholar]
- 14.Lo AH, Kripfgans OD, Carson PL, Rothman ED, Fowlkes JB. Acoustic droplet vaporization threshold: effects of pulse duration and contrast agent. IEEE Trans Ultrason Ferroelectr Freq Control. 2007;54:933–946. doi: 10.1109/tuffc.2007.339. [DOI] [PubMed] [Google Scholar]
- 15.Lombard JH, Frisbee JC, Greene AS, Hudetz AG, Roman RJ, Tonellato PJ. Microvascular flow and tissue Po2 in skeletal muscle of chronic reduced renal mass hypertensive rats. Am J Physiol Heart Circ Physiol. 2000;279:H2295–H2302. doi: 10.1152/ajpheart.2000.279.5.H2295. [DOI] [PubMed] [Google Scholar]
- 16.Meininger GA, Fehr KL, Yates MB. Anatomic and hemodynamic characteristics of the blood vessels feeding the cremaster skeletal muscle in the rat. Microvasc Res. 1987;33:81–97. doi: 10.1016/0026-2862(87)90009-4. [DOI] [PubMed] [Google Scholar]
- 17.Muth CM, Shank ES. Gas embolism. N Engl J Med. 2000;342:476–482. doi: 10.1056/NEJM200002173420706. [DOI] [PubMed] [Google Scholar]
- 18.Nanhekhan LV, Siemionow M. Microcirculatory hemodynamics of the rat cremaster muscle flap in reduced blood flow states. Ann Plast Surg. 2003;51:182–188. doi: 10.1097/01.SAP.0000058500.56551.09. [DOI] [PubMed] [Google Scholar]
- 19.Qamar A, Wong ZZ, Fowlkes JB, Bull JL. Dynamics of acoustic droplet vaporization in gas embolotherapy. Appl Phys Lett. 2010;96:143702. doi: 10.1063/1.3376763. [DOI] [PMC free article] [PubMed] [Google Scholar]
- 20.Samuel S, Cooper MA, Bull JL, Fowlkes JB, Miller DL. An ex vivo study of the correlation between acoustic emission and microvascular damage. Ultrasound Med Biol. 2009;35:1574–1586. doi: 10.1016/j.ultrasmedbio.2009.04.013. [DOI] [PMC free article] [PubMed] [Google Scholar]
- 21.Smaje L, Zweifach BW, Intaglietta M. Micropressures and capillary filtration coefficients in single vessels of the cremaster muscle of the rat. Microvasc Res. 1970;2:96–110. doi: 10.1016/0026-2862(70)90055-5. [DOI] [PubMed] [Google Scholar]
- 22.Sprent P, Smeeton NC. Applied Nonparametric Statistical Methods. Florida: Chapman & Hall/CRC; 2007. Chapter 6: Methods for two independent samples; pp. 151–191. [Google Scholar]
- 23.Wang Y, Dimitrakopoulos P. Low-Reynolds-number droplet motion in a square microfluidic channel. Theor Comput Fluid Dyn. 2011;25 In publication. [Google Scholar]