Abstract
We describe a 100% efficient moving-wire interface for on-line coupling of high performance liquid chromatography which transmits 100% of carbon in non-volatile analytes to a CO2 gas accepting ion source. This interface accepts a flow of analyte in solvent, evaporates the solvent, combusts the remaining analyte, and directs the combustion products to the instrument of choice. Effluent is transferred to a periodically indented wire by a coherent jet to increase efficiency and maintain peak resolution. The combustion oven is plumbed such that gaseous combustion products are completely directed to an exit capillary, avoiding the loss of combustion products to the atmosphere. This system achieves the near complete transfer of analyte at HPLC flow rates up to 125 μL/min at a wire speed of 6 cm/s. This represents a 30x efficiency increase and 8x maximum wire loading compared to the spray transfer technique used in earlier moving wire interfaces.
Introduction
Moving Wire Interfaces (MWI), originally designed as effluent monitors for liquid chromatography,1,2,3 have been developed into accurate and precise systems for fast stable isotope analysis and semi-quantitative carbon content measurement of nonvolatile molecules suspended in solvent, such as HPLC effluent.4,5 In 1995, Caimi and Brenna published the description of a “liquid chromatography/combustion isotope ratio mass spectrometry” (LC/C-IRMS) MWI6. This system allowed on-line measurement of the 13C/12C ratios in LC peaks with an isotopic precision of around 1‰ for samples greater than 1 μg. The distinguishing features of this system were the transfer of solvent to the wire via a pneumatic aerosol spray, similar to that developed by Hayes et al.7 for a moving belt interface; the addition of copper oxide catalyst to the combustion oven; and leading and lagging carrier gas flows to capture gaseous combustion products. The LC/C-IRMS system produced temporal resolution comparable to a traditional HPLC UV absorption detector; however its efficiency for transferring effluent from an HPLC to the wire was only about 3%. More recently, Sessions et al., 20058 adapted a MWI for high precision single sample measurement. In this case, sample is manually deposited on the wire in single droplets. This enabled measurement of the 13C/12C ratio and the total carbon mass, with precisions of 0.3‰ and 5–10% respectively, in material containing as little as 90 ng carbon at a rate of one sample every 40 seconds.
The MWI described here-in has been adapted to transmit 100% of carbon in non-volatile analytes to a CO2 accepting ion source while producing temporal resolution similar to that of a traditional HPLC UV absorption detector. This allows more quantitative measurement, improved sensitivity, and reduced reliance on standards for on-line coupling. To achieve this, effluent is transferred to a periodically indented wire in a coherent jet where it is captured in localized droplets, and the combustion oven is plumbed so that gaseous combustion products are completely directed to an exit capillary. The ability of the system to efficiently handle small sub-μg sized samples makes it amenable to measurement techniques such as accelerator mass spectrometry (AMS).
Experimental Section
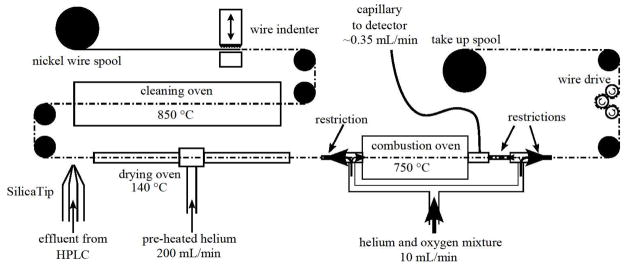
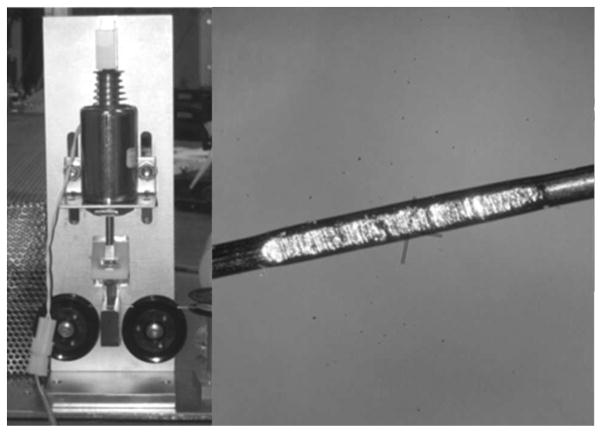
The design of this MWI is adapted from that of Session’s et al.,8 with the following additions and modifications (figure 1). A wire indenter generates periodic indentations on the wire to improve sample adhesion (figure 2). The wire is drawn at 6 cm/s with 2 mm indentations placed every 0.5 cm. Each indentation was able to hold 0.17 μL of effluent allowing a solvent flow rate of 125 μL/min. A 30 μm I.D. New Objective (Woburn, MA) SilicaTip emitter directs a coherent jet of effluent onto the wire. The drying oven was lengthened from 12 to 24 inches. Pre-heated helium, instead of nitrogen, is injected at the middle of the oven and allowed to exit at either end. Switching the drying gas from nitrogen to helium decreased drying time by a factor of five. Near the combustion oven wire exit, a lagging port linked to the carrier gas port was added. The linked ports direct gaseous combustion products to the exit capillary. Oven atmospheres, temperatures and flow rates were as listed in Table 1. The exit capillary is a 1 meter length of 75 μm fused silica tubing. The impedance of this tubing was selected to provide a flow rate of 0.350 mL/min to be compatible with an AMS gas accepting ion source.
Figure 1.
Diagram of moving wire interface.
Figure 2.
A). Solenoid driven wire indenter. B) Blemish created by 2 mm x 2 mm textured die on 0.25 mm diameter nickel wire. Texture on die generated by abrasion with 120 grit sand paper.
Table 1.
Average peak area versus percent methanol for droplets containing 1 μg sucrose.
| Percent Methanol | Peak Area (ng Carbon) | Variance of peak areas (ng Carbon) |
|---|---|---|
| 0 | 402 | 15 |
| 25 | 407 | 11 |
| 50 | 372 | 11 |
| 75 | 384 | 25 |
| 96 | 372 | 30 |
The temperature of the cleaning oven was set to 900 ºC as this was the highest temperature at which the nickel wire reliably stayed intact.
The drying gas flow rate was set to 200 mL/min to keep the water vapor concentration below 50% given that 0.125 g/min of produces ~170 mL/min of water vapor at 140 ºC.
The drying oven temperature was set to 140 ºC. This was sufficient to produce a steady mass 18 baseline at a solvent flow rate of 125 μL/min water and drying gas flow rate of 200 mL/min helium.
Increasing the drying oven temperature to 150 ºC did measurably reduce the mass 18 baseline further. The mass 44 partial pressure remained flat upon shifting the solvent mixture from water to methanol indicating methanol was also quantitatively removed (figure S1).
The combustion oven was set to 750 ºC. Increasing the combustion oven temperature further did not measurably increase CO2 yield from the tested analytes and increased the mass 44 background noise (figure S2, figure S3).
The combustion oven carrier gas flow rate was set to 10 mL/min. Between 4 to 10 mL/min this flow rate had no measurable effect on mass 44 background nor peak sizes. The carrier gass was 95% helium and 5% oxygen. This mixture was sufficient to maintain a steady mass 32 signal during sample combustion but low to remain compatible with an AMS gas accepting ion source.
It was found unnecessary to remove water from the output of this system as the amount of water produced did not appear to interfere with the mass 44 signal measured by the residual gas analyzer used for these experiments. A nafion dryer could be added to couple the interface to more water sensitive systems.
The primary requirement for the emitter is that its diameter be sufficiently small for a given flow rate, fluid density and surface tension, such that the fluid will form a continuous stream and not droplets at the emitter tip. This diameter may be calculated as follows using equations from literature.9,10,11
The primary force preventing droplet formation is due to momentum flux as fluid flows into a potential droplet at the emitter tip. This will be referred to as kinetic force. Fluid momentum per a unit of volume is
where p is momentum, V is volume, σ is fluid density, Q is volumetric flow rate, and r is the emitter tip radius. The kinetic force is then
where t is time.
The force from surface tension restraining the fluid is
where γ is surface tension.
Setting the forces equal to each other gives the maximum emitter tip radius for a given set of conditions,
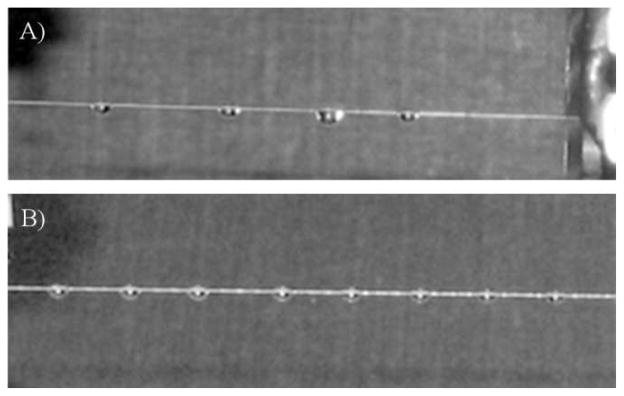
The direct coupling of HPLC to a moving wire interface requires that fluid placed on the moving wire stays at a fixed position on the wire to avoid mixing and coalescing issues. These issues can decrease resolution and increase evaporation time. If allowed to coalesce unabated, the weight of sufficient fluid in a single droplet will pull it from the wire. These issues are especially pronounced in fluids that bind weakly to the wire relative to their density, such as methanol. By introducing indentations to the wire at regular intervals, mixing and coalescing may be mitigated (Figure 3).
Figure 3.
A) 1 μL Droplets of 50% methanol in water deposited at regular intervals onto unblemished wire slide along wire and collide forming large droplets. These large droplets do not evaporate efficiently and risk falling from the wire. B) Droplets of same the solution and size, deposited at the same rate onto periodically indented wire adhere to the wire at regular intervals.
The increased surface area at an indent creates a trap which collects fluid into a droplet. The force binding the droplet is proportional to the difference between the flux of wire surface entering and leaving the droplet as it moves along the wire.11
Such an indent is generated by the wire indenter. This device uses a solenoid to drive a textured die into the wire. The depth of the indentation is set by an adjustable stop. The spacing of indentations and solenoid on-time are controlled by a Microchip Technology (Chandler, Az) PIC18f4250 microcontroller regulated by a 4.000 MHz crystal oscillator. This allows the solenoid on-time to be controlled with a precision of 1 microsecond. Precise control of the solenoid on-time achieves optimal impact force with minimal disruption to the wire’s motion.
The combustion oven requires a low friction entrance and exit for the wire. To prevent the escape of gaseous combustion products through these openings, a method similar to that described by Caimi and Brenna6 is employed. In this method, the carrier gas mixture is injected through ports near both the wire entrance and exit. However, instead of manually balancing flows as Caimi and Brenna describe, pressures are balanced by connecting the leading and lagging ports with low impedance tubing. By equalizing pressure at the ports, there should be no net flow between them. In this way, the gaseous combustion products are directed to the exit capillary. Restrictions between the ports and openings combined with positive pressure prevent atmosphere from entering the oven. A third restriction between the exit capillary and lagging port prevents unnecessary dilution of the combustion products.
Eluent was supplied by a Shimadzu DGU-14A in-line degasser and two LC-10ADVP HPLC pumps at a combined flow rate of 125 μL/min. Phase A was water and Phase B was methanol. A 30 μm I.D. New Objective (Woburn, MA) SilicaTip emitter was used to generate the coherent jet.
For measuring carbon transmitted to the exit capillary and low surface tension solvent compatibility, samples were injected by a manual injection valve and 10 μL loop without a column. For separations, samples were injected by a Shimadzu SIL-10ADVP auto injector and UV absorbance was measured by a Shimadzu SPD-20AV UV Detector. These separations were performed on a Thermo Scientific 25003-052130 C18 column held at 35 C.
A five to one open split was used to connect the exit capillary to a vacuum chamber housing a Stanford Research Systems (Sunnyvale, CA) RGA200 residual gas analyzer (RGA). To convert from mass 44 partial pressure to CO2 flow rate, CO2 gas was injected into the exit capillary immediately after combustion oven via a reversed open split. The CO2 flow rate was varied from 0.005 to 0.04 scc/min by an Alicat Scientific (Tucson, AZ) 1SCCM mass flow controller with a precision of 0.0002 scc/min. STP for mass flow rate calculations was 1 atm at 20 C. At the same time, the mass 44 partial pressure was recorded by the RGA. A weighted least squares fit of a second order polynomial to these measurements was used to convert from mass 44 partial pressure to CO2 flow rate.
CO2 transmitted from an injection was determined by the integrated peak area of the converted signal. Background was measured by an average of several data points recorded before and after the peak. Carbon mass transmitted was determined by the average area of the peaks in the data set. Uncertainty was determined by the confidence interval of the terms of the conversion equation and the variance of the peak areas.
Transmission efficiency was measured by injecting a series of aqueous sucrose solutions of known concentration and comparing against the transmitted carbon mass. The mass of carbon in each injection was varied from 8 ng to 620 ng.
Low surface tension solvent compatibility was tested by varying solvent and eluent composition from 100% water to 96% methanol and 4% water. 1μg sucrose was used to provide combustible material for each injection.
For determining coupling efficacy, a 7 minute linear gradient from 90% to 70% water was used to separate an aqueous solution containing 0.33 μg/μL each of phenylalanine, tryptophan, and caffeine. UV absorbance was measured at the respective absorbance maxima for each sample, 247 nm, 284 nm and 273 nm. The 247 nm trace was found to provide good quantitative data on peak shape for all three samples and was thus selected for comparison to the RGA mass 44 trace.
Results and Discussion
Fluid directed in a coherent jet onto the periodically indented wire was found to collect at each indentation with sufficient consistency to allow quantitative solvent removal by the drying oven (figure S2, figure S3). As gas turnover rate in the combustion oven is approximately 8 second and the time between droplets is less than a tenth of a second, individual droplets were not observable in the mass 44 trace.
Mass carbon injected via aqueous sucrose samples versus mass carbon transmitted yielded a value 1.0 +/− 0.04 (Table 2). This indicates a transmission efficiency of 100%. This represents a 30x efficiency increase and 8x maximum wire loading compared to the spray transfer technique used in earlier moving wire interfaces.6
Table 2.
Mass carbon injected vs mass carbon transmitted to the exit capillary per a peak. An average of mass transmitted over mass injected yields a value of 1.0 +/− 0.04.
| Mass Carbon Injected (μg) | Mass Carbon Transmitted (μg) | Transmitted/Injected |
|---|---|---|
| 6.22E-01 +/− 1.2E-02 | 6.57E-01 +/− 5.9E-02 | 1.06 +/− 0.10 |
| 2.09E-01 +/− 4.2E-03 | 2.10E-01 +/− 1.9E-02 | 1.01 +/− 0.09 |
| 7.21E-02 +/− 1.4E-03 | 6.85E-02 +/− 6.2E-03 | 0.95 +/− 0.09 |
| 2.42E-02 +/− 4.8E-04 | 2.26E-02 +/− 2.0E-03 | 0.93 +/− 0.09 |
| 8.16E-03 +/− 1.6E-04 | 8.80E-03 +/− 7.9E-04 | 1.08 +/− 0.10 |
Data from testing low surface tension solvent compatibility is presented in Table 2. Average peak area decreased by 7% and the standard deviation of peak areas increased from 4 to 8% of the average area upon shifting from 0 to 96% methanol. The decrease in signal and increase in uncertainty could be explained by an increase in the intermittent loss of effluent as the interfacial energy between the fluid and the wire decreased. This effect might be reduced by increasing the wire diameter, thus increasing the contact area between the fluid and the wire.
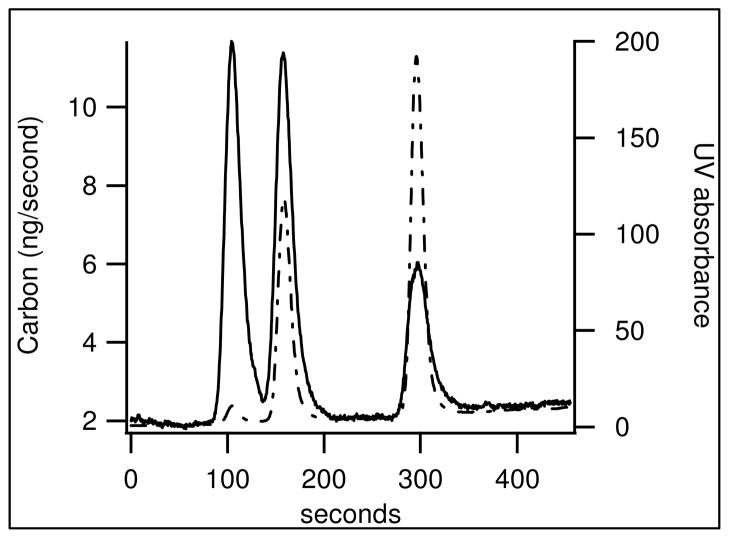
Traces from HPLC coupling are depicted in figure 4. The shape of each CO2 peak matched well with its corresponding UV absorption peak. Tryptophan and phenylalanine, which were closely eluted, remained separate and distinct peaks indicating the system maintained good temporal resolution. The area of the UV absorption peaks is not proportional to that of the CO2 peaks as the molecule’s absorption coefficient is highly dependent on its structure.
Figure 4.
A separation of phenylalanine, tryptophan and caffeine, listed in order of elusion. The solid line is the RGA mass 44 signal converted to ng/second Carbon. The dotted line is UV absorbance for the same trace.
A rising baseline was observed as the gradient moved from water to methanol. To test if the baseline increase was from residual methanol, the background was measured across the range of methanol and water mixtures without a column (figure S4). These measurements did not show a rising baseline. Additionally increasing the drying oven temperature from 140 ºC to 150 ºC did not decrease the baseline. This indicates that the increasing baseline is not likely due to residual solvent.
Caffeine produced peak areas 30% smaller than expected from the carbon mass of the sample compared to that of tryptophan and phenylalanine. Increasing the drying oven temperature in 10 degree increments from 140 to 180 ºC showed a further 1.2%/ºC decrease in carbon transmitted from caffeine (figure S5). This could be due to sublimation of caffeine in the drying oven as caffeine’s vapor pressure of 3 to 14 Pa between 130 to 140 C is more than three orders of magnitude higher than that of phenylalanine and tryptophan.12,13,14
Conclusion/Future Directions
This on-line moving wire interface provides 100% efficiency for transferring carbon from non-volatile materials in solvents to a CO2 gas accepting ion source at a maximum solvent flow rate of 125 uL/min. The ability of the system to handle small ug sample sizes with high efficiency makes the system amenable to measurement techniques such as Accelerator Mass Spectrometry (AMS). Presently, all biochemical samples for 14C-AMS analysis are first combusted to CO2, followed by a chemical reduction to graphite. These methods have been successful for the vast majority of biochemicals measured via AMS15,16. However, a minimum sample size of 0.5 mg carbon is required for routine preparation. Subsequently, a well-defined amount of carrier carbon, with a low 14C/C isotope ratio, is added to very small samples. This requires quantifiable isotope dilution to maintain precision. Also, significant handling is required for each sample and the whole process suffers from low sample throughput (~150 samples processed/day) and long turnaround times (~2 days minimum). The addition of carrier carbon also limits our sensitivity to ~1 amol 14C.
With the interface described here, the time required for analysis of biochemical samples by accelerator mass spectrometry could be drastically reduced from days to minutes. Just as importantly, the method could also be applicable to handling continuous flows of liquid, enabling on-line real-time liquid chromatography accelerator mass spectrometry analysis. This method involves depositing liquid samples on an indented moving wire, and passing the moving wire through a combustion oven to convert samples to carbon dioxide gas in a helium stream. The gas could then be directed via a capillary to a gas-accepting ion source for AMS analysis.
Supplementary Material
Acknowledgments
This work performed under the auspices of the U.S. Department of Energy by Lawrence Livermore National Laboratory under Contract DE-AC52-07NA27344 with support from LLLNL and the NCRR/NIH National Resource for Biomedical Accelerator Mass Spectrometry (RR013461). The authors thank Benjamin Stewart for advice on HPLC operation and methods and Alex Sessions for a tour of his moving wire device.
Footnotes
Supporting Information Available: This material is available free of charge via the Internet at http://pubs.acs.org. Includes description of indentation mechanics and profiles comparing mass 44 and mass 18 background levels and noise to oven temperatures and solvent composition.
References
- 1.James AT, Ravenhill JR, Scott RPW. A New Method for the Automatic Detection of Zones Eluted from the Liquid Chromatogram. Chemistry And Industry. 1964;18:746–748. [Google Scholar]
- 2.Dixon MT, Maggs RJ. A Commercial Detector for Monitoring Eluent from Liquid Chromatographic Columns. Appl Spectrosc. 1968;22:227. [Google Scholar]
- 3.Scott RPW, Lawrence JG. AN IMPROVED MOVING WIRE LIQUID CHROMATOGRAPHY DETECTOR. J Chromatogr Sci. 1970;8:65. [Google Scholar]
- 4.Godin JP, Fay LB, Hopfgartner G. Liquid chromatography combined with mass Spectrometry for C-13 isotopic analysis in life science research. Mass Spectrom Rev. 2007;26:751–774. doi: 10.1002/mas.20149. [DOI] [PubMed] [Google Scholar]
- 5.Brenna JT, Corso TN, Tobias HJ, Caimi RJ. High-precision continuous-flow isotope ratio mass spectrometry. Mass Spectrom Rev. 1997;16:227–258. doi: 10.1002/(SICI)1098-2787(1997)16:5<227::AID-MAS1>3.0.CO;2-J. [DOI] [PubMed] [Google Scholar]
- 6.Caimi RJ, Brenna JT. High-Sensitivity Liquid-Chromatography Combustion Isotope Ratio Mass-Spectrometry of Fat-Soluble Vitamins. J Mass Spectrom. 1995;30:466–472. [Google Scholar]
- 7.Hayes MJ, Lankmayer EP, Vouros P, Karger BL, Mcguire JM. Moving Belt Interface with Spray Deposition for Liquid-Chromatography Mass-Spectrometry. Anal Chem. 1983;55:1745–1752. [Google Scholar]
- 8.Sessions AL, Sylva SP, Hayes JM. Moving-wire device for carbon isotopic analyses of nanogram quantities of nonvolatille organic carbon. Anal Chem. 2005;77:6519–6527. doi: 10.1021/ac051251z. [DOI] [PubMed] [Google Scholar]
- 9.Wang W, Ngan KH, Gong J, Angeli P. Observations on single drop formation from a capillary tube at low flow rates. Colloid Surface A. 2009;334:197–202. doi: 10.1016/j.colsurfa.2008.10.011. [DOI] [Google Scholar]
- 10.Barhate RS, Patil G, Srinivas ND, Raghavarao KSMS. Drop formation in aqueous two-phase systems. J Chromatogr A. 2004;1023:197–206. doi: 10.1016/j.chroma.2003.10.021. [DOI] [PubMed] [Google Scholar]
- 11.De Gennes PG, Brochard-Wyart F, Quéré D. Capillarity and wetting phenomena: drops, bubbles, pearls, waves. Springer Verlag; 2004. [Google Scholar]
- 12.Griesser UJ, Szelagiewicz M, Hofmeier UC, Pitt C, Cianferani S. Vapor pressure and heat of sublimation of crystal polymorphs. J Therm Anal Calorim. 1999;57:45–60. [Google Scholar]
- 13.Svec HJ, Clyde DD. Vapor Pressures of Some a-Amino Acids. Journal of Chemical & Engineering Data. 1965;10:151–152. doi: 10.1021/je60025a024. [DOI] [Google Scholar]
- 14.Gaffney JS, Pierce RC, Friedman L. Mass-Spectrometer Study of Evaporation of Alpha-Amino-Acids. J Am Chem Soc. 1977;99:4293–4298. doi: 10.1021/ja00455a015. [DOI] [PubMed] [Google Scholar]
- 15.Vogel JS. RAPID PRODUCTION OF GRAPHITE WITHOUT CONTAMINATION FOR BIOMEDICAL AMS. Radiocarbon. 1992;34:344–350. [Google Scholar]
- 16.Ognibene TJ, Bench G, Vogel JS, Peaslee GF, Murov S. A high-throughput method for the conversion of CO2 obtained from biochemical samples to graphite in septa-sealed vials for quantification of C-14 via accelerator mass spectrometry. Anal Chem. 2003;75:2192–2196. doi: 10.1021/Ac026334j. [DOI] [PubMed] [Google Scholar]
Associated Data
This section collects any data citations, data availability statements, or supplementary materials included in this article.


