Abstract
The prospect for consistent computer aided refinement of stereoselective enzymes is explored by simulating of the hydrolysis of enantiomers of an α-substituted ester by the wild type and mutants of CALA, using several strategies. In particular we focus on the use of the empirical valence bond (EVB) method in a quantitative screening for enantioselectivity, evaluating both kcat and kcat/KM in the R and S stereoisomers. It is found that an extensive sampling is essential for obtaining converging results. This requirement points out towards possible problems with approaches that use a limited conformational sampling. However, performing the proper sampling appears to give encouraging results and to offer a powerful tool for computer aided design of enantioselective enzymes. We also explore faster strategies for identifying mutations that will help in augmenting directed evolution experiments but these approaches requires further refinement.
Keywords: transition state binding, directed evolution, computational enzymology
Introduction
Optimizing enzymes to catalyze selective enantioselective reactions has a major potential in biotechnology. [1] For example, the use of biocatalyst for efficient synthesis of enantiomerically pure chiral molecules is of great importance in the production of drugs by the pharmaceutical industry. [2] Furthermore, understanding the observed enantioselectivity in different enzymes presents a significant challenge for approaches aimed at understanding enzyme catalysis. Experimental studies of enantioselective enzymatic reactions have provided major advances in recent years (e.g., ref [3–5]). A major focus of these studies turned to lipases [3, 6–11] via an examination of esterification reactions, [12] solvent effects, [13] the temperature effects [7] and substrates effects. [8–10] Furthermore, instructive advances have been done with directed evolution experiments. [3, 11]
Enantioselective enzymatic reactions have also been examined by theoretical approaches, including MM, MD studies [9, 12, 14, 15] and QM/MM, [16] but these interesting studies (see also below) have not provided quantitative insight (in our view quantitative prediction requires one to have calculated values that are within 1–2 kcal/mol from the corresponding observed values). Attempt to use cluster QM model [17] has provided interesting insight and encouraging results but such approach might find difficulties in capturing entropic effects and in overestimating strong steric effects. Here the initial model building may be crucial since the effect of alternative conformations is hard to asses. Overall it is important to explore QM/MM approaches that involve extensive sampling and evaluate the actual activation free energies, since such strategies should be able to explore entropic effects and to allow for exploring, more realistic relaxation of the active site. Here it is important to validate the method used by careful comparison to available experimental results and an excellent test case is provided by the observed enantioselectivity of Candida antarctica lipase A (CALA) and its mutants.
At this point it is important to clarify that the use of force field and energy minimization method in assessing the stereoselectivity of TS models (e.g., ref [11]) can provide interesting insight, but may not be able to capture the quantitative aspects of the actual TS binding free energy of different enantiomers. Attempts to use average interaction energies from MD simulations (e.g., ref [15, 18]) can give sometimes the correct trend. However, the study of ref [15] required rather arbitrary selection of the regions included in the averaging and different regions gave different results, while the insightful study of ref [18] drastically overestimated the energy change upon mutations. An interesting attempt to obtain more quantitative results has been reported by ref [19], who explored the enantioselectivity of dehalogenase by using the LRA/β (see Computational Methods section) and exploring the so called near attack conformation (NAC). However, this method has not been validated in a quantitative way as it did not provide the actual calculated enantioselectivity but rather used the LRA binding energy and the NAC criterion as a way to asses the observed selectivity.
In trying to obtain more quantitative results it is crucial to improve two aspects of the modeling; namely the potential surface and the sampling. That is, trying to evaluate the free energy of mutating the R to S enantiomers using a force field model of their TS can be useful, but here it is important to determine the correct charge distributions and structure of the TS and this can be best done by a QM/MM approach (it is important to capture the change of the TS charge and geometry upon interaction with the enzyme active site). Unfortunately, the use of a QM/MM approach is unlikely to give reliable free energies without extensive sampling (in fact, the sampling of the enzyme substrate configurations is also the most crucial requirement in classical force field studies). Here the empirical valence bond (EVB) arguably provides the optimal current strategy, since it combines a reliable semiempirical QM/MM model with the ability for extremely effective sampling.
This work demonstrates that the EVB approach allows one to explore the effect of different mutations that switch the catalytic activities between the R and S enantiomers of the CALA. We also examine faster screening approaches and find the linear response approximation (LRA) in its LRA/β version to have some promising aspects. Our study establishes the need for extensive sampling in computational attempts to quantify the selectivity. Thus although using a few structures may produce the correct results, trying other structure is likely to give different results.
Results and Discussion
Initial Analysis
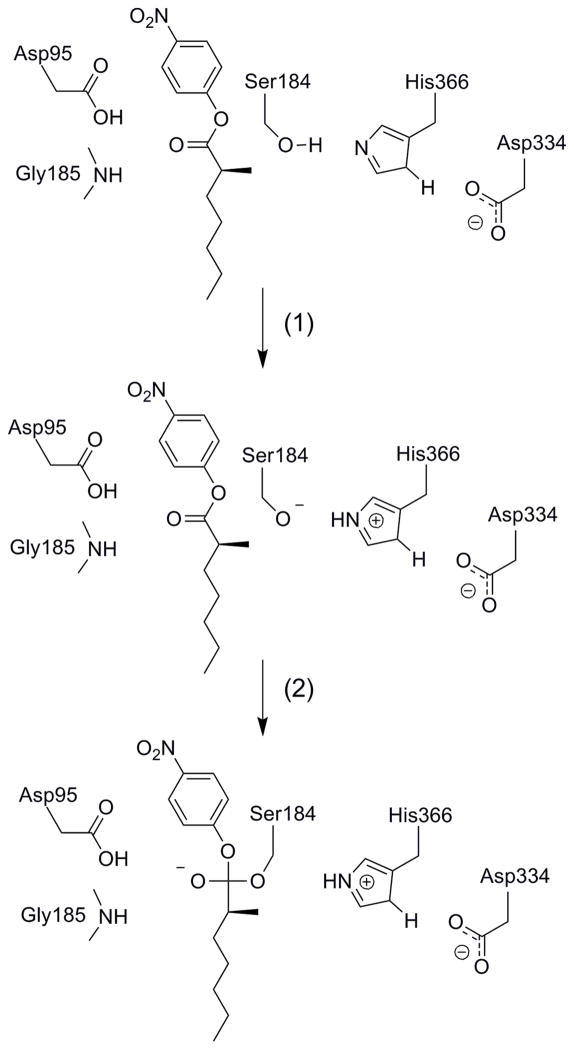
CALA is a serine hydrolase whose catalytic mechanism has been studied extensively (for e.g., ref [20, 21]). The CALA active site includes the catalytic triad of Asp334, His366 and Ser184, which acts in the same way as the well studied serine proteases [20–22] where a proton transfer from Ser184 to His366 is followed by a nucleophilic attack of the ester carbonyl by the deprotonated Ser184 (Figure 1). The enzyme catalyzed the reaction by stabilizing the negatively charged oxyanion by an oxyanion hole, the protonated Asp95 and Gly185, (the same type of oxyanion hole is a key catalytic factor in various proteases [20, 21]) and by the electrostatic interaction between Asp334 and the ionized His366 (again in analogy with serine proteases [22, 23]). The reaction can be rate limiting by either the acylation or the deacylation steps [7, 11] and in the case of α-substituted esters hydrolysis by CALA studies here it is limited by the acylation step. [11]
Figure 1.
A schematic description of the acylation step in the catalytic reaction of the CALA. The reaction is considered as a two-step mechanism, where step (1) involves a proton transfer from Ser184 to His366 and step (2) involves the attack of the negatively charged serine on the carbonyl carbon of the substrate and a formation of a tetrahedral intermediate.
The enantioselectivity, which is the main subject of the present work, is defined by the catalytic efficiency ratio (E) of the enzymatic rate of the two enantiomers. A convenient way for expressing this ratio is given by:
| (1) |
where the notation “fast” stands for the enantiomer with the larger kcat/KM. The free energies that are relevant to kcat/KM (or more precisely to kcat/Kbind(RS)) can be expressed in terms of the TS binding free energy [22, 24]
| (2) |
where Δg‡p is the activation barrier that corresponds to kcat/Kbind(RS) (see ref [24]).
In principle we can (and will) calculate the TS binding free energy, but in the first stage we can just focus on the difference in kcat rather than kcat/KM. The contribution to the enantioselectivity in terms of kcat will be called here E′:
| (3) |
where
| (4) |
Our study started with a systematic analysis of the reference reaction for histidine assisted ester hydrolysis in solution, using the relevant experimental information. The calibration procedure includes the energetics of the proton transfer (PT) from serine to imidazole and energetics of the following nucleophilic attack (NA) of the ionized serine and carbonyl group of the substrate (see ref [22]).
The energy of the proton transfer step in water is determined from the pKa values (pKa (Ser) ~ 16 and pKa (His) ~7) and is found to be 12 kcal/mol. The energy of forming the tetrahedral intermediate was calibrated by using the rate constant of the uncatalyzed reaction in water of the methanol with p-nitrophenyl acetate (600 M−1s−1 [25]) and extrapolating it to 55M (which guarantees the presence of the OH− in the solvent cage). The resulting rate constant (kcage) is around 3.3 · 104 s−1 and an activation free energy equals 11.3 kcal/mol.
Combining the free energy for the PT step and the nucleophilic attack gives a total activation barrier ( ) of ~ 23.3 kcal/mol for our reference reaction in solvent cage. The barrier for a concerted path is expected to be very similar to our stepwise estimate (see ref [26]). The above estimate was used to calibrate the EVB surface for our reference reaction in solution and the corresponding free energy surface is shown in Figure S1 (see SI). The corresponding free energy surface for the enzymatic reaction will be considered below.
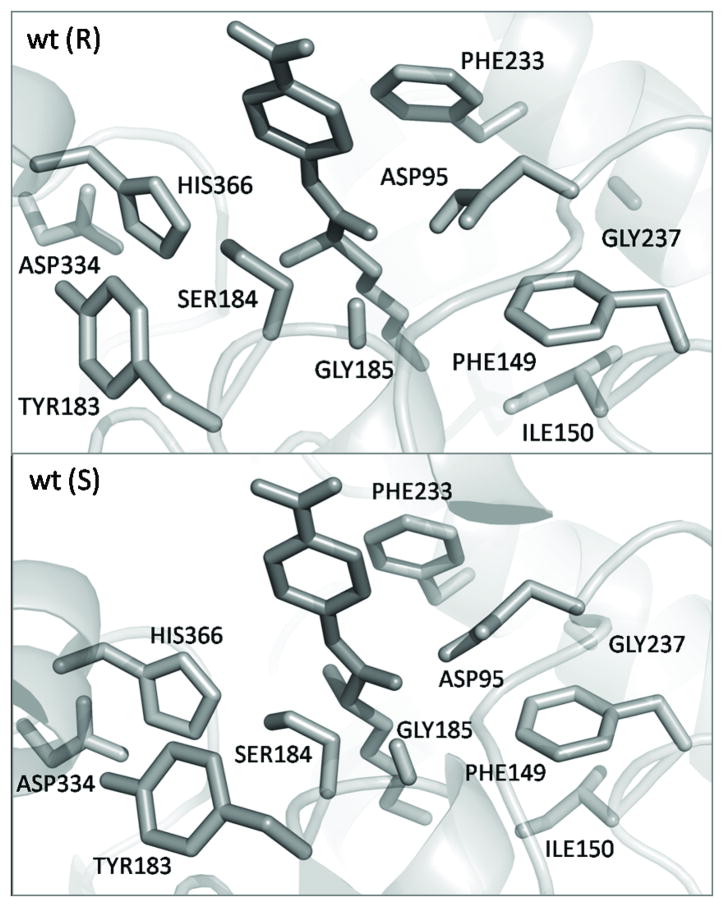
The starting coordinates of the unbound CALA were obtained from Protein Data Bank (PDB: 2VEO, 2.20 Å). [27] The R and S enantiomers of 4-nitrophenyl 2-methylheptanoate substrate were built into the free enzyme (shown in Figure 2) using the AutoDock 4.0 software. [28] The automated docking of the ligand to the CALA was performed using the standard protocol (similar to our previous studies [29]). The ligand was prepositioned within the binding pocket similar to the ligand placement shown in ref [11]. Using the AutoDock 4.0 program [28] several good ligand conformations were found. Based on the known biological and modeling data, the preferred ligand conformation was identified that were used as the starting structures for MD simulations. During the system preparation, the crystal waters were removed; all hydrogen atoms and water molecules were added using the MOLARIS software package. [30, 31]
Figure 2.
The structure of active site of the wild type CALA with the R and S enantiomers of the 4-nitrophenyl 2-methylheptanoate substrate.
It must be emphasized at this point that our results do not depend on the model building used (as long as we have reasonable starting point) since we perform very extensive averaging that allows the system to find its lowest free energy landscape.
The partial atomic charges of the ligand were determined from the electronic wave functions by fitting the resulting electrostatic potential in the neighborhood of these molecules using Merz-Kollman scheme. The electronic wave functions were calculated with hybrid density functional theory (DFT) at the B3LYP/6-311G** level, performed with the Gaussian03 package.[32]
The generated protein complex system (that includes the protein, bound ligand, water and Langevin dipoles) was preequilibrated for 200ps at 300K with a time steps of 1fs using the ENZYMIX force field. [30, 31] The spherical inner part of the system with radius 18Å was constrained by a weak harmonic potential of the form, , with A=0.03 kcal mol−1 Å2 to keep the protein atoms near the corresponding observed positions. Along with the inner spherical constraints, the weak residue constraints of 0.5 kcal mol−1 Å2 were applied on the substrate, Asp95, His366 and Asp334 (as these residues are in similar position in the R and S enantiomers). The protein atoms outside this sphere were held fixed and their electrostatic effects excluded from the model.
The mutant systems were generated from the wild type (wt) CALA X-ray structure using PyMOL molecular graphics software [33] with the following 200ps relaxation.
Using the EVB parameters calibrated on the reference solution reaction we evaluated the EVB free energy surface for the reaction in CALA. The resulting free energy surface (Figure S2, see SI) with a calculated activation barrier of 18.3 kcal/mol. This barrier is in a good agreement with the observed barrier ( ) obtained using transition state theory and the observed kcat of the wild type CALA for the R enantiomer (kcat =0.48 s−1 [11]). An overall the enzyme stabilizes the transition state by about 5 kcal/mol than water does. The structural elements responsible for the stabilization of the transition state in enzyme are shown in Figure 1 and 2.
Calculating the Mutational Effects on E′
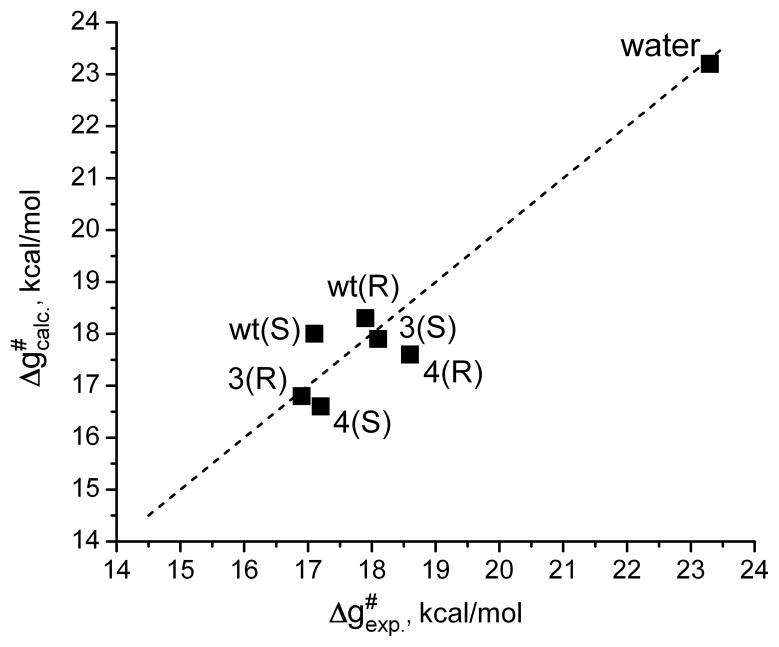
One of our main aims of this work is the evaluation of the contribution to enantioselectivity for kcat (E′). However, before exploring our ability to calculate the E′ of CALA and its mutant, it is important to establish the reliability of our approach in reproducing the observed catalytic effects in the wt and the different mutants. The performance of the EVB in reproducing the catalytic effect of the wild type has been demonstrated in the previous section and the performance with the mutants is considered in Table 1 and Figure 3. As seen from the table and the figure the calculated activation free energies are in good agreement with the corresponding observed values.
Table 1.
Calculated and observed Δg‡cat for the reaction of CALA and its mutants. [a]
| mutations [b] | label | enantiomer | ΔG0calc. (PT), kcal/mol | Δg‡calc. (NA), kcal/mol | Δg‡calc. (total), kcal/mol | Δg‡exp. (total), kcal/mol | E′exp. [c] | E′calc. [c] |
|---|---|---|---|---|---|---|---|---|
| water | 1 | R/S | 11.9 | 11.3 | 23.2 | 23.3 | - | - |
| wild type | 2 | R | 13.1 | 5.2 | 18.3 | 17.9 | 3.8 (S) | 1.7 (S) |
| S | 14.5 | 3.5 | 18.0 | 17.1 | ||||
| F233L/G237Y | 3 | R | 12.1 | 4.7 | 16.8 | 16.9 | 7.6 (R) | 6.4 (R) |
| S | 14.1 | 3.8 | 17.9 | 18.1 | ||||
| T64M/F149S/I150D/F233N/G237L | 4 | R | 13.1 | 4.5 | 17.6 | 18.6 | 11.0 (S) | 5.4 (S) |
| S | 14.2 | 2.4 | 16.6 | 17.2 | ||||
| T64M/F149S/I150D/Y183F/F233N/G237L | 5 | R | 13.8 | 4.6 | 18.4 | - | no exp. | 14.9 (S) |
| S | 14.5 | 2.3 | 16.8 | - | ||||
| Y183F | 6 | R | 15.2 | 3.2 | 18.4 | - | no exp. | 6.4 (S) |
| S | 12.5 | 4.8 | 17.3 | - | ||||
| G237Y | 7 | R | 11.4 | 5.1 | 16.5 | - | no exp. | 6.4 (S) |
| S | 13.1 | 2.3 | 15.4 | - | ||||
| F233N | 8 | R | 13.2 | 5.2 | 18.4 | - | no exp. | 24.8 (S) |
| S | 13.3 | 3.2 | 16.5 | - | ||||
| F233G | 9 | R | 10.6 | 3.9 | 14.5 | - | Eexp.= 17 (R) | 12.6 (R) |
| S | 13.2 | 2.8 | 16.0 | - | ||||
| F149Y/I150N/F233G | 10 | R | 12.6 | 2.9 | 15.5 | - | Eexp.= 104 (R) | 68.5 (R) |
| S | 14.3 | 3.7 | 18.0 | - | ||||
| F233L | 11 | R | 11.5 | 5.6 | 17.1 | - | no exp. | 3.3 (R) |
| S | 14.0 | 3.8 | 17.8 | - |
The calculated Δg‡cat (in kcal/mol) reflects an average over 10 conformations obtained from equally spaced points along the relaxation trajectory. The standard deviation is reported in Table S3.
The X-ray structure 2VEO.pdb of the wild type CALA [27] were used as the initial geometry for the subsequent wt relaxation and EVB calculations. The initial structures for the different mutations were generated from the wt CALA X-ray structure, using the PyMOL molecular graphics software, [33] following by 200ps relaxation run.
Figure 3.
The correlation between the calculated and observed activation free energies of the catalytic hydrolysis of the R and S enantiomers of the substrate by the wild type CALA and its mutants.
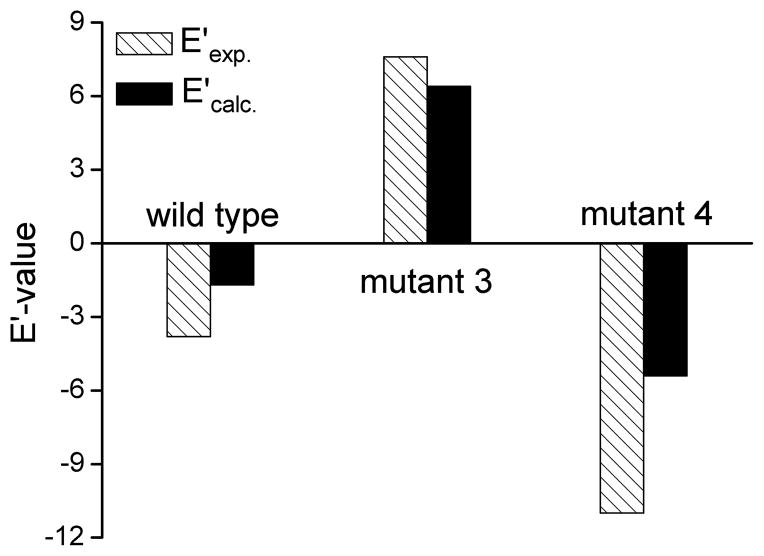
After establishing the performance of the EVB in reproducing the general catalytic effect, we turn our attention to the performance in calculating E′. The calculated results in terms of the E′ of the system studied are given in Table 1 and Figure 4. We consider these results to be encouraging, considering the difficulties in obtaining stable results. That is, the simulations involved configurations with different degree of penetration of water molecules to the active site and sometimes in cases where the R enantiomer occupied the site usually occupied by the S enantiomer. Now despite this difficulty, which may lead to significant problems with QM/MM approaches without sampling, the final calculated average free energies show converging trend with a RMS of less than 2 kcal/mol and with trend that reproduces the observed trend.
Figure 4.
The calculated (black bars) and observed (empty bars) E′ values for the wild type CALA and the 3 and 4 mutants. The plot gives positive and negative values, respectively, to E′ (R) and E′ (S).
Overall the results presented in Figure 4 indicate that the EVB approach allows one to reproduce the trend in the enantioselectivity E′ with proper systematic sampling.
Calculating the Total Selectivity and Its Changes by Mutational Effects
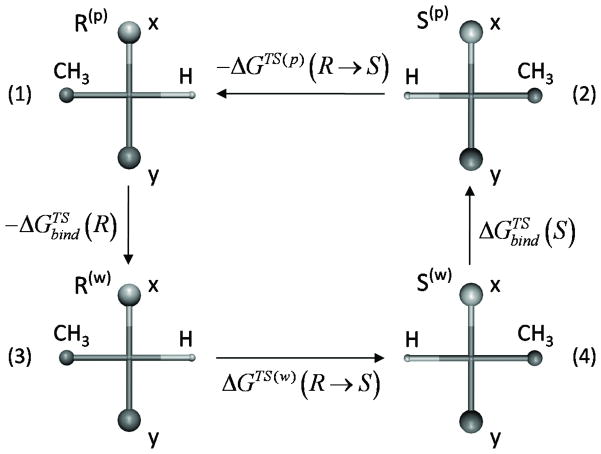
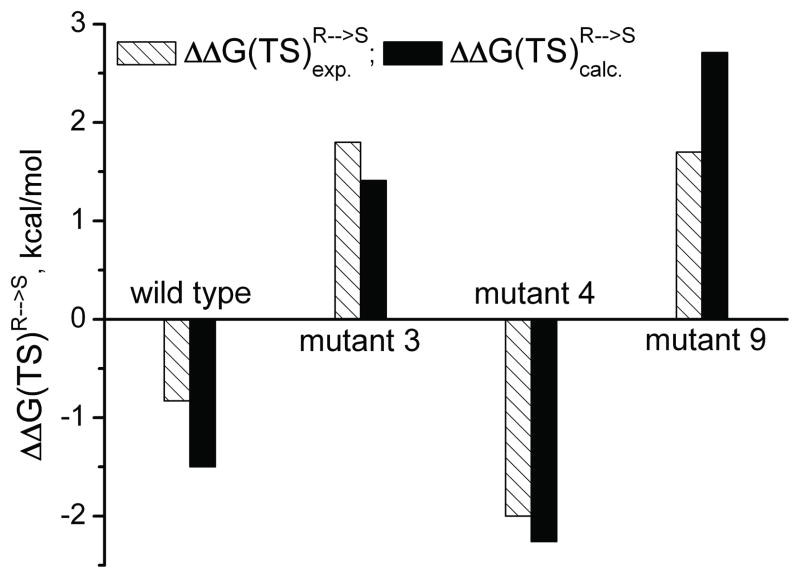
Although the main focus in this work has been on the contribution of kcat to the enantioselectivity (namely E′), we also explored our ability to evaluate E by using the thermodynamic cycle of Figure 5 and mutating the R to S at the TS in the protein and then just to subtract the corresponding results for the mutation in water. The approach of mutating TS has already been used in our early mutational studies, [34] but at that time we mutate the protein, while here we mutate the substrate. The results of our R to S mutational procedure are summarized in Table 2 and Figure 6.
Figure 5.
A thermodynamic cycle for mutating R to S. The figure describes schematically the mutation of the atoms which are real in one form to dummy atom in the other form and conversely mutation of the atoms which are dummy in one form to real in the other form.
Table 2.
| system | (R → S) | (R → S) | Ecalc. | Eexp. |
|---|---|---|---|---|
| wt | −1.50 (S) | −0.83 (S) | 12 (S) | 4 (S) |
| mutant 3 | 1.41 (R) | 1.80 (R) | 11 (R) | 20 (R) |
| mutant 4 | −2.26 (S) | −2.00 (S) | 43 (S) | 28 (S) |
| mutant 9 | 2.71 (R) | 1.70 (R) | 91 (R) | 17 (R) |
Energies in kcal/mol. The energy shift ΔGTS (w) (R → S) of Eq. 5, for the specific implementation of the dummy atoms was 0.39 kcal/mol.
Figure 6.
The calculated (black bars) and observed (empty bars) E values for the wild type CALA and some mutants. The plot gives positive and negative values, respectively, to E(R) and E(S).
While the results are not perfect, they are interesting since we are dealing with probably the first full formally rigorous free energy calculation of mutational effects of the absolute selectivity, where all the elements of the calculation involve careful sampling of what is basically a reliable semiempirical QM/MM potential. Most notable we could reproduce the steric effect of the F233G mutation, which will also be discussed below.
Another effective strategy was obtained by using the PDLD/S –LRA/β [29] approach to calculate the binding free energy and the using the EVB calculated E′ in order to evaluate the total E. The results obtained by this approach are given in Table 3. Here we exploited the fact that fully microscopic, yet accurate, calculations of binding free energy have serious convergence problems (this can also affect the implicit TS binding in our mutation approach), while using the PDLD/S-LRA/β provides stable binding results (see ref [29]).
Table 3.
Calculated and observed selectivities obtained using the EVB activation barriers and the PDLD/S binding free energies. [a]
| system | (R → S) | (R → S) | ΔΔG bind,exp (R → S) | (R → S) | (R → S) | Ecalc. | Eexp. |
|---|---|---|---|---|---|---|---|
| wt | −0.30 | 0.19 | 0.05 | −0.49 | −0.83 | 2 (S) | 4 (S) |
| mutant 3 | 1.10 | −0.57 | −0.57 | 1.67 | 1.80 | 17 (R) | 20 (R) |
| mutant 4 | −1.00 | 0.36 | 0.56 | −1.36 | −2.00 | 10 (S) | 28 (S) |
| mutant 9 | 1.50 | −0.14 | no exp. | 1.64 | 1.70 | 14 (R) | 17 (R) |
Energies in kcal/mol.
Exploring Computer Aided Refinement of Enantioselectivity
While the above sections consider the validation of our ability to reproduce E′ and E for different mutants, we clearly need to be able to predict which mutations would increases E. Of course one can think on brute force approach of just trying to calculate E (or E′) for different generated residues in the active site, where we consider the effect of changing from polar to non-polar residues or from small to large residues. However, having a general guide would be a much more promising strategy. Thus we explored below some initial screening approaches.
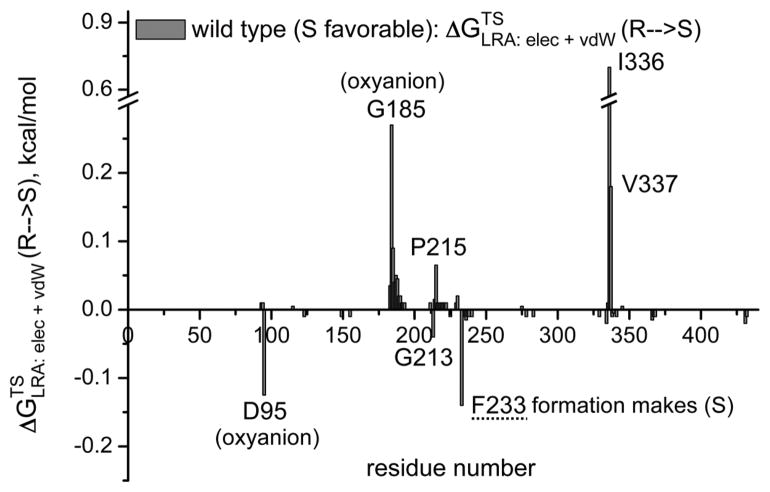
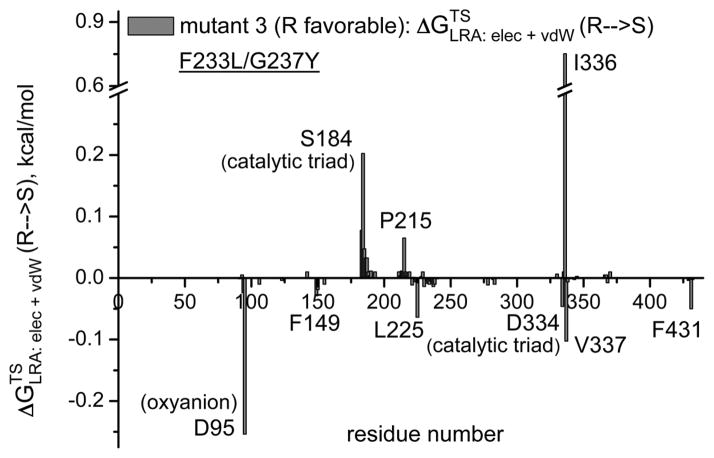
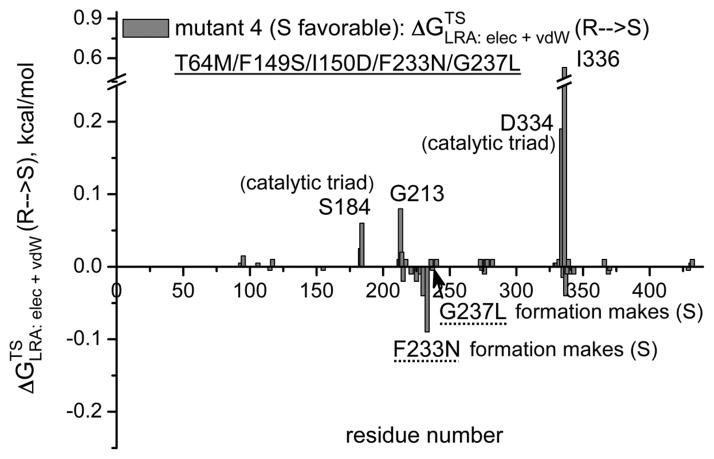
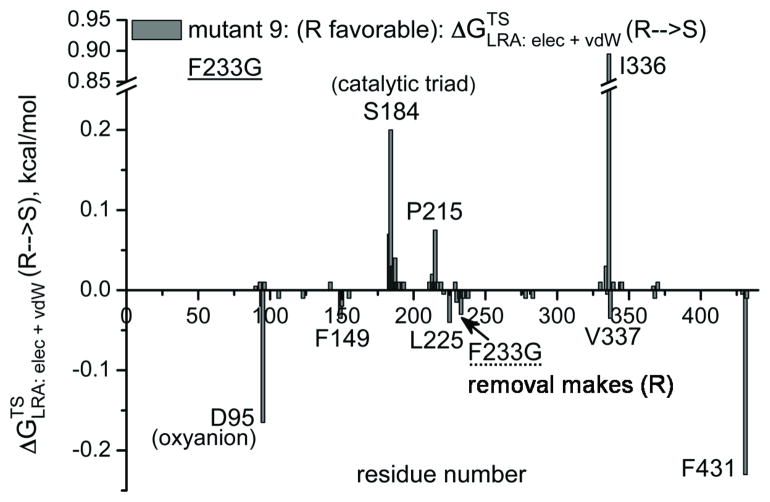
The first obvious screening strategy is to use the electrostatic group contribution approach [35, 36] or the more rigorous LRA/β approach of Eq. (11). Here we evaluate the LRA/β group contributions of each residue to the free energy that correspond to E (Figure 7). Some typical results are depicted in Figure 7, where prospective contribution indicates that generating the given residue from a non-polar residue and in some respect from smaller residue will stabilize the R TS. The figure gives relatively encouraging message. That is, in the wt we see a negative peak for F233, this means that formation of F stabilizes the S TS and its removal stabilizes the R TS. This is consistent with the fact that the F233G has E(R). Similarly we see in mutant 4 a negative peak F233N, which is consistent with the fact that this mutant is S and with our prediction that the single mutant F233N has E′ (S) which is larger than the G233F effect (although this prediction should be explored experimentally). It should be noted the actual E values are frequently determined by indirect electrostatic effect, where steric interactions prevent one stereoisomer from reaching the same optimal electrostatic preorganization as the other. Thus although the LRA/β of Eq. (11) reflects direct steric effects it is not clear how effective this approach can be when the steric effect is indirect. This issue has to be explored by direct comparison to experimental studies of single mutations.
Figure 7.
The LRA/β group contributions for transferring the TS from R to S for the wild type CALA (a) and for mutants 3 (b), 4 (c) and 9 (d). The contribution is negative when the creation of the given residue from Gly stabilized the S TS and positive when the creation of the given residue stabilizes the R TS. Thus, for example, the finding that the group contribution for F233 in the wt is negative means that the LRA predicts that forming the F from G stabilized the S TS form. Now this is consistent with the fact that the F233G stabilized the R TS. The LRA contributions for other mutants are also given in the figure.
Considering the current uncertainties in using the LRA/β approach for selectivity screening, it may be unavoidable to use massive EVB/FEP analysis (probably with the approach of Eq. 5). The current performance of the brute force approach is reported in Table 4. The point of this table that even with the brut force approach we can screen significant number of mutation candidates in a few days and make reasonable suggestion for further experimental studies. Furthermore, we can save time in mutating the enzyme by using a simplified (coarse grained (CG)) model as a reference state. [37] Using CG model we can simultaneously mutates one simplified residue to many explicit residues and explores the effect on E. See related example in ref [37].
Table 4.
The performance of the EVB, the TS binding and PDLD/S binding free energy calculations. [a]
| computer time per mutant (runs, processor) | No. of mutants per 24h per 200 processors | No. of mutants per 24h per 1000 processors | ||
|---|---|---|---|---|
| using EVB [b] | 16.5 h (1, 1) | 29[c] | 146[c] | |
| using FEP | 8 h (1, 1) | 150[d] | 750[d] | |
|
|
2.5 h (1, 1) | 480 [d] | 2400 [d] |
The calculations were conducted on the University of Southern California HPCC (High Performance Computing and Communication) Linux computer, using Dual Intel Xeon(64-bit) 3.2 GHz 2GB Memory nodes.
The total computational time of the two reaction steps (the proton transfer and the nucleophilic attack).
Average over ten runs per mutant.
Average over four runs per mutant.
Concluding Remarks
Optimizing enzymes to catalyze selective enantioselective reactions has a major potential in biotechnology, including in the generation of biocatalyst for efficient synthesis of enantiomerically pure chiral molecules for the production of drugs by the pharmaceutical industry.
The recent advances in this field have been due in part to directed evolution experiments with some qualitative insight from theoretical studies (see Introduction). It seems to us that at the present stage it is important to push the capacity of theoretical simulation as useful tool in designing enantioselectivity enzymes. This paper addresses the corresponding challenge of providing predictive calculations despite the fact that we are dealing rather with small differences in activation barriers.
We start by demonstrating that the EVB provides a powerful tool for effective sampling and free energy calculations in the landscape that reproduce a difference between the activation barrier of the R and S enantiomers in CALA.
We also explored our ability to tackle the challenging task of evaluation the total enantioselectivity (E) of the wt and different mutants of CALA. The corresponding calculations involve mutations of R to S at the TS in the active site of CALA and its mutants. Our study indicates that a converging prediction of enantioselectivity is a major challenge (since a major sampling is needed to obtain converging results). This does not mean that simple energy minimization, and even just inspection, cannot give powerful guide for getting effective mutations. However, approaches that do not involve extensive sampling are unlikely to give stable results, just because of the fact that starting from different initial configurations gives different results. Overall, it seems that the most rigorous approach is the one where we calculate E by mutating the R to S at the TS. However, it is not yet clear if this approach leads to the fastest convergence.
Our finding that only an extensive sampling can provide the correct estimate of the enantioselectivity has some general implications. That is, it is sometime assumed that it is sufficient to start with some reasonable binding model and to just evaluate the energy (or average energy) near the generated structure. However, our finding indicates that the results (regardless if the interactions are evaluated by QM/MM or classical model) would be different with different starting points and thus it is essential to use extensive and consistent conformational sampling. Therefore it is at least recommended to examine the stability of the calculated results to changes in the initial structure.
In addition to demonstrating our ability to obtain reasonable results for the observed enantioselectivity, we also explored several options for predictive studies. It appears that a pure LRA/β screening does have some potential but it would require careful validation. Now, since the EVB is able to capture mutational effects we might be forced to rely on extensive simulations that will use a CG model as a basis for perturbation to different possible mutants. However, with the EVB we clearly have a tool that allows us to reproduce the observe E and to determine its origin (including case when it is due to entropic effects). This should be useful in analyzing the origin of the effect of directed evolution.
An interesting strategies for refining enzyme stereoselectivity is provided by iterative refinement approaches, where one to exploit the knowledge of the effect of single mutants while assuming some additivity in the effect of several mutants. However, in many cases we do not expect additivity and this would make a simple predictive experimental refinement rather challenging. Here we believe that the ability to screen computationally for double mutants can be of significant importance.
Computational Methods
Empirical Valence Bond Simulations
The calculations of the activation free energies were performed by the empirical valence bond (EVB) method. This method that has been described extensively elsewhere [22, 38] is an empirical quantum mechanics/molecular mechanics (QM/MM) method that can be considered as a mixture of diabatic states describing the reactant(s), intermediate(s) and product(s) in a way that retains the correct change in structure and charge distribution along the reaction coordinate. The EVB diabatic states provide an effective way for evaluating the reaction free energy surface by using them for driving the system from the reactants to the product states in a free energy perturbation umbrella sampling procedure. The reason for the remarkable reliability of the EVB is that it is calibrated on the reference solution reaction and then the calculations in the enzyme active site reflect (consistently) only the change of the environment, exploiting the fact that the reacting system is the same in enzyme and solution. Thus, the EVB approach is calibrated only once in a study of a given type of enzymatic reaction.
The EVB for the present reaction has been constructed by using the three states described in Figure S3 (see SI). The EVB parameters for the surfaces of the solution reaction were calibrated by using the available experimental information about this reaction (see the Initial Analysis section for the detailed description). The calibrated parameters were kept unchanged for the generation of the protein EVB surface.
The EVB calculations were carried by MOLARIS simulation program using the ENZYMIX force field. [30, 31] The EVB activation barriers were calculated at the configurations selected by the same free energy perturbation umbrella sampling (FEP/US) approach used in all our studies (e.g., ref [22, 39]). The simulation systems were solvated by the surface constrained all atom solvent (SCAAS) model [31] using a water sphere of 18 Å radius centered on the substrate and surrounded by 2 Å grid of Langevin dipoles and then by a bulk solvent, while long-range electrostatic effects were treated by the local reaction field (LRF) method. [31] The EVB region includes the carbonyl group of the substrate and imidazole of the histidine and hydroxyl group of the serine. Validation studies were done within 22 Å radius of inner sphere, where we repeated the calculations of the activation barrier and obtained practically the same results (of course treating the distanced ionized groups with a high dielectric macroscopic model). The FEP mapping procedure involved the use of 21 frames (5 ps each) for moving along the reaction coordinate. All the simulations were done at 300 K with a time step of 1fs. The weak residue constraints of 0.5 kcal mol−1 Å2 were applied on the substrate, Asp95, His366 and Asp334 to keep the atoms near the corresponding observed positions. The simulations were repeated 10 times in order to obtain reliable results with different initial conditions (obtained from arbitrary points of the relaxation trajectory). Furthermore, the hysteresis in the calculation was examined by performing forward and backward simulations (which gave very similar results). The average was determining by taking in each case the difference between the calculated minimum at the reaction state (RS) and the given transition state (TS). This simulation protocol was applied to both reaction steps, the proton-transfer step and the nucleophilic attack.
Asp95, which forms a part of the oxyanion hole, was consider to be protonated based on its calculated and mutations experiments. [40] The relevant pKa calculations were performed using the MOLARIS package. [41]
The Van der Waals parameters of the hydroxyl oxygen of Ser184 with protein or water molecules were fine tuned based on the calculation of the solvation free energy ( , which is comparable to the corresponding observed value [42]), see the EVB parameters in the Table S1 and S2 (see SI).
Direct Calculations of E
Although the initial focus in this work has been on the contribution of kcat to the enantioselectivity (namely E′), we also explored our ability to evaluate E. Here it is useful to exploit that fact that the selectivity reflects simply the difference between the TS binding energies of the R and S enantiomers. Thus we can use the thermodynamic cycle of Figure 5 and obtain:
| (5) |
In using this expression it is enough to mutate the R to S at the TS in the protein and then just to subtract the corresponding results for the mutation in water (which can be different than zero due to force field artifacts). The approach of mutating TS has already been used in our early mutational studies, [34] but at that time we mutate the protein, while here we mutate the substrate. The actual mutation is conveniently done by labeling the atoms that distinguish R from S as atoms that can be either real or dummy atoms (see Figure 5), and simply mutating the dummy atoms in R to full atoms in S and the full atoms in R to dummy atoms in S. The FEP mapping procedure involved the use of 31 frames (2 ps each) for moving along the reaction coordinate from the real TS to the TS with dummy atoms. All the simulations were done at 300 K with a time step of 1fs. The TS structure was taken from the corresponding EVB calculations and was further relaxed for additional 100 ps for each studied system. The weak residue constraints of 0.5 kcal mol−1 Å2 were applied on the substrate, Asp95, His366 and Asp334 to keep the atoms near the corresponding observed positions. The simulations averaged over runs from 4 different initial conditions, in order to obtain reliable results with different initial conditions (obtained from arbitrary points of the TS relaxation trajectory). In order to avoid the end point catastrophe in mutating to dummy atoms we found it is convenient to delete the first and last frame, while exploring the convergence with larger number of frames.
Linear Response Approximation/β (LRA/β) Calculations of Group Contributions
An integral part of our studies of enzyme design is the ability to evaluate the electrostatic contributions of different residues to the free energy of the reactant (RS), transition state (TS) and product state (PS). Arguably the most effective ways of obtaining such contributions is the use of the linear response approximation (LRA) approach. [43] This method provides not only a good estimate for the free energy associated with the change between two potential surfaces, [43] but also offers the unique ability to decompose total free energies to their individual contributions. [44, 45] That is, using the LRA we can express the free energy associated with changing the electrostatic potential of the system from Uelect,A to Uelect,B:
| (6) |
where 〈 〉α designates a molecular dynamics (MD) average over trajectories obtained with U = Uα. Accordingly, we can write:
| (7) |
where is the electrostatic contribution for the interaction between the ligand and its surroundings, p and w designate protein and water, respectively, and ℓ and ℓ′ designate the ligand in its actual charged form and the “non-polar” ligand, where all of the residual charges are set to 0. In this expression, the term 〈Uelec,l − Uelec,l′〉, which is required by the LRA treatment, is replaced by Uelec,ℓ since Uelec,ℓ′ = 0. Now, the above expression can be used in evaluating the LRA contribution of the ith residue of the protein by:
| (8) |
It is important to note that in contrast to the effectiveness of the LRA in studies of the absolute catalytic effect (which is directly controlled by the electrostatic preorganization), the actual E and E′ values are frequently determined by indirect electrostatic effect, where steric interactions prevent one stereoisomer from reaching the same optimal electrostatic preorganization as the other. Thus it is important to try to capture steric effect in a simplified way, which is not more expensive than the LRA treatment. Here we can apply our LRA/β approach, [29] which is a combination of our electrostatic LRA method and Aqvsit’s LIE steric (nonelectrostatic) term. [46] That is we express the total binding free energy as
| (9) |
where the factor 0.5 can be slightly modify, while β is an empirical parameter that scales the vdW component of the protein-ligand interaction. In our calculations the scaling parameter β equals to 1.0. A careful analysis of the relationship between the LRA and LIE approaches and the origin of the β parameters is given in ref [46]. This analysis shows that β can be evaluated in a deterministic way provided that one can determine the entropic contribution and preferably, the water penetration effect microscopically.
At any rate, we can write (see also ref [46])
| (10) |
This leads to
| (11) |
Thus we can write
| (12) |
Here again we can evaluate the group contributions to E(R) in analogy with Eq. 8.
Acknowledgments
We thank Prof. Jan-Erling Bäckvall and Prof. Karl Hult for stimulating discussion. We also thank Dr. Jie Cao for her initial studies on CALB. This work was supported by Grant GM024492 from the National Institutes of Health (NIH). We thank the University of Southern California’s High Performance Computing and Communication Center (HPCC) for computer time.
Abbreviations
- CALA
Candida antarctica lipase A
- EVB
empirical valence bond
- MO-QM/MM
molecular orbital-combined quantum mechanical/molecular mechanics
- DFT
density functional theory
- NAC
near attack conformation
- wt
wild type
- PT
proton transfer
- NA
nucleophilic attack
- RS
reactant state
- TS
transition state
- PS
product state
- FEP/US
free energy perturbation umbrella sampling
- SCAAS
surface constrained all atom solvent
- LRF
local reaction field
- LRA
linear response approximation
- CG
coarse grained
References
- 1.Beck G. Synlett. 2002;6:837–850. [Google Scholar]
- 2.Breuer M, Ditrich K, Habicher T, Hauer B, Kesseler M, Sturmer R, Zelinski T. Angew Chem. 2004;116:806–843. doi: 10.1002/anie.200300599. [DOI] [PubMed] [Google Scholar]; Angew Chem, Int Ed. 2004;43:788–824. doi: 10.1002/anie.200300599. [DOI] [PubMed] [Google Scholar]
- 3.Engstrom K, Nyhlen J, Sandstrom AG, Backvall JE. J Am Chem Soc. 2010;132:7038–7042. doi: 10.1021/ja100593j. [DOI] [PubMed] [Google Scholar]
- 4.Prasad S, Bocola M, Reetz MT. Chemphyschem. 2011;12:1550–1557. doi: 10.1002/cphc.201100031. [DOI] [PubMed] [Google Scholar]
- 5.Reetz MT, Prasad S, Carballeira JD, Gumulya Y, Bocola M. J Am Chem Soc. 2010;132:9144–9152. doi: 10.1021/ja1030479. [DOI] [PubMed] [Google Scholar]
- 6.Magnusson AO, Rotticci-Mulder JC, Santagostino A, Hult K. Chembiochem. 2005;6:1051–1056. doi: 10.1002/cbic.200400410. [DOI] [PubMed] [Google Scholar]
- 7.Magnusson AO, Takwa M, Harnberg A, Hult K. Angew Chem. 2005;117:4658–4661. doi: 10.1002/anie.200500971. [DOI] [PubMed] [Google Scholar]; Angew Chem, Int Ed. 2005;44:4582–4585. doi: 10.1002/anie.200500971. [DOI] [PubMed] [Google Scholar]
- 8.Martinelle M, Hult K. Biochim Biophys Acta, Protein Struct Mol Enz. 1995;1251:191–197. doi: 10.1016/0167-4838(95)00096-d. [DOI] [PubMed] [Google Scholar]
- 9.Ottosson J, Fransson L, Hult K. Protein Sci. 2002;11:1462–1471. doi: 10.1110/ps.3480102. [DOI] [PMC free article] [PubMed] [Google Scholar]
- 10.Rotticci D, Haeffner F, Orrenius C, Norin T, Hult K. J Mol Catal B: Enzym. 1998;5:267–272. [Google Scholar]
- 11.Sandstrom AG, Engstrom K, Nyhlen J, Kasrayan A, Backvall JE. Protein Eng, Des Sel. 2009;22:413–420. doi: 10.1093/protein/gzp019. [DOI] [PubMed] [Google Scholar]
- 12.Orrenius C, Haeffner F, Rotticci D, Ohrner N, Norin T, Hult K. Biocatal Biotransform. 1998;16:1–15. [Google Scholar]
- 13.Leonard V, Fransson L, Lamare S, Hult K, Graber M. Chembiochem. 2007;8:662–667. doi: 10.1002/cbic.200600479. [DOI] [PubMed] [Google Scholar]
- 14.Nyhlen J, Martin-Matute B, Sandstrom AG, Bocola M, Backvall JE. Chembiochem. 2008;9:1968–1974. doi: 10.1002/cbic.200800036. [DOI] [PubMed] [Google Scholar]
- 15.Raza S, Fransson L, Hult K. Protein Sci. 2001;10:329–338. doi: 10.1110/ps.33901. [DOI] [PMC free article] [PubMed] [Google Scholar]
- 16.Svedendahl M, Carlqvist P, Branneby C, Allner O, Frise A, Hult K, Berglund P, Brinck T. Chembiochem. 2008;9:2443–2451. doi: 10.1002/cbic.200800318. [DOI] [PubMed] [Google Scholar]
- 17.Hopmann KH, Hallberg BM, Himo F. J Am Chem Soc. 2005;127:14339–14347. doi: 10.1021/ja050940p. [DOI] [PubMed] [Google Scholar]
- 18.Bocola M, Otte N, Jaeger KE, Reetz MT, Thiel W. Chembiochem. 2004;5:214–223. doi: 10.1002/cbic.200300731. [DOI] [PubMed] [Google Scholar]
- 19.Prokop Z, Sato Y, Brezovsky J, Mozga T, Chaloupkova R, Koudelakova T, Jerabek P, Stepankova V, Natsume R, van Leeuwen JG, Janssen DB, Florian J, Nagata Y, Senda T, Damborsky J. Angew Chem. 2010;122:6247–6251. doi: 10.1002/anie.201001753. [DOI] [PubMed] [Google Scholar]; Angew Chem, Int Ed. 2010;49:6111–6115. doi: 10.1002/anie.201001753. [DOI] [PubMed] [Google Scholar]
- 20.Warshel A, Narayszabo G, Sussman F, Hwang JK. Biochemistry. 1989;28:3629–3637. doi: 10.1021/bi00435a001. [DOI] [PubMed] [Google Scholar]
- 21.Warshel A, Russell S. J Am Chem Soc. 1986;108:6569–6579. [Google Scholar]
- 22.Warshel A. Computer Modeling of Chemical Reactions in Enzymes and Solutions. Wiley Interscience; New York: 1991. [Google Scholar]
- 23.Creighton S, Hwang JK, Warshel A, Parson WW, Norris J. Biochemistry. 1988;27:774–781. [Google Scholar]
- 24.Ishikita H, Warshel A. Angew Chem. 2008;120:709–712. doi: 10.1002/anie.200704178. [DOI] [PubMed] [Google Scholar]; Angew Chem, Int Ed. 2008;47:697–700. doi: 10.1002/anie.200704178. [DOI] [PubMed] [Google Scholar]
- 25.Jencks WP, Gilchrist M. J Am Chem Soc. 1962;84:2910–2913. [Google Scholar]
- 26.Štrajbl M, Florián J, Warshel A. J Am Chem Soc. 2000;122:5354–5366. [Google Scholar]
- 27.Ericsson DJ, Kasrayan A, Johanssonl P, Bergfors T, Sandstrom AG, Backvall JE, Mowbray SL. J Mol Biol. 2008;376:109–119. doi: 10.1016/j.jmb.2007.10.079. [DOI] [PubMed] [Google Scholar]
- 28.Morris GM, Goodsell DS, Halliday RS, Huey R, Hart WE, Belew RK, Olson AJ. J Comput Chem. 1998;19:1639–1662. [Google Scholar]
- 29.Singh N, Warshel A. Proteins: Struct, Funct, Bioinf. 2010;78:1705–1723. doi: 10.1002/prot.22687. [DOI] [PMC free article] [PubMed] [Google Scholar]
- 30.Chu ZT, Villa J, Strajbl M, Schutz CN, Shurki A, Warshel A. MOLARIS, Revision 9.06. University of Southern California; Los Angeles, CA, USA: 2006. [Google Scholar]
- 31.Lee FS, Chu ZT, Warshel A. J Comput Chem. 1993;14:161–185. [Google Scholar]
- 32.Frisch MJ, Trucks GW, Schlegel HB, Scuseria GE, Robb MA, Cheeseman JR, Montgomery JA, Vreven JT, Kudin KN, Burant JC, Millam JM, Iyengar SS, Tomasi J, Barone BMV, Cossi M, Scalmani G, Rega N, Petersson HNGA, Hada M, Ehara M, Toyota K, Fukuda JHR, Ishida M, Nakajima T, Honda Y, Kitao O, Nakai MKH, Li X, Knox JE, Hratchian HP, Cross JB, Adamo JJC, Gomperts R, Stratmann RE, Yazyev O, Austin RCAJ, Pomelli C, Ochterski JW, Ayala PY, Morokuma GAVK, Salvador P, Dannenberg JJ, Zakrzewski SDVG, Daniels AD, Strain MC, Farkas DKMO, Rabuck AD, Raghavachari K, Foresman JVOJB, Cui Q, Baboul AG, Clifford S, Cioslowski BBSJ, Liu G, Liashenko A, Piskorz P, Komaromi RLMI, Fox DJ, Keith T, Al-Laham MA, Peng ANCY, Challacombe M, Gill PMW, Johnson WCB, Wong MW, Gonzalez C, Pople JA. Gaussian 03, Revision C.03. Gaussian, Inc; Wallingford, CT, USA: 2004. [Google Scholar]
- 33.DeLano WL. The PyMOL Molecular Graphics, Revision 1.2r3pre. DeLano Scientific; San Carlos, CA, USA: 2002. [Google Scholar]
- 34.Hwang JK, Warshel A. Biochemistry. 1987;26:2669–2673. doi: 10.1021/bi00384a003. [DOI] [PubMed] [Google Scholar]
- 35.Muegge I, Schweins T, Warshel A. Proteins: Struct, Funct, Genet. 1998;30:407–423. doi: 10.1002/(sici)1097-0134(19980301)30:4<407::aid-prot8>3.0.co;2-f. [DOI] [PubMed] [Google Scholar]
- 36.Muegge I, Tao H, Warshel A. Protein Eng. 1997;10:1363–1372. doi: 10.1093/protein/10.12.1363. [DOI] [PubMed] [Google Scholar]
- 37.Messer BM, Roca M, Chu ZT, Vicatos S, Kilshtain AV, Warshel A. Proteins: Struct, Funct, Bioinf. 2010;78:1212–1227. doi: 10.1002/prot.22640. [DOI] [PMC free article] [PubMed] [Google Scholar]
- 38.Aqvist J, Warshel A. Chem Rev. 1993;93:2523–2544. [Google Scholar]
- 39.Warshel A, Sharma PK, Kato M, Xiang Y, Liu H, Olsson MH. Chem Rev. 2006;106:3210–3235. doi: 10.1021/cr0503106. [DOI] [PubMed] [Google Scholar]
- 40.Sandstrom AG. PhD thesis. Stockholm University; Sweden: 2010. [Google Scholar]
- 41.Sham YY, Chu ZT, Warshel A. J Phys Chem B. 1997;101:4458–4472. [Google Scholar]
- 42.Warshel A, Aqvist J, Creighton S. Proc Natl Acad Sci U S A. 1989;86:5820–5824. doi: 10.1073/pnas.86.15.5820. [DOI] [PMC free article] [PubMed] [Google Scholar]
- 43.Lee FS, Chu ZT, Bolger MB, Warshel A. Protein Eng. 1992;5:215–228. doi: 10.1093/protein/5.3.215. [DOI] [PubMed] [Google Scholar]
- 44.Florian J, Goodman MF, Warshel A. J Phys Chem B. 2002;106:5739–5753. [Google Scholar]
- 45.Shurki A, Warshel A. Proteins: Struct, Funct, Bioinf. 2004;55:1–10. doi: 10.1002/prot.20004. [DOI] [PubMed] [Google Scholar]
- 46.Sham YY, Chu ZT, Tao H, Warshel A. Proteins: Struct Funct Genet. 2000;39:393–407. [PubMed] [Google Scholar]


