
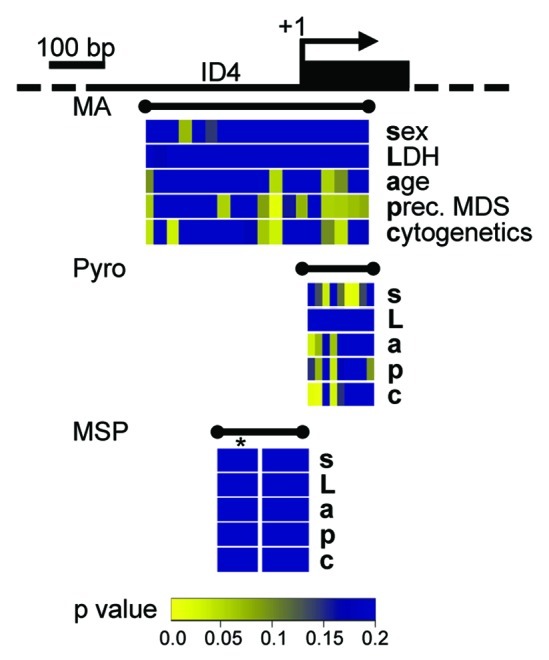
Figure 4. Quantitative DNA methylation data of the ID4 5′ region reveal correlations with AML disease characteristics. Graphical display of the ID4 gene 5′ region and all raw non-parametric p-values for single the factors sex (s), LDH (L), age (a), presence of a preceding MDS (p) and cytogenetic risk group (c) as derived from univariate testing. Correlations were performed on single CpG units of MassARRAY-derived methylation data as well as for single CpG methylation values by pyrosequencing (Pyro). P-values are displayed in spatial relation to the transcriptional start site (+1). For correlations with MSP-derived DNA methylation status, MSP data were treated either as binary variable (U/M) or using a separation in three methylation states (U/W/M, indicated by *). Color-coding displays low raw p values (significant low p values are depicted in yellow colors; higher p values are represented in a green-blue transition). All p values > 0.2 are displayed in blue.