Abstract
We illustrate expected electroporation (EP) responses to two classes of large electric field pulses by employing systems models, one of a cell in vitro and the other of multiple cells in vivo. The first pulse class involves “nsPEF” (nanosecond pulsed electric fields). The durations are less than a microsecond, but the magnitudes are extremely large, often 10 kV/cm or more, and all of the pores remain small. The second class involves “IRE” (irreversible electroporation). Durations are many microseconds to several milliseconds, but with magnitudes smaller than 10 kV/cm, and a wide range of pore sizes evolves. A key feature of both pulse classes is non-thermal cell killing by multiple pulses without delivering external drugs or genes. For small pulses the models respond passively (no pore creation) providing negative controls. For larger pulses transient aqueous pore populations evolve. These greatly increase local membrane conductance temporarily, causing rapid redistribution of fields near and within cells. This complex electrical behavior is generally not revealed by experiments reporting biological end points resulting from cumulative ionic and molecular transport through cell membranes. The underlying, heterogeneous pore population distributions are also not obtained from typical experiments. Further, traditional EP applications involving molecular delivery are usually assumed to create pores solely in the outer, plasma membrane (PM). In contrast, our examples support the occurrence of intracellular EP by both nsPEF and IRE, but with different intracellular spatial distributions of EP sites.
I. INTRODUCTION
Large magnitude, short duration electric field pulses are known to cause non-thermal biological effects. In addition to widely used conventional EP for drug and gene delivery (typical pulse durations of 0.1 to 100 ms; corresponding magnitudes of 1 down to 0.1 kV/cm), nsPEF (nanosecond pulsed electric fields) and IRE (irreversible electroporation) have emerged within the past decade, motivated primarily by potential clinical applications.
A. nsPEF (nanosecond pulsed electric fields) causing supra-EP. An initial publication generated considerable interest [1], demonstrating the possibility of non-thermal intra-cellular field effects. Within a year another paper showed that nsPEF pulses killed cells in tissue slices by apoptosis [2]. An example of many subsequent experiments showed significant cell killing and effective tumor treatment with a variety of multiple pulses with durations less than 20 ns. Also, in vivo studies with mice and the treatment of one human subject (basal cell carcinoma) [3] have been reported. Still more recent experiments for skin cancer reported that 100 ns, 30 kV/cm, 2,000 pulses were optimal in a mouse model [4].
B. IRE (irreversible electroporation). Interest in IRE appeared somewhat later. An early paper pointed to the prospects for IRE, giving an example of pulses of 300 μs duration, 1.5 kV/cm, 30 pulses total [5]. Another early paper described IRE using somewhat different pulsing conditions, viz. 100 μs duration, but 680 V/cm and a total of 8 pulses [6]. A subsequent example of IRE used pulses with 100 μs duration, 2.5 kV/cm magnitude and 80 pulses total [7]. A more recent paper [8] describes the use of a nominal, heterogeneous field (applied voltage divided by non-parallel plate electrode separation) of approximately En = 1.5 kV/cm, again with 80 pulses (rate of 90/min) of duration 100 μs.
Overall these drug-free, multiple pulse results are impressive. Significantly, nsPEF generally leads to cell killing by apoptosis, while IRE causes death by necrosis. But what are the mechanisms that lead to non-thermal cell killing? Candidate mechanisms for triggering necrosis in one case and apoptosis in the other case have been discussed, [9]–[11] but are not conclusively answered.
Cell death is not an inherent outcome of cell EP. Yet the mechanism(s) of non-thermal cell death remain unknown. Understanding the spatial distribution of electroporation regions within a cell should contribute to addressing this basic issue.
II. METHODS
Both cell-level models have local models with passive dielectric and conductive properties for aqueous regions (cell compartments bounded by membranes). Due to computational limitations a local active membrane electroporation model was used together with resting potential source models and dynamic EP models for the plasma membrane (PM) and mitochondrial outer membrane (MOM), but the simpler asymptotic EP model for all other membranes [9]–[11].
Pulse waveforms for nsPEF and IRE. For the nsPEF example we used an experimental pulse waveform [4]. The IRE pulse example is an idealized trapezoidal waveform.
III. RESULTS AND DISCUSSION
Previous publications describe important aspects of the behavior of the EP local models, assigned to the two systems models [9]–[11].
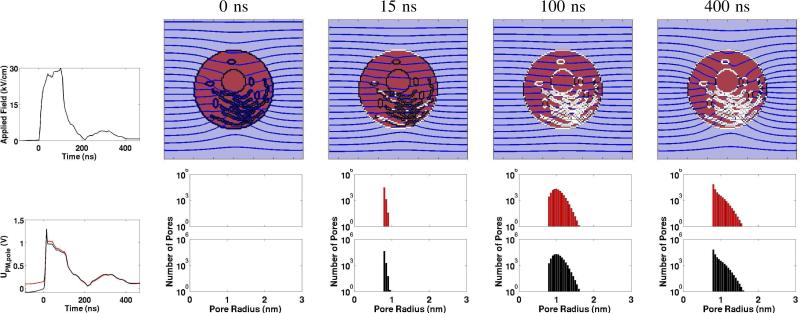
Examples of the single cell model responses to a nsPEF pulse are shown in Fig. 2. Illustrative spatially distributed electrical and EP responses are shown at times 0, 15, 100 and 400 ns.
Fig. 2.
nsPEF example [4] with the digitized experimental pulse waveform and model responses. Upper left: Experimental pulse waveform (nominal 100 ns duration, because the small ragged tail is relatively unimportant to the highly non-linear EP response). Lower left: Transmembrane voltage, Um(t) for the anodic (RED) and cathodic (BLACK) poles of the circular cell. The spike following rapid charging is due to a burst of conducting small pores. Upper row of four panels: Spatial distributions of EP sites (WHITE regions; >1013 pores/m2) and equipotentials (black lines/curves; equipotentials of each panel are scaled separately). The top of the system box is an idealized anode (zero electrochemical overvoltage) and the bottom is an idealized cathode, so that the applied field is uniform in the absence of the cell. Lower row of four top/bottom panel pairs: RED PM pore population histograms (bin width 0.05 nm) for the upper (anodic) side of the cell, with BLACK histograms for the lower (cathodic) side. Note the semi-logarithmic scale, showing most pores are small (in the rightmost panel, the peak at the minimum pore size rp ≈ 0.8 nm, and falling off rapidly to one at rp ≈ 1.6 nm for both RED and BLACK distributions).
At our choice for t = 0 ns there is a small applied field (0.18 kV/cm), but with insufficient magnitude and time to create pores (no WHITE regions). Due to the rapid rise time and resulting displacement currents there is a smaller but significant intracellular electric field (more widely spaced intracellular irregular equipotential curves). In contrast the t = 15 ns case shows that porated regions are established at a few intracellular sites, mainly parts of the ER but even one site at a mitochondrion (left, center intracellular site). Further, unlike larger magnitude, even shorter duration nsPEF pulses used in other experiments, the equipotentials are not completely parallel. At t = 100 ns intracellular EP has taken place at all organelles of the model. The ER and nuclear membranes have extensive porated regions, as do the mitochondria. Again, however, the equipotentials are not fully parallel, indicating that supra-EP has not yet reached a maximum. Finally, at t = 400 ns the applied field is only a few kV/cm and the curvature of the equipotentials has increased, indicating slightly decreased PM conductance even though the porated regions are the same (WHITE sites).
The temporal response is consistent with the assumed mean pore lifetime of 3 ms that is typical of pure lipid bilayer membranes. If a significantly longer pore lifetime were used the results would be mostly unchanged.
In Fig. 2 the four pairs of pore population distributions (histograms) show the total number of pores in the PM. The histograms have a bin width of 0.05 nm with a minimum size pore of 0.8 nm. At t = 0 there are no histograms (zero pores) for this pre-EP situation. The PM has not yet charged to a transmembrane voltage value associated with a significant pore creation rate. This is a negative control for both the nsPEF and IRE pulses.
At t = 15 ns the population distribution has a peak value of ~ 105 pores at or near the minimum size for both the anodic (RED; anode-facing) and cathodic (BLACK; cathode-facing) cell side. At t = 100 ns pores have clearly expanded, but remain small (a few reach ~ 1.6 nm) but most have radii of ~ 1 nm. Finally, and at t = 400 ns some pore contraction has occurred such that the distribution has begun its collapse towards a thermalized distribution with a peak in the smallest (0.8 nm) histogram bin.
Even with a resting potential source that generates a 90 mV transmembrane voltage before EP the pore populations exhibit only slight asymmetry.
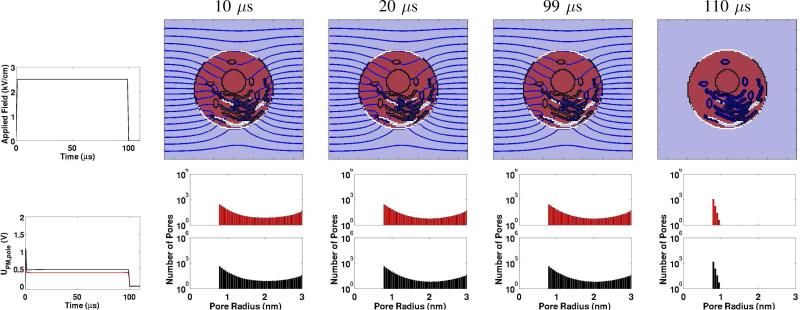
Fig. 3 shows illustrative responses of the same cell model to an IRE pulse with 100 μs duration and magnitude 2.5 kV/cm. At t = 10 μs Um(t) there are many pores, almost entirely in the PM, but also at some ER sites. At t = 20 μs the distribution of porated sites has changed only slightly. At t = 99 μs Um is at the end of the pulse maximum (plateau), and distribution of WHITE sites again changed only slightly. Finally, by t = 110 μs the field pulse has stopped and Um has rapidly decreased to zero by pores shunting the resting potential sources. On this time scale only a few pores have vanished, but the pore size distribution has shrunk to an approximate equilibrium distribution.
Fig. 3.
IRE example [7] with the pulse waveform and model responses. Upper left: IRE pulse trapezoidal waveform (100 μs nominal duration, 98 μs peak (plateau) duration, 2.5 kV/cm pulse with 1 μs rise and fall times). Lower left: Transmembrane voltage, Um(t) for the anodic (RED) and cathodic (BLACK) poles of the circular cell. The spike following the rapid charging is due to a burst of conducting small pores that occurs during the rising phase of the pulse. Upper row of four panels: Spatial distributions of EP sites (WHITE regions; >1013 pores/m2) and equipotentials (black lines/curves). EP is seen in much of PM and some regions of ER. The nuclear and mitochondrial membranes are not electroporated. Lower row of four top/bottom panel pairs: RED PM pore population histograms for the upper (anodic) side of the cell, with BLACK histograms for the cathodic side. Here, the PM pores are larger (some as large as 3 nm), but are fewer in number compared to the nsPEF case of Fig. 2. A maximum radius (reflecting boundary) of 3 nm was imposed.
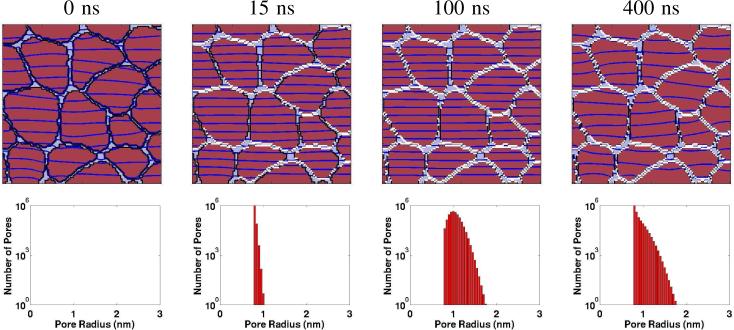
Fig. 4 shows the same time points as Fig. 2. The multicellular model contains only the cells’ outer (plasma) membrane. A significant feature of nsPEF is that supra-EP occurs, creating pores in almost all cell membranes. The PMs of the irregularly shaped cells are WHITE, indicating pores. Further, the electric field penetrates all of the cells to the degree that the field is essentially uniform (the equipotentials are essentially parallel). But at t = 400 ns (about 300 ns after the end of the primary pulse peak) the equipotentials become sightly irregular, indicating that because the field is significantly smaller the pore distribution no longer has sufficient conductance to create a spatially uniform field. However, the WHITE distribution appears about the same as at t = 100 ns, so while pore conductance decreases the number of pores remains about the same.
Fig. 4.
The multicellular model response to the nsPEF pulse [4] should be compared to Fig. 2 top left. Upper row of four panels: Spatial distribution of EP sites (WHITE regions; >1013 pores/m2) and equipotential curves/lines (DARK BLUE). At the time designated t = 0 ns there is a small applied field (0.18 kV/cm) but neither the transmembrane voltages nor the time is sufficient to create pores in the irregularly shaped plasma membranes (PMs). At t = 15 ns pores have been created at many membrane sites, particularly those membranes that are parallel to the equipotentials (perpendicular to the applied field pulse). In contrast there are some, but relatively few, at parts of the PMs that are nearly parallel to the field. The equipotentials are essentially parallel, so that within the in vivo environment (relatively little extra-cellular water) supra-electroporation is closer to being maximized. At t = 100 ns many of the previously unporated PM regions now have pores, and the equipotentials remain nearly parallel (almost uniform field within the system). Finally, at t = 400 ns when the field pulse is greatly diminished but not zero, the porated sites remain unchanged, but the equipotentials are no longer parallel. This is consistent with decreased PM conductance (individual pore conductance is a function of Um), due to partioning associated with the Born energy [10], [11]). Lower row of four top/bottom panel pairs: The plots show the histogram of all membrane pores in the systems model (here all PM pores). The membrane pores grow in size, but expand at most to about 1.8 nm radius, with the great majority having radii near 1 nm. Note that the left-most panel appropriately has zero pores.
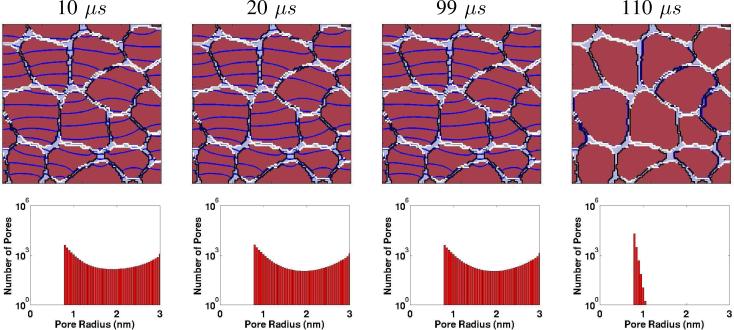
The pore population distributions represent all of the PM pores in this multicellular model. For the t = 10 μs case there is already a wide distribution of pore sizes, with a distribution that features more pores near both the minimum size (pore energy minimum; see supporting information of [9]), and also near the maximum pore size (3 nm).
Fig. 5 shows the same in vivo model for the IRE pulse for the same times as in Fig. 3. Unlike the nsPEF all of these examples have slightly irregular equipotentials, indicating that the electric field is never uniform. IRE does not create nearly the number of pores (and associated conductance) needed to smooth out the field spatial distribution. Nevertheless, to a good approximation all the cells have many pores.
Fig. 5.
Multicellular (in vivo) model response to the IRE pulse [7]. Upper row of four panels: Spatial distributions of EP sites (WHITE regions; >1013 pores/m2) and equipotentials (DARK BLUE lines/curves). EP is mostly confined to membrane regions perpendicular to the applied field pulse (parallel to the equipotentials). Throughout the equipotentials are not parallel, due to the spatial variation in PM conductance and spatially heterogeneous EP sites. Note that the right-most panel has no equipotentials, consistent with the zero applied field at t = 110 μs. Lower row of four top/bottom panel pairs: Here, the PM pores are significantly larger (some 3 nm), but are fewer in number compared to the nsPEF case. Also note that the right-most panel shows a significantly contracted pore population. The pores have not disappeared 10 μs after the pulse ceases, but have shrunk in size to yield a thermalized (broadened) size distribution with a peak at 0.8 nm (cf. Fig. 4 at 15 ns).
In addition to markedly different spatial distributions of porated sites, the pore population size distributions are also quite different. Generally nsPEF causes supra-EP, which involves only small pores that can allow transport of small ions and molecules (solutes). Calcium is a candidate small ion for being involved in apoptosis. In contrast, many larger molecules can be transported through the PM (and any participating organelle membranes) by the IRE pulse, which generates much larger pores.
Our models are motivated by the goal of in silico screening of cell/pulse combinations, which should help interpretation of existing experiments and assist future applications development.
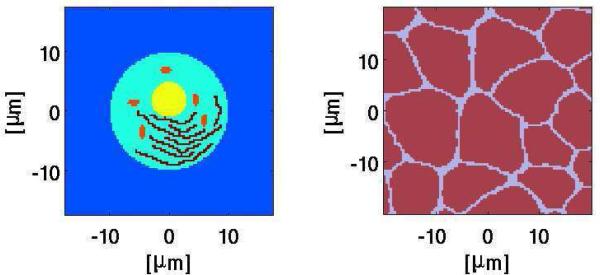
Fig. 1.
System model geometries. Left: Single cell with organelles; described elsewhere [9]. The long, inter-connected ”wiggly” black structures represent the endoplasmic reticulum (ER); the nucleus is the off-center yellow circular structure, and the five small elongated dark red structures are mitochondria. The nuclear envelope and mitochondrial membranes are double while the plasma and ER membrane are single, all with appropriate resting potential sources. Right: In vivo, multicellular with irregular shapes and sizes but no organelles; described elsewhere. [10], [11]. Papers with modeling details are all now accessible publicly [9]–[11].
Acknowledgments
Supported by NIH Grant RO1-GM63857
References
- 1.Schoenbach KH, Beebe SJ, Buescher ES. Intracellular effect of ultrashort pulses. Bioelectromagnetics. 2001;22:440–448. doi: 10.1002/bem.71. [DOI] [PubMed] [Google Scholar]
- 2.Beebe SJ, Fox PM, Rec LJ, Somers K, Stark RH, Schoenbach KH. Nanosecond pulsed electric field (nsPEF) effects on cells and tissues: apoptosis induction and tumor growth inhibition. IEEE Trans. Plasma Sci. 2002;30:286–292. [Google Scholar]
- 3.Garon EB, Sawcer D, Vernier PT, Tang T, Sun Y, Marcu L, Gundersen MA, Koeffler HP. In vitro and in vivo and a case report of intense nanosecond pulsed electric fields as a local therapy for human malignancies. Int. J. Cancer. 2007;121:675–682. doi: 10.1002/ijc.22723. [DOI] [PubMed] [Google Scholar]
- 4.Nuccitelli R, Tran K, Sheikh S, Athos B, Kreis M, Nuccitelli P. Optimized nanosecond pulsed electric field therapy can cause murine malignant melanomas to self-destruct with a single treatment. Int. J. Cancer. 2010;27:1727–1736. doi: 10.1002/ijc.25364. [DOI] [PMC free article] [PubMed] [Google Scholar]
- 5.Miller L, Leor J, Rubinsky B. Cancer cells ablation with irreversible electroporation. Technol. Cancer Res. Treat. 2005;4:699–705. doi: 10.1177/153303460500400615. [DOI] [PubMed] [Google Scholar]
- 6.Davalos RV, Mir LM, Rubinsky B. Tissue ablation and irreversible electroporation. Ann. Biomed. Eng. 2005;33:223–231. doi: 10.1007/s10439-005-8981-8. [DOI] [PubMed] [Google Scholar]
- 7.Al-Sakere B, André F, Bernat C, Connault E, Opolon P, Dvalos RV, Rubinsky B, Mir LM. Tumor ablation with irreversible electroporation. PloS ONE. 2007 Nov;:e1135. doi: 10.1371/journal.pone.0001135. [DOI] [PMC free article] [PubMed] [Google Scholar]
- 8.Neal RE, II, Rossmeisl JH, Jr, Garcia PA, Lanz OI, Henao-Guerrero N, Davalos RV. Successful treatment of a large soft tissue sarcoma with irreversible electroporation (epub ahead of print) J. Clin. Oncol. 2011;29 doi: 10.1200/JCO.2010.33.0902. [DOI] [PubMed] [Google Scholar]
- 9.Esser AT, Smith KC, Gowrishankar TR, Vasilkoski Z, Weaver JC. Mechanisms for the intracellular manipulation of organelles by conventional electroporation. Biophys. J. 2010;98:2506–2514. doi: 10.1016/j.bpj.2010.02.035. [DOI] [PMC free article] [PubMed] [Google Scholar]
- 10.Esser AT, Smith KC, Gowrishankar TR, Weaver JC. Towards solid tumor treatment by irreversible electroporation: Intrinsic redistribution of fields and currents in tissue. Tech. Cancer Res. Treat. 2007;6:261–273. doi: 10.1177/153303460700600402. [DOI] [PubMed] [Google Scholar]
- 11.Esser AT, Smith KC, Gowrishankar TR, Weaver JC. Towards solid tumor treatment by nanosecond pulsed electric fields. Tech. Cancer Res. Treat. 2009;8:289–306. doi: 10.1177/153303460900800406. [DOI] [PubMed] [Google Scholar]


