

Summary
Cerebral microbleeds (CMB) are increasingly recognized neuroimaging findings, occurring with cerebrovascular disease, dementia, and normal aging. Recent years have seen substantial progress, particularly in developing newer MRI methodologies for CMB detection and applying them to population-based elderly samples. This review focuses on these recent developments and their impact on two major questions: how CMB are detected, and how they should be interpreted. There is now ample evidence that prevalence and number of detected CMB varies with MRI characteristics such as pulse sequence, sequence parameters, spatial resolution, magnetic field strength, and post-processing, underlining the importance of MRI technique in interpreting studies. Recent investigations using sensitive techniques find the prevalence of CMB detected in community-dwelling elderly to be surprisingly high. We propose procedural guidelines for identifying CMB and suggest possible future approaches for elucidating the role of these common lesions as markers for, and potential contributors to, small vessel brain disease.
Introduction
Small foci of chronic blood products in normal (or near normal) brain tissue, designated here as cerebral microbleeds (CMB), have been an increasingly recognized entity since the widespread application in the early to mid 1990s of magnetic resonance imaging (MRI) techniques tailored to detect magnetic susceptibility.1,2 Recent years of investigation into CMB have seen several notable developments. Advances in MRI software and hardware have yielded striking improvements in sensitivity, leading to increased detection of CMB as well as evolution of the criteria used for their identification. A second area of rapid progress has been application of sensitive MRI imaging to the community-dwelling elderly population as a whole, where the prevalence of detected CMB appears to be as high as 11.1 to 23.5%.3,4 Population-based MRI analyses have also suggested intriguing connections between normal aging and asymptomatic stages of age-associated small vessel diseases such as hypertensive vasculopathy and cerebral amyloid angiopathy (CAA). Thus despite the appearance of several comprehensive reviews of CMB,5-9 these advances warrant a new assessment of emerging technical aspects of image acquisition, specific criteria for lesion identification, and recent data from population-based analysis.
Basis for review and identification of references
Material in this review reflects the consensus of a conference entitled “Cerebral Microbleeds: Detection and Definition” held by the Microbleed Study Group (see Acknowledgments for list of additional participants) on April 12, 2008 in Chicago, USA. This material was supported and supplemented by references identified by searches of PubMed from 1966 to October 2008 using the terms 1) “microbleed(s),” “microh(a)emorrhage(s),” or “petechial h(a)emorrhage(s)” or 2) “gradient-echo,” “T2*” or “susceptibility” in conjunction with “h(a)emorrhage(s).” References were also identified from the bibliography of identified articles and the authors’ files. Only papers in English or with available English translations of relevant data were considered. The final reference list includes papers judged by the authors to pertain to the specific topics addressed in this review.
CMB: How to Detect
The concept of CMB is primarily a radiological construct (i.e. describing small MRI signal voids), but one meant to represent a specific underlying microscopic pathology (i.e. perivascular collections of hemosiderin deposits, representing foci of past hemorrhage). The following section reviews advances in MRI methods for CMB detection, the criteria used to include or exclude MRI lesions as bona fide CMB, and what is known of the correlation between MRI and underlying histopathology.
MRI Parameters
The hemosiderin deposits that comprise CMB10 are superparamagnetic and thus have considerable internal magnetization when brought into the magnetic field of MRI, a property defined as magnetic susceptibility. Internal magnetization generates local inhomogeneity in the magnetic field surrounding the CMB, leading to faster decay of the local MRI signal, designated the susceptibility effect. On MRI sequences that are particularly sensitive to susceptibility effects, CMB will appear as black or hypointense lesions (signal voids).
The MRI parameters of greatest influence on CMB detection are pulse sequence, sequence parameters, spatial resolution, magnetic field strength, and post-processing. The potential effect of these factors on microbleed conspicuity and detection is discussed below. Limited experience applying various MRI parameters to population-based studies (Table 1)2-4,11-13 suggests that choice of methods has substantial impact on the measured prevalence of CMB.
Table 1.
Population-based studies of cerebral microbleeds
| Study | MRI parameters | Microbleeds | ||||||||
|---|---|---|---|---|---|---|---|---|---|---|
| Population | Year | Number of participants | Mean age (standard deviation) | Sequence | Field strength (Tesla) | TE (ms) | Section thickness (mm) | In-plane resolution (mm) | Prevalence (%) | Associated factors |
| Austrian Stroke Prevention Study2 | 1999 | 280 | 60 (6) | 2D T2*GRE | 1.5 | 16-20 | 5 (10% gap) | Not available | 6.4 | age, hypertension, systolic and diastolic blood pressure, lacunar infarcts, white matter lesions |
| Japanese study11 | 2002 | 450 | 53 (8) | 2D T2*GRE | 1.0 | 30 | 5 (2.5mm gap) | 0.9 × 1.1 | 3.1 | hypertension, heavy smoking |
| Japanese ‘brain docking’ study12 | 2003 | 209 | 56 (8) | 2D T2*GRE | 1.5 | 26 | 8 (no gap) | 0.9 × 1.2 | 7.7 | age, hypertension, headache |
| Framingham Study13 | 2004 | 472 | 64 (12) | 2D T2*GRE | 1.0 | 26 | 5 (10% gap) | Not available | 4.7 | age, male sex |
| AGES Reykjavik Study3 | 2008 | 1962 | 76 (6) | 2D T2*GRE-EPI | 1.5 | 50 | 3 (no gap) | 0.9 × 0.9 | 11.1 | age, male sex, APOEε4/ε4, retinal lesions, diabetes |
| Rotterdam Scan Study4 | 2008 | 1062 | 70 (7) | 3D T2*GRE | 1.5 | 31 | 1.6 (zero-padded to 0.8 mm; no gap) | 0.8 × 0.8 | 23.5 | age, systolic blood pressure, pulse pressure, smoking, low cholesterol, APOE ε4, lacunar infarcts, white matter lesions |
2D = 2-dimensional 3D = 3-dimensional GRE = gradient-recalled echo TE = echo time; APOE = apolipoprotein E genotype
Among available pulse sequences, T2*-weighted gradient-recalled echo (GRE) MRI lacking the 180° refocusing pulse characteristic of spin-echo (SE) or fast-spin echo techniques14 is highly sensitive to the susceptibility effect. T2*-weighted GRE sequences tailored to image susceptibility effects (the term T2*-weighted MRI is used below) are thus substantially more sensitive to CMB than T2-weighted SE sequences.2,15-17 The areas of low intensity that appear on T2*-weighted MRI are larger than the corresponding hemosiderin deposits, representing the so-called “blooming” effect (Fig. 1A). It is important to note that because extent of blooming varies with MRI parameters, the size of the measured signal void will depend on factors beyond the size of the corresponding histopathological CMB. Echo-planar GRE imaging, in which an entire image is obtained from a single radiofrequency pulse excitation, can potentially lead to ultrafast acquisition with comparable CMB conspicuity,18 but possibly at the cost of increased artifact and distortion.19
Figure 1. Increased conspicuity of CMB with T2*-weighted MRI techniques.

Panel A compares T2 fast SE (left) and T2*-weighted MRI (right) imaging of the same CMB, shown at high magnification. The blooming effect is demonstrated by the larger area of signal void on the T2*-weighted MRI compared to the fast SE image. The GRE image also illustrates the ringing artifact as an area of high signal within the signal void. Panel B compares images obtained at corresponding axial levels using a conventional 2D sequence T2*-weighted MRI (left; TR/TE 775/20, flip angle 25°, voxel size 0.5×0.5×5 mm3) versus an accelerated 3D T2*-weighted MRI sequence (right; TR/TE 45/31, flip angle 13°, voxel size 0.5×0.5×0.8 mm3). Magnifications of matching brain regions are shown at bottom. The 3D T2*-weighted MRI image demonstrates three CMB in lobar locations (white arrows) that are not or barely discernible on the 2D T2*-weighted MRI image.
The sequence parameter that particularly affects sensitivity to magnetic susceptibility in T2*-weighted MRI is echo time (TE). TEs of 25 to 50 ms have generally been applied (Table 1),2,16,20 with longer TEs allowing more time for dephasing and consequently enlarging the susceptibility effect.21 Use of longer TE can lead to a trade-off in image quality, however, because of decay of transverse magnetization.22
Higher spatial resolution (in particular the use of thinner scanning sections) offers the possibility of minimizing the partial-volume averaging that might interfere with CMB detection. Using a three-dimensional (3D) Fourier transform technique in T2*-weighted MRI allows acquisition of very thin image slices at high signal to noise ratio. Recently, application of 3D T2*-weighted MRI at sub-millimeter spatial resolution (reconstructed voxel size of 0.5 × 0.5 × 0.8 mm3) was shown to detect more CMB when compared to conventional 2D GRE at lower resolution (Fig. 1B).20 Another study comparing 1.5 mm to 5 mm slice thicknesses found that individual CMB identified in CAA subjects had approximately double the contrast index (a measure of conspicuity) when imaged with thinner slices than with thicker slices.23 The longer scan times associated with scanning at small voxel sizes in 3D T2*-weighted MRI can be reduced to acceptable limits through acceleration by parallel imaging.20
Increased magnetic field strength, 3 Tesla (T) or even higher, appears to improve CMB conspicuity.23-26 Susceptibility effect is higher at higher magnetic field strength and blooming effects are therefore predicted to be greater.
Finally, use of image post-processing techniques may further enhance the contrast between brain tissue and hemosiderin deposits. T2*-effects can be augmented by multiplying magnitude (reflecting loss of signal) with phase (reflecting hemosiderin-related signal phase shift), a technique referred to as susceptibility-weighted imaging (SWI).27 Application of SWI to CMB imaging appears promising,28 yielding substantially higher contrast index for individual CMB relative to conventional T2*-weighted MRI.23 The added value of this technique over higher field strength and smaller voxel sizes remains to be determined.
Lesion Parameters, Mimics, and Detection Criteria
Although precise definitions of the MRI lesions that should be classified as CMB have varied,7 there is general agreement that they represent small areas of signal void with associated blooming, excluding larger hematomas (or “macrobleeds”), specific secondary causes of bleeding, and non-hemorrhagic causes of signal void. This starting point leaves room for several unaddressed questions, in particular defining operational rules needed to differentiate CMB from macrobleeds, hemorrhagic and non-hemorrhagic CMB mimics. We discuss relevant considerations and possible approaches to these questions below.
Various size cut-points have been used for discriminating microbleeds from macrobleeds, typically ranging up to a maximum diameter of 5 to 10 mm and in some studies a minimum of 2 mm (summarized in reference7). Recent insights, however, suggest several reasons for deemphasizing precise size criteria. First, the size of a given CMB on MRI depends on imaging parameters such as field strength and sequence as noted above. This consideration as well as the difficulty in implementing identical pulse sequences on different MRI systems substantially complicates attempts to compare CMB size across studies. A second consideration is that microbleeds and macrobleeds may fall in a naturally bimodal size distribution that does not strongly depend on the precise cut-point chosen to differentiate them. A recent analysis of lesion volumes for 163 hemorrhages seen on routine clinical (1.5T, 5 mm slice thickness) T2*-weighted MRI among 46 subjects presenting with probable CAA found not a single continuum of hemorrhage sizes, but rather a distinctly bimodal distribution with separate widely spaced peaks representing the microbleeds and macrobleeds.29 Interestingly, the cut-point that best divided the microbleed and macrobleed peaks corresponded to a diameter of 5.7 mm, similar to the 5 to 10 mm maximum conventionally used.5-7
The major mimics of CMB are discussed below and illustrated in Fig. 2. They arise in large part from the sensitivity of T2*-weighted MRI to paramagnetic substances other than hemosiderin, including calcifications, iron deposits, or deoxyhemoglobin. Such artifacts are expected to be more problematic using methods with higher sensitivity to susceptibility artifact such as SWI or higher field strength MRI.
Figure 2. CMB confounds and mimics.
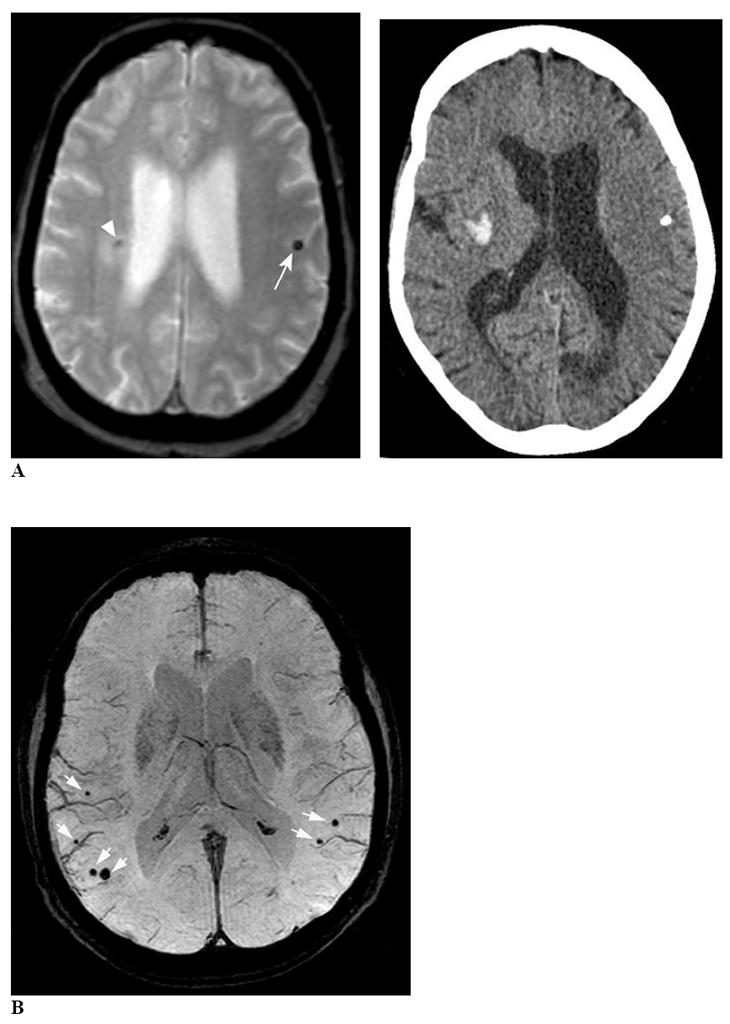
Panel A, left is an axial T2*-weighted MRI image showing a calcification in the left hemisphere (arrow) mimicking a CMB. The CT scan (right) demonstrates this lesion as an area of very high density. Note that the MRI also shows a right hemispheric hypointense lesion (arrowhead) surrounded by hyperintense signal, corresponding to the tip of a spontaneous intracerebral hemorrhage demonstrated on the CT image. Panel B uses a minimum intensity projection of an axial T2*-weighted MRI image (4 mm slab) to illustrate CMB (white arrows) in proximity to vessel flow voids on the brain surface. The vessels can be distinguished from CMB by their linear shape, while the CMB appear as blind-ended round or ovoid structures. Panel C is an axial T2*-weighted MRI image demonstrating partial volume artifact as a potential CMB mimic. The axial T2*-weighted MRI image on the left shows a round focus of signal loss (arrow) that could be interpreted as a left temporal CMB. The image just caudal to this (right) indicates that this hypointensity is due to partial volume artifact from the adjacent left sphenoid bone (arrowhead). Panel D shows axial proton density-weighted (left), T1-weighted (middle) and T2*-weighted MRI (right) images depicting a cavernous malformation (white arrows) mimicking a CMB. The hyperintense signal within the hypointense rim on proton density or T2-weighted sequences helps distinguish these lesions from CMB.
Both calcium and iron deposits may appear as small foci of low signal intensity on T2*-weighted MRI (Fig. 2A). These abnormalities are usually found bilaterally in the basal ganglia, although calcification can also occur in the choroid plexus, pineal gland, and lobar locations. CT can help identify suspected calcification, though its routine use is infrequent (6 of 53 reviewed studies).7
Flow voids in pial blood vessels caught in cross-section in cortical sulci can be distinguished from CMB by their sulcal location, their equal visibility on T2-weighted SE and GRE sequences (as arterial flow voids do not generate a blooming effect), and their linear structure when examined over contiguous slices, particularly evident at smaller slice thickness. The presence of paramagnetic deoxyhemoglobin in cerebral venules produces its own blooming effect, however, requiring the reader to rely on their tubular structure for differentiating them from CMB (Fig. 2B). The distinction from flow voids can also be difficult when a CMB appears immediately adjacent to a small vessel, but is suggested by the lesion’s termination as a blind end rather than continuing linearly as a vessel branch.
Partial volume artifact from bone (with associated susceptibility artifact from air in the sinuses) may obscure CMB or confuse their interpretation, especially in the temporal and frontal lobes because of the orbit and mastoid bones (Fig. 2C).
Cavernous malformations can be considered as a secondary cause of CMB (particularly the small “type IV” cavernous malformations30), but are distinguishable from typical primary CMB by the appearance on both T1- and T2-weighted sequences of stagnant blood in the sinusoidal lumen, extravasated blood at varying stages of degradation and the characteristic hemosiderin rim31 (Fig. 2D). This CMB mimic can itself be mimicked by the “ringing artifact” seen on T2*-weighted MRI (Fig. 1A), representing increased signal within flow void. Ringing artifact is typically absent on T2-weighted SE MRI, highlighting the importance of incorporating SE in conjunction with T2*-weighted MRI.
Metastatic melanoma in the brain can appear hypointense on T2*-weighted MRI,32 a result of both the presence of melanin and the tendency of these tumors to bleed. These lesions can often be distinguished from primary CMB by the concomitant presence of T1 hyperintensity (caused by the melanin) or of surrounding edema (particularly following recent intra-tumor hemorrhage), but small non-edematous lesions may mimic primary CMB.
Diffuse axonal injury following head trauma is another potential secondary cause of CMB, distinguishable from primary CMB by the clinical history and concomitant imaging abnormalities.33
Based on these considerations, it is reasonable to suggest working criteria for CMB detection (Table 2). For designation as CMB, a signal should be black or very hypointense on T2*-weighted MRI, round or ovoid (excluding tubular or linear structures such as those representing vessels or a resorbed macrobleed), blooming (larger or more conspicuous on GRE than SE MRI), devoid of T1- or T2-weighted hyperintensity (such as cavernous malformation, hemorrhagic infarct, or melanotic melanoma), and at least half surrounded by brain parenchyma (permitting superficial CMB as seen in CAA). Other mimics such as mineralization of the basal ganglia or diffuse axonal injury are excluded based on appearance or clinical history. As noted above, we suggest that size may be relatively unimportant for correctly categorizing lesions that otherwise meet these criteria and should be applied conservatively if at all.
Table 2.
Recommended Criteria for CMB Identification
|
A recognized consequence of the differential diagnosis of CMB is disagreement about their presence and numbers within and between raters. Coefficients of correlation between two raters’ quantifications of CMB number have been >0.8, but inter-rater reliabilities about the presence of ≥1 CMB in studies using conventional T2*-weighted MRI have been poorer (kappa 0.33 to 0.88),34 probably because of difficulties in detection and certainty about one or a few lesions. Early investigations suggest that standardized rating instruments may be helpful to improve inter-rater reliability.34
Radiological-Pathological Correlation
MRI carries obvious limitations relative to histopathological examination for investigating CMB, including the potential imaging artifacts described above as well as inability to provide microscopic evidence for specific tissue or small vessel pathologies. In interpreting MRI-pathological correlation studies, however, it is also important to recognize the basic limitation of histopathology: the practical impossibility of examining the entire brain in microscopic section. This limitation is particularly relevant to identification of CMB, lesions near the lower limits of gross visual detection and small enough to be fully contained within even a thin (e.g. 5 mm) brain slice without being exposed to the examining pathologist for sectioning. Conversely, the ability of modern MRI techniques to sample the full brain at spatial resolutions of 1 mm or less raises the possibility that MRI may ultimately prove substantially more sensitive than histopathology for CMB detection.
Radiological-pathological correlation studies of CMB10,35,36 have been able to link the majority of signal voids seen on T2*-weighted MRI with microscopic hemorrhagic foci. Fazekas and colleagues reported that 21 hypointense lesions seen on pre- or post-mortem T2*-weighted MRI of 11 autopsied brains corresponded pathologically to clusters of hemosiderin-laden macrophages.10 Similar pathological findings were observed in 8 of 9 T2*-weighted MRI hypointense lesions identified in 1 brain by Tatsumi and colleagues using post-mortem T2*-weighted MRI of brain slices to guide their search.36
In these studies of conventional T2*-weighted MRI methods, sensitivity of MRI and histopathologic examination for CMB detection appeared comparable. In the study by Fazekas and colleagues,10 T2*-weighted MRI (using 5 mm slices and 0.5 mm inter-slice gap) detected 13 lesions not seen pathologically whereas histopathologic exam identified 20 additional CMB not detected by T2*-weighted MRI. These MRI-negative lesions tended to be smaller than the MRI-positive lesions (described as “only a few perivascular hemosiderin-laden macrophages”) and in retrospect, may represent the class of CMB currently being uncovered by the more sensitive modified T2*-weighted methods. Further radiological-pathological correlation studies using these more sensitive imaging methods will be needed to determine whether they indeed detect a higher proportion of histopathological microbleeds than conventional T2*-weighted MRI.
The specificity of T2*-weighted MRI for CMB appears to be fairly high. Among the 14 MRI lesions in these two studies10,36 not identified with histopathological microbleeds, only 1 corresponded to a potential CMB mimic, described as a “vascular pseudocalcification.”36 Again, it will be important for future studies using newer T2*-weighted MRI methods to repeat these MRI-autopsy correlation analyses to confirm that the sensitive imaging techniques maintain a relatively high specificity for CMB.
CMB: How to Interpret
Markers of disease
1. Vascular pathology
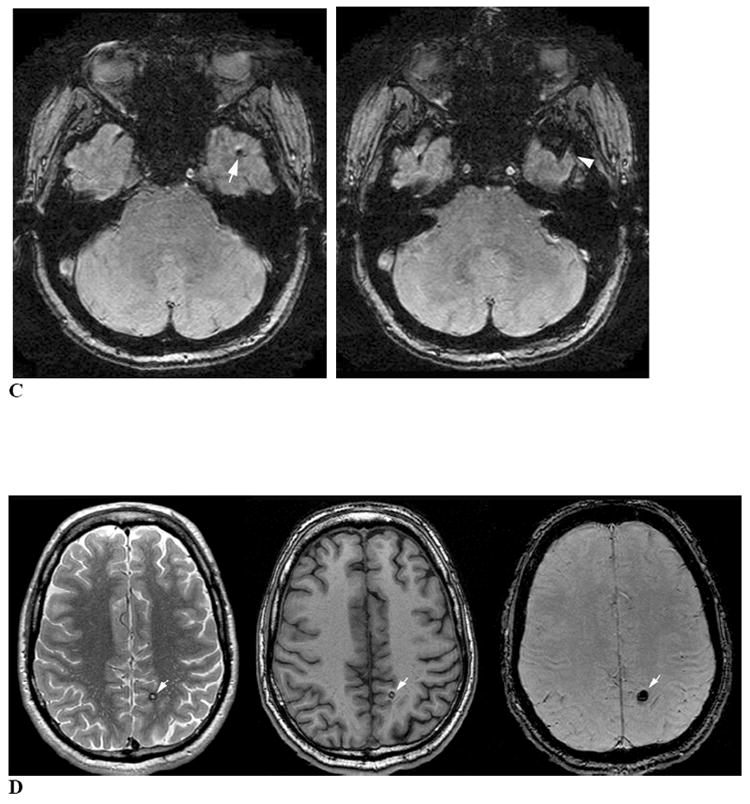
One approach to interpreting CMB is as a marker of accompanying vascular pathology. Histopathologic analyses of the vessels associated with CMB, performed primarily in brains with hemorrhagic stroke, have generally identified two types of vascular pathologies: hypertensive vasculopathy and CAA.10,35,37 Among the 11 brains examined by Fazekas and colleagues10 for example, advanced hypertensive lipohyalinotic changes were seen in 9 and CAA in 2. These two pathologies are typically characterized by different patterns of microbleed distribution: CMB associated with hypertensive vasculopathy tend to occur in basal ganglia, thalamus, brainstem, and cerebellum,10 whereas advanced CAA is associated with a lobar (or less commonly cerebellar) distribution (Fig. 3).37 The lobar distribution of CAA-related CMB is consistent with the distribution of CAA vascular pathology38 and has served as the basis for the radiologic diagnosis of probable CAA in hemorrhagic stroke patients according to the pathologically validated Boston criteria.37 The Boston criteria for probable CAA specify that this diagnosis cannot be made if any CMB are located in basal ganglia, thalamus, or brainstem, regions atypical for CAA pathology. Within the lobar brain compartment, CAA-related CMB39 and the underlying CAA pathology38,40 appear to favor posterior cortical regions, particularly the occipital lobe.
Figure 3. Deep hemispheric and isolated lobar patterns of CMB distribution.
The left panel represents a T2*-weighted MRI image from an 84-year-old woman with long-standing hypertension. CMB are present predominantly in the bilateral thalamus, putamen, caudate, and cerebellum, with only a small number in lobar brain regions (not shown in this image). The right panel is from a 77-year-old woman without hypertension. CMB are present only in lobar brain regions, meeting criteria for probable CAA.37
The pathological factors that determine whether a particular bleeding event will result in a microbleed versus a macrobleed is another focus of ongoing investigation. The observed bimodal distribution of hemorrhage volumes29 raises the possibility of a threshold mechanism, whereby a bleed can either remain small or reach a critical size that causes it to continue to enlarge fully into the macrobleed range. This possibility echoes Fisher’s suggestion in 1971 that macrobleeds occur in “avalanche or domino style”41 when bleeding from one ruptured vessel causes secondary rupture of surrounding arteries. Fisher based this idea on the observation that a serially sectioned acute hypertensive pontine hemorrhage was surrounded by 24 or more sites of recent arterial rupture in vessels without advanced lipohyalinotic changes, apparently representing sites of mechanical rupture secondary to the primary bleed. This now classic study offers an intriguing framework for future investigations of how CMB might be related to their larger symptomatic counterparts.
2. Association with disease-related risk factors
A second approach to CMB interpretation is analyzing their associations with particular risk factors and disease states. Studies on correlates of CMB in hemorrhagic stroke patients, ischemic stroke patients, and population-based, community-dwelling elderly (see Table 1) have been extensively reviewed.5-7 Hypertension appears to be the most consistent predictor of CMB, with odds ratios averaged across studies in stroke patients and healthy adults of 2.3 and 3.9.7 An association between CMB and hypertension is further supported by relationships of CMB prevalence to measured blood pressures,2,4 lacunar infarcts or white matter lesions,2,4,13,42-48 retinal microvascular lesions,49 and left ventricular hypertrophy.50 These observations suggest that the blood pressure-related vascular pathologies that can produce larger, symptomatic intracerebral hemorrhage (ICH) can also give rise to CMB. Other risk factors for ICH such as age2-4,12,13 and low serum cholesterol concentration4,51 also appear to associate with higher prevalence or number of CMB. The association between low cholesterol and CMB is particularly intriguing in light of recent data showing increased risk of symptomatic ICH in stroke patients randomized to high-dose atorvastatin.52 This increased risk was independent of low-density lipoprotein cholesterol level,53 however, suggesting that mechanisms other than lipid lowering might be responsible.
Recent population-based data offer some support for the possibility raised above that CMB location may correlate with specific vascular pathologies (i.e. deep hemispheric or infratentorial CMB suggesting hypertensive vasculopathy, a strictly lobar distribution suggesting CAA). Analysis of APOE genotype in subjects from the Rotterdam Scan Study subdivided according to CMB distribution found an association with the APOE ε4 allele pertaining only to the subgroup with isolated lobar CMB (odds ratio for APOE ε4 carriers of 1.87, 95% confidence interval 1.25 to 2.81) and not the subgroup with deep hemispheric or infratentorial CMB (odds ratio 1.17, 95% confidence interval 0.70 to 1.93).4 Given the relationship between APOE ε4 and CAA,54,55 these results raise the interesting possibility that isolated lobar CMB (a subgroup accounting for 58% of CMB-positive subjects in the Rotterdam study4) may often reflect the presence of advanced CAA. In the same study, systolic blood pressure, severe hypertension, and lacunar infarcts appeared more closely linked to deep or infratentorial CMB,4 suggesting hypertensive vasculopathy as the predominant underlying disease in this subgroup. These intriguing findings still await confirmation in other population-based studies of older subjects. The Framingham Study of relatively younger subjects scanned at a lower magnetic field strength (see Table 1) found no association with APOE genotype among all CMB or lobar-only CMB subjects,13 whereas the AGES Reykjavik study of older subjects reported a significant overrepresentation of the APOE ε4/ε4 genotype among all subjects with CMB (4.2% versus 1.8%, p=0.01).3
Determining whether a lobar distribution of CMB can be used to diagnose CAA in the general population may ultimately require population-based MRI-autopsy correlation studies. Previously reported population-based clinical-autopsy series have found CAA to be a common neuropathological finding,40,56,57 but have not yet examined its correlation with CMB detected on pre-mortem MRI scans.
3. Risk for hemorrhagic stroke
As markers of underlying hemorrhage-prone vascular pathology, CMB might be expected to predict future risk of symptomatic intracerebral hemorrhage. Studies of prospectively followed survivors of lobar ICH58 and ischemic stroke59 suggest this is the case, at least post-stroke. Among 94 survivors of primary lobar hemorrhage, higher total numbers of hemorrhages (the presenting ICH plus other micro- and macrobleeds detected by T2*-weighted MRI at baseline) predicted increased risk of future symptomatic hemorrhage: 3-year cumulative risk of 14% for those with only a single hemorrhage, 17% for 2 lesions, 38% for 3 to 5, and 51% for ≥6.58 Similarly, among 908 ischemic stroke survivors, the risk of subsequent hemorrhagic stroke over 26 months of follow-up increased from 0.6% for those with no accompanying CMB to 1.9% with 1 microbleed, 4.6% with 2 to 4, and 7.6% for ≥5.59 Studies of ischemic stroke patients have also suggested possible links between CMB and spontaneous or thrombolysis-associated post-stroke bleeding (primarily into the infarcted territory),60,61 although these findings have been questioned by recent analyses.62,63 The predictive value of CMB in people without previous stroke is currently unknown and represents a key issue to be addressed by ongoing longitudinal population studies.
The association between CMB and future symptomatic ICH raises the question of whether the increased risk might be great enough to tip the risk-benefit calculation away from anticoagulation in situations where it is otherwise beneficial, such as prevention of thromboembolism in individuals with atrial fibrillation. A recent decision analysis using current risk estimates suggested that anticoagulation would still be beneficial in patients with asymptomatic CMB,64 contrasting with the suggestion that anticoagulation should be avoided following symptomatic CAA-related ICH.65 For antiplatelet agents, longitudinal data from 127 subjects with symptomatic lobar ICH (27 on antiplatelet treatment) and 80 subjects with symptomatic deep hemispheric ICH (19 on antiplatelet treatment) did not find an increase in recurrent ICH, although a modestly elevated risk could not be excluded.66 The question of how CMB should affect antithrombotic use remains an active area of investigation, particularly in light of broadening indications for these agents.
Contributors to Neurologic Dysfunction
In addition to their role as markers of underlying disease, CMB could also have direct effects on neurologic function, cognition, and disability. Indeed, neuropathological analyses of CMB generally find these lesions to be associated with some degree of surrounding tissue damage,10,35,36 offering a potential mechanism for brain dysfunction.
The possibility that CMB contribute to clinical deficits is supported by findings from the prospective study of 94 survivors of primary lobar ICH cited above, where higher numbers of hemorrhages at baseline was also associated with increased incidence of future cognitive impairment, functional dependence or death at follow-up: 3-year cumulative risk of 16% for those with 1 hemorrhage, 20% for 2 hemorrhages, 51% for 3 to 5, and 52% for ≥6.58 CMB have also been associated with clinical disability in the hereditary small-vessel disease cerebral autosomal dominant arteriopathy with subcortical infarcts and leukoencephalopathy (CADASIL).67,68 In a two-center cohort study of 147 patients with CADASIL, the number of CMB was independently associated with functional dependence (defined as modified Rankin score ≥3) with an odds ratio per additional microbleed of 1.16 (95% confidence interval 1.01 to 1.34, p=0.034) after adjustment for other confounding variables.68 Multivariable analysis to define correlates of cognition did not, however, find a similar independent association with CMB. Finally, a small case-control study of patients with ischemic stroke or TIA found that individuals with CMB performed significantly worse than those without on standard tests of executive function.69 Although each of these studies attempted to control for potential confounders, the association of CMB with other markers of small vessel injury such as lacunar infarcts and white matter damage points to the need for confirmation in larger studies with greater statistical power as well as studies of individuals without prior stroke.
If CMB indeed have direct effects on brain function (rather than simply marking the presence of other cerebrovascular pathologies), one would expect CMB location to play a role. In analyses of the two-center CADASIL cohort, CMB in the caudate were independently associated with lower global cognitive scores (based on the Mattis dementia rating scale; p=0.027) and CMB in the frontal lobes showed a trend toward lower global cognitive scores (p=0.056).70 Similarly, the small study of stroke/TIA subjects suggested more microbleeds in the frontal lobes and basal ganglia of those with executive dysfunction compared to those without.69 Detailed anatomical mapping of CMB, as has been performed with other MRI lesions,71 would seem a promising approach for future clinical-MRI correlation studies. Given the widespread distribution of CMB and their frequent association with other small vessel-related pathologies, however, such studies will again need to be both large and carefully controlled.
Recommendations and Future Directions
The considerations outlined above summarize considerable progress over just a short period of intensive investigation into the identification and interpretation of CMB. Below is a tentative list of conclusions and recommendations for future studies (the latter shown in bold type).
Cerebral microbleeds appear to be a well-defined pathological lesion detectable by T2*-weighted MRI techniques with high sensitivity (particularly using newer MRI methods), high reliability (with careful image interpretation and consideration of CMB mimics), and high specificity (demonstrated for conventional T2*-weighted MRI, still to be established for the newer methods methods). The full brain coverage afforded by MRI likely renders neuroimaging a more sensitive method for CMB detection than practical histopathologic techniques.
Choice of T2*-weighted MRI methods (including sequence parameters, spatial resolution, field strength, and post-processing) has large effects on the prevalence and number of detected CMB and thus on overall study sensitivity. Although it is premature to specify a standard sequence for all future studies, such a standard will evolve over the coming years and will likely include thin imaging slices. The process of reaching a common standard will be accelerated by further side-by-side comparisons of individual subjects with CMB imaged using varying MRI methods.20,23
All studies of CMB should specify the above imaging parameters and should follow systematic rules or standardized rating instruments for excluding CMB mimics. These factors should presumably be held constant in longitudinal studies aiming for repeated measurements. Choice of precise size parameters for CMB does not appear to have major effects on their detection.
Using advanced T2*-weighted MRI methods, population-based studies show CMB to be very common lesions in community-dwelling elderly, with prevalences on the order of 10 to 25%.
Accumulating evidence suggests that CMB might be reflective of specific underlying vascular pathologies, in particular hypertensive vasculopathy (for CMB in deep hemispheric or infratentorial locations) or cerebral amyloid angiopathy (for CMB restricted to lobar locations). Their presence and number may also reflect the severity of these hemorrhage-prone pathologies and thus predict risk of future symptomatic intracerebral hemorrhage. Future studies of CMB-positive subjects should consider separate subgroup analyses according to CMB location (deep hemispheric/infratentorial versus lobar only; Fig. 3).
The evidence that CMB directly disrupt brain functioning is less clear and will require carefully controlled studies to disentangle their contribution from that of other small-vessel brain lesions such as lacunar infarcts and white matter hyperintensities that frequently accompany CMB.
The immediate future in CMB research is likely to see evolution of a shared set of standards for their detection that will allow fruitful cross-study comparisons and enable robust longitudinal data collection. Determining whether CMB should affect clinical decision-making, identifying their interrelationship with other manifestations of small-vessel disease, and dissecting out their independent contribution to vascular cognitive and neurologic dysfunction are key longer-term goals.
Acknowledgments
Additional members of the Microbleed Study Group who participated in the Cerebral Microbleeds: Detection and Definition conference and contributed valuable discussions and critiques for this manuscript are M. Arfan Ikram, Michiel J. Bos, Marielle M. F. Poels (Rotterdam, The Netherlands), Jeroen van der Grond (Leiden, The Netherlands), M. Edip Gurol, and R. N. Kaveer Nandigam (Boston, USA). The conference “Cerebral Microbleeds: Detection and Definition” held by the Microbleed Study Group on April 12, 2008 in Chicago, USA was supported by sundry research funds provided by individual donors to the Massachusetts General Hospital Hemorrhagic Stroke Research Program without contributions from industry or commercial interests.
Footnotes
Authors’ Contributions
Dr. Greenberg organized the consensus conference, drafted manuscript text, prepared figures, and made critical revisions to the manuscript. Dr. Vernooij drafted manuscript text, prepared figures, and made critical revisions to the manuscript. Dr. Cordonnier drafted manuscript text, prepared figures, and made critical revisions to the manuscript. Dr. Viswanathan drafted manuscript text and made critical revisions to the manuscript. Dr. Al-Shahi Salman made critical revisions to the manuscript. Dr. Warach made critical revisions to the manuscript. Dr. Launer made critical revisions to the manuscript. Dr. van Buchem drafted manuscript text, prepared figures, and made critical revisions to the manuscript. Dr. Breteler co-organized the consensus conference and made critical revisions to the manuscript.
Conflicts of Interest
The authors have no conflicts of interest relevant to the contents of the submitted manuscript.
References
- 1.Offenbacher H, Fazekas F, Schmidt R, Koch M, Fazekas G, Kapeller P. MR of cerebral abnormalities concomitant with primary intracerebral hematomas. AJNR Am J Neuroradiol. 1996;17(3):573–578. [PMC free article] [PubMed] [Google Scholar]
- 2.Roob G, Schmidt R, Kapeller P, Lechner A, Hartung HP, Fazekas F. MRI evidence of past cerebral microbleeds in a healthy elderly population. Neurology. 1999;52(5):991–4. doi: 10.1212/wnl.52.5.991. [DOI] [PubMed] [Google Scholar]
- 3.Sveinbjornsdottir S, Sigurdsson S, Aspelund T, et al. Cerebral microbleeds in the population based AGES Reykjavik study: Prevalence and location. J Neurol Neurosurg Psychiatry. 2008;79:1002–1006. doi: 10.1136/jnnp.2007.121913. [DOI] [PMC free article] [PubMed] [Google Scholar]
- 4.Vernooij MW, van der Lugt A, Ikram MA, et al. Prevalence and risk factors of cerebral microbleeds: the Rotterdam Scan Study. Neurology. 2008;70(14):1208–14. doi: 10.1212/01.wnl.0000307750.41970.d9. [DOI] [PubMed] [Google Scholar]
- 5.Koennecke HC. Cerebral microbleeds on MRI: prevalence, associations, and potential clinical implications. Neurology. 2006;66(2):165–71. doi: 10.1212/01.wnl.0000194266.55694.1e. [DOI] [PubMed] [Google Scholar]
- 6.Viswanathan A, Chabriat H. Cerebral microhemorrhage. Stroke. 2006;37(2):550–5. doi: 10.1161/01.STR.0000199847.96188.12. [DOI] [PubMed] [Google Scholar]
- 7.Cordonnier C, Al-Shahi Salman R, Wardlaw J. Spontaneous brain microbleeds: systematic review, subgroup analyses and standards for study design and reporting. Brain. 2007;130:1988–2003. doi: 10.1093/brain/awl387. [DOI] [PubMed] [Google Scholar]
- 8.Fiehler J. Cerebral microbleeds: old leaks and new haemorrhages. Int J Stroke. 2006;1(3):122–30. doi: 10.1111/j.1747-4949.2006.00042.x. [DOI] [PubMed] [Google Scholar]
- 9.Werring DJ. Cerebral microbleeds: clinical and pathophysiological significance. J Neuroimaging. 2007;17(3):193–203. doi: 10.1111/j.1552-6569.2006.00070.x. [DOI] [PubMed] [Google Scholar]
- 10.Fazekas F, Kleinert R, Roob G, et al. Histopathologic analysis of foci of signal loss on gradient-echo T2*-weighted MR images in patients with spontaneous intracerebral hemorrhage: evidence of microangiopathy-related microbleeds. AJNR Am J Neuroradiol. 1999;20(4):637–42. [PMC free article] [PubMed] [Google Scholar]
- 11.Tsushima Y, Tanizaki Y, Aoki J, Endo K. MR detection of microhemorrhages in neurologically healthy adults. Neuroradiology. 2002;44(1):31–6. doi: 10.1007/s002340100649. [DOI] [PubMed] [Google Scholar]
- 12.Horita Y, Imaizumi T, Niwa J, et al. Analysis of dot-like hemosiderin spots using brain dock system. No Shinkei Geka. 2003;31(3):263–7. [PubMed] [Google Scholar]
- 13.Jeerakathil T, Wolf PA, Beiser A, et al. Cerebral microbleeds: prevalence and associations with cardiovascular risk factors in the Framingham Study. Stroke. 2004;35(8):1831–5. doi: 10.1161/01.STR.0000131809.35202.1b. [DOI] [PubMed] [Google Scholar]
- 14.Jones KM, Mulkern RV, Schwartz RB, Oshio K, Barnes PD, Jolesz FA. Fast spin-echo MR imaging of the brain and spine: current concepts. AJR Am J Roentgenol. 1992;158(6):1313–20. doi: 10.2214/ajr.158.6.1590133. [DOI] [PubMed] [Google Scholar]
- 15.Atlas SW, Mark AS, Grossman RI, Gomori JM. Intracranial hemorrhage: gradient-echo MR imaging at 1.5 T. Comparison with spin-echo imaging and clinical applications. Radiology. 1988;168(3):803–807. doi: 10.1148/radiology.168.3.3406410. [DOI] [PubMed] [Google Scholar]
- 16.Greenberg SM, Finklestein SP, Schaefer PW. Petechial hemorrhages accompanying lobar hemorrhage: detection by gradient-echo MRI. Neurology. 1996;46(6):1751–1754. doi: 10.1212/wnl.46.6.1751. [DOI] [PubMed] [Google Scholar]
- 17.Hermier M, Nighoghossian N, Derex L, et al. MRI of acute post-ischemic cerebral hemorrhage in stroke patients: diagnosis with T2*-weighted gradient-echo sequences. Neuroradiology. 2001;43(10):809–15. doi: 10.1007/s002340100601. [DOI] [PubMed] [Google Scholar]
- 18.Kinoshita T, Okudera T, Tamura H, Ogawa T, Hatazawa J. Assessment of Lacunar Hemorrhage Associated With Hypertensive Stroke by Echo-Planar Gradient-Echo T2*-Weighted MRI. Stroke. 2000;31(7):1646–1650. doi: 10.1161/01.str.31.7.1646. [DOI] [PubMed] [Google Scholar]
- 19.Liang L, Korogi Y, Sugahara T, et al. Detection of intracranial hemorrhage with susceptibility-weighted MR sequences. AJNR Am J Neuroradiol. 1999;20(8):1527–34. [PMC free article] [PubMed] [Google Scholar]
- 20.Vernooij MW, Ikram MA, Wielopolski PA, Krestin GP, Breteler MM, van der Lugt A. Cerebral microbleeds: accelerated 3D T2*-weighted GRE MR imaging versus conventional 2D T2*-weighted GRE MR imaging for detection. Radiology. 2008;248(1):272–7. doi: 10.1148/radiol.2481071158. [DOI] [PubMed] [Google Scholar]
- 21.Tatsumi S, Ayaki T, Shinohara M, Yamamoto T. Type of gradient recalled-echo sequence results in size and number change of cerebral microbleeds. AJNR Am J Neuroradiol. 2008;29(4):e13. doi: 10.3174/ajnr.A0908. [DOI] [PMC free article] [PubMed] [Google Scholar]
- 22.Henkelman M, Kucharczyk W. Optimization of gradient-echo MR for calcium detection. AJNR Am J Neuroradiol. 1994;15(3):465–72. [PMC free article] [PubMed] [Google Scholar]
- 23.Nandigam RNK, Viswanathan A, Delgado P, et al. MRI detection of cerebral microbleeds. Effect of susceptibility-weighted imaging, slice thickness, and field strength. AJNR Am J Neuroradiol. 2009 doi: 10.3174/ajnr.A1355. in press. [DOI] [PMC free article] [PubMed] [Google Scholar]
- 24.Kikuta K, Takagi Y, Nozaki K, et al. Asymptomatic microbleeds in moyamoya disease: T2*-weighted gradient-echo magnetic resonance imaging study. J Neurosurg. 2005;102(3):470–5. doi: 10.3171/jns.2005.102.3.0470. [DOI] [PubMed] [Google Scholar]
- 25.Scheid R, Ott DV, Roth H, Schroeter ML, von Cramon DY. Comparative magnetic resonance imaging at 1.5 and 3 Tesla for the evaluation of traumatic microbleeds. J Neurotrauma. 2007;24(12):1811–6. doi: 10.1089/neu.2007.0382. [DOI] [PubMed] [Google Scholar]
- 26.Stehling C, Wersching H, Kloska SP, et al. Detection of asymptomatic cerebral microbleeds a comparative study at 1.5 and 3.0 T. Acad Radiol. 2008;15(7):895–900. doi: 10.1016/j.acra.2008.01.013. [DOI] [PubMed] [Google Scholar]
- 27.Haacke EM, Xu Y, Cheng YC, Reichenbach JR. Susceptibility weighted imaging (SWI) Magn Reson Med. 2004;52(3):612–8. doi: 10.1002/mrm.20198. [DOI] [PubMed] [Google Scholar]
- 28.Akter M, Hirai T, Hiai Y, et al. Detection of hemorrhagic hypointense foci in the brain on susceptibility-weighted imaging clinical and phantom studies. Acad Radiol. 2007;14(9):1011–9. doi: 10.1016/j.acra.2007.05.013. [DOI] [PubMed] [Google Scholar]
- 29.Greenberg SM, Nandigam RNK, Delgado P, et al. Microbleeds versus macrobleeds: Evidence for distinct processes. Stroke (abs) 2008;39(2):528. doi: 10.1161/STROKEAHA.109.548974. [DOI] [PMC free article] [PubMed] [Google Scholar]
- 30.Zabramski JM, Wascher TM, Spetzler RF, et al. The natural history of familial cavernous malformations: results of an ongoing study. J Neurosurg. 1994;80(3):422–32. doi: 10.3171/jns.1994.80.3.0422. [DOI] [PubMed] [Google Scholar]
- 31.Al-Shahi Salman R, Berg M, M L, Awad IA, Board AASA. Hemorrhage from cavernous malformations of the brain: Definition and reporting standards. Stroke. 2008 doi: 10.1161/STROKEAHA.108.515544. in press. [DOI] [PubMed] [Google Scholar]
- 32.Gaviani P, Mullins ME, Braga TA, et al. Improved detection of metastatic melanoma by T2*-weighted imaging. AJNR Am J Neuroradiol. 2006;27(3):605–8. [PMC free article] [PubMed] [Google Scholar]
- 33.Mittl RL, Grossman RI, Hiehle JF, et al. Prevalence of MR evidence of diffuse axonal injury in patients with mild head injury and normal head CT findings. Ajnr: American Journal of Neuroradiology. 1994;15(8):1583–9. [PMC free article] [PubMed] [Google Scholar]
- 34.Cordonnier C, Potter GM, Jackson CA, et al. Improving inter-rater agreement about brain microbleeds: Development of the Brain Observer MicroBleed Scale (BOMBS) Stroke. 2008 Nov 13; doi: 10.1161/STROKEAHA.108.526996. Epub ahead of print. [DOI] [PubMed] [Google Scholar]
- 35.Tanaka A, Ueno Y, Nakayama Y, Takano K, Takebayashi S. Small chronic hemorrhages and ischemic lesions in association with spontaneous intracerebral hematomas. Stroke. 1999;30(8):1637–42. doi: 10.1161/01.str.30.8.1637. [DOI] [PubMed] [Google Scholar]
- 36.Tatsumi S, Shinohara M, Yamamoto T. Direct comparison of histology of microbleeds with postmortem MR images. A case report. Cerebrovasc Dis. 2008;26(2):142–146. doi: 10.1159/000139661. [DOI] [PubMed] [Google Scholar]
- 37.Knudsen KA, Rosand J, Karluk D, Greenberg SM. Clinical diagnosis of cerebral amyloid angiopathy: Validation of the Boston Criteria. Neurology. 2001;56(4):537–539. doi: 10.1212/wnl.56.4.537. [DOI] [PubMed] [Google Scholar]
- 38.Vinters HV, Gilbert JJ. Cerebral amyloid angiopathy: incidence and complications in the aging brain. II. The distribution of amyloid vascular changes. Stroke. 1983;14(6):924–928. doi: 10.1161/01.str.14.6.924. [DOI] [PubMed] [Google Scholar]
- 39.Rosand J, Muzikansky A, Kumar A, et al. Spatial clustering of hemorrhages in probable cerebral amyloid angiopathy. Ann Neurol. 2005;58(3):459–462. doi: 10.1002/ana.20596. [DOI] [PubMed] [Google Scholar]
- 40.Pfeifer LA, White LR, Ross GW, Petrovitch H, Launer LJ. Cerebral amyloid angiopathy and cognitive function: the HAAS autopsy study. Neurology. 2002;58(11):1629–1634. doi: 10.1212/wnl.58.11.1629. [DOI] [PubMed] [Google Scholar]
- 41.Fisher CM. Pathological observations in hypertensive cerebral hemorrhage. J Neuropathol Exp Neurol. 1971;30(3):536–50. doi: 10.1097/00005072-197107000-00015. [DOI] [PubMed] [Google Scholar]
- 42.Kato H, Izumiyama M, Izumiyama K, Takahashi A, Itoyama Y. Silent cerebral microbleeds on T2*-weighted MRI: correlation with stroke subtype, stroke recurrence, and leukoaraiosis. Stroke. 2002;33(6):1536–40. doi: 10.1161/01.str.0000018012.65108.86. [DOI] [PubMed] [Google Scholar]
- 43.Naka H, Nomura E, Wakabayashi S, et al. Frequency of asymptomatic microbleeds on T2*-weighted MR images of patients with recurrent stroke: association with combination of stroke subtypes and leukoaraiosis. AJNR Am J Neuroradiol. 2004;25(5):714–9. [PMC free article] [PubMed] [Google Scholar]
- 44.Imaizumi T, Horita Y, Chiba M, Hashimoto Y, Honma T, Niwa J. Dot-like hemosiderin spots on gradient echo T2*-weighted magnetic resonance imaging are associated with past history of small vessel disease in patients with intracerebral hemorrhage. J Neuroimaging. 2004;14(3):251–7. doi: 10.1177/1051228404265714. [DOI] [PubMed] [Google Scholar]
- 45.Fan YH, Mok VC, Lam WW, Hui AC, Wong KS. Cerebral microbleeds and white matter changes in patients hospitalized with lacunar infarcts. J Neurol. 2004;251(5):537–41. doi: 10.1007/s00415-004-0359-6. [DOI] [PubMed] [Google Scholar]
- 46.Wardlaw JM, Lewis SC, Keir SL, Dennis MS, Shenkin S. Cerebral microbleeds are associated with lacunar stroke defined clinically and radiologically, independently of white matter lesions. Stroke. 2006;37(10):2633–6. doi: 10.1161/01.STR.0000240513.00579.bf. [DOI] [PubMed] [Google Scholar]
- 47.Cordonnier C, van der Flier WM, Sluimer JD, Leys D, Barkhof F, Scheltens P. Prevalence and severity of microbleeds in a memory clinic setting. Neurology. 2006;66(9):1356–60. doi: 10.1212/01.wnl.0000210535.20297.ae. [DOI] [PubMed] [Google Scholar]
- 48.Pettersen JA, Sathiyamoorthy G, Gao F, et al. Microbleed topography, leukoaraiosis, and cognition in probable Alzheimer disease from the Sunnybrook Dementia Study. Archives of Neurology. 2008;65:790–795. doi: 10.1001/archneur.65.6.790. [DOI] [PubMed] [Google Scholar]
- 49.Qiu C, Cotch MF, Sigurdsson S, et al. Retinal and cerebral microvascular signs and diabetes: the age, gene/environment susceptibility-Reykjavik study. Diabetes. 2008;57(6):1645–50. doi: 10.2337/db07-1455. [DOI] [PubMed] [Google Scholar]
- 50.Lee SH, Park JM, Kwon SJ, et al. Left ventricular hypertrophy is associated with cerebral microbleeds in hypertensive patients. Neurology. 2004;63(1):16–21. doi: 10.1212/01.wnl.0000132525.36804.a1. [DOI] [PubMed] [Google Scholar]
- 51.Lee SH, Bae HJ, Yoon BW, Kim H, Kim DE, Roh JK. Low concentration of serum total cholesterol is associated with multifocal signal loss lesions on gradient-echo magnetic resonance imaging: analysis of risk factors for multifocal signal loss lesions. Stroke. 2002;33(12):2845–9. doi: 10.1161/01.str.0000036092.23649.2e. [DOI] [PubMed] [Google Scholar]
- 52.Amarenco P, Bogousslavsky J, Callahan A, 3rd, et al. High-dose atorvastatin after stroke or transient ischemic attack. N Engl J Med. 2006;355(6):549–59. doi: 10.1056/NEJMoa061894. [DOI] [PubMed] [Google Scholar]
- 53.Goldstein LB, Amarenco P, Szarek M, et al. Hemorrhagic stroke in the Stroke Prevention by Aggressive Reduction in Cholesterol Levels study. Neurology. 2008;70(24 Pt 2):2364–70. doi: 10.1212/01.wnl.0000296277.63350.77. [DOI] [PubMed] [Google Scholar]
- 54.Greenberg SM, Rebeck GW, Vonsattel JPV, Gomez-Isla T, Hyman BT. Apolipoprotein E e4 and cerebral hemorrhage associated with amyloid angiopathy. Annals of Neurology. 1995;38:254–259. doi: 10.1002/ana.410380219. [DOI] [PubMed] [Google Scholar]
- 55.Chalmers K, Wilcock GK, Love S. APOE epsilon 4 influences the pathological phenotype of Alzheimer’s disease by favouring cerebrovascular over parenchymal accumulation of A beta protein. Neuropathol Appl Neurobiol. 2003;29(3):231–8. doi: 10.1046/j.1365-2990.2003.00457.x. [DOI] [PubMed] [Google Scholar]
- 56.Pathological correlates of late-onset dementia in a multicentre, community-based population in England and Wales. Neuropathology Group of the Medical Research Council Cognitive Function and Ageing Study (MRC CFAS) Lancet. 2001;357(9251):169–75. doi: 10.1016/s0140-6736(00)03589-3. [DOI] [PubMed] [Google Scholar]
- 57.Bennett DA, Schneider JA, Arvanitakis Z, et al. Neuropathology of older persons without cognitive impairment from two community-based studies. Neurology. 2006;66(12):1837–44. doi: 10.1212/01.wnl.0000219668.47116.e6. [DOI] [PubMed] [Google Scholar]
- 58.Greenberg SM, Eng JA, Ning M, Smith EE, Rosand J. Hemorrhage burden predicts recurrent intracerebral hemorrhage after lobar hemorrhage. Stroke. 2004;35(6):1415–20. doi: 10.1161/01.STR.0000126807.69758.0e. [DOI] [PubMed] [Google Scholar]
- 59.Soo YO, Yang SR, Lam WW, et al. Risk versus benefit of anti-thrombotic therapy in ischaemic stroke patients with microbleeds. J Neurology. 2008 doi: 10.1007/s00415-008-0967-7. in press. [DOI] [PubMed] [Google Scholar]
- 60.Nighoghossian N, Hermier M, Adeleine P, et al. Old microbleeds are a potential risk factor for cerebral bleeding after ischemic stroke: a gradient-echo T2*-weighted brain MRI study. Stroke. 2002;33(3):735–42. doi: 10.1161/hs0302.104615. [DOI] [PubMed] [Google Scholar]
- 61.Kidwell CS, Saver JL, Villablanca JP, et al. Magnetic resonance imaging detection of microbleeds before thrombolysis: an emerging application. Stroke. 2002;33(1):95–8. doi: 10.1161/hs0102.101792. [DOI] [PubMed] [Google Scholar]
- 62.Fiehler J, Albers GW, Boulanger JM, et al. Bleeding risk analysis in stroke imaging before thromboLysis (BRASIL): pooled analysis of T2*-weighted magnetic resonance imaging data from 570 patients. Stroke. 2007;38(10):2738–44. doi: 10.1161/STROKEAHA.106.480848. [DOI] [PubMed] [Google Scholar]
- 63.Lee SH, Kang BS, Kim N, Roh JK. Does microbleed predict haemorrhagic transformation after acute atherothrombotic or cardioembolic stroke? J Neurol Neurosurg Psychiatry. 2008;79(8):913–6. doi: 10.1136/jnnp.2007.133876. [DOI] [PubMed] [Google Scholar]
- 64.Eckman MH, Wong LK, Soo YO, et al. Patient-specific decision making for warfarin therapy in nonvalvular atrial fibrillation. How will screening with genetics and imaging help? Stroke. 2008 doi: 10.1161/STROKEAHA.108.523159. in press. [DOI] [PubMed] [Google Scholar]
- 65.Eckman MH, Rosand J, Knudsen KA, Singer DE, Greenberg SM. Can patients be anticoagulated after intracerebral hemorrhage? A decision analysis. Stroke. 2003;34(7):1710–1716. doi: 10.1161/01.STR.0000078311.18928.16. [DOI] [PubMed] [Google Scholar]
- 66.Viswanathan A, Rakich SM, Engel C, et al. Antiplatelet use after intracerebral hemorrhage. Neurology. 2006;66(2):206–9. doi: 10.1212/01.wnl.0000194267.09060.77. [DOI] [PubMed] [Google Scholar]
- 67.Lesnik Oberstein SA, van den Boom R, van Buchem MA, et al. Cerebral microbleeds in CADASIL. Neurology. 2001;57(6):1066–70. doi: 10.1212/wnl.57.6.1066. [DOI] [PubMed] [Google Scholar]
- 68.Viswanathan A, Guichard JP, Gschwendtner A, et al. Blood pressure and haemoglobin A1c are associated with microhaemorrhage in CADASIL: a two-centre cohort study. Brain. 2006;129(Pt 9):2375–83. doi: 10.1093/brain/awl177. [DOI] [PubMed] [Google Scholar]
- 69.Werring DJ, Frazer DW, Coward LJ, et al. Cognitive dysfunction in patients with cerebral microbleeds on T2*-weighted gradient-echo MRI. Brain. 2004;127(Pt 10):2265–75. doi: 10.1093/brain/awh253. [DOI] [PubMed] [Google Scholar]
- 70.Viswanathan A, Godin O, Jouvent E, et al. Impact of MRI markers in subcortical vascular dementia: a multi-modal analysis in CADASIL. Neurobiology of Aging. 2008 doi: 10.1016/j.neurobiolaging.2008.09.001. in press. [DOI] [PubMed] [Google Scholar]
- 71.DeCarli C, Fletcher E, Ramey V, Harvey D, Jagust WJ. Anatomical mapping of white matter hyperintensities (WMH): exploring the relationships between periventricular WMH, deep WMH, and total WMH burden. Stroke. 2005;36(1):50–5. doi: 10.1161/01.STR.0000150668.58689.f2. [DOI] [PMC free article] [PubMed] [Google Scholar]