

Abstract
We show that the Confusion Entropy, a measure of performance in multiclass problems has a strong (monotone) relation with the multiclass generalization of a classical metric, the Matthews Correlation Coefficient. Analytical results are provided for the limit cases of general no-information (n-face dice rolling) of the binary classification. Computational evidence supports the claim in the general case.
Introduction
Comparing classifiers' performance is one of the most critical tasks in machine learning. Comparison can be carried out either by means of statistical tests [1], [2] or by adopting a performance measure as an indicator to derive similarities and differences, in particular as a function of the number of classes, class imbalance, and behaviour on randomized labels [3].
The definition of performance measures in the context of multiclass classification is still an open research topic as recently reviewed [4], [5]. One challenging aspect is the extension of such measures from binary to multiclass tasks [6]. Graphical comparison approaches have been introduced [7], but a generic analytic treatment of the problem is still unavailable.
One relevant case study regards the attempt of extending the Area Under the Curve (AUC) measure, which is one of the most widely used measures for binary classifiers but it has no automatic extension to the multiclass case. The AUC is associated to the Receiver Operating Characteristic (ROC) curve [8], [9] and thus proposed formulations were based on a multiclass ROC approximation [10]–[13]. A second class of extensions is defined by the Volume Under the Surface (VUS) approach, which is obtained by considering the generalized ROC as a surface whose volume has to be computed by exact integration or polynomial approximation [14]–[16]. As a baseline, the average of the AUCs on the pairwise binary problems derived from the multi-class problems has also been proposed [17].
Other measures are more naturally extended, such as the accuracy (ACC, i.e. the fraction of correctly predicted samples), the Global Performance Index [18], [19], and the Matthews Correlation Coefficient (MCC). We will focus our attention to the last function [20], which in the binary case is also known as the  -coefficient, i.e., the square root of the average
  statistic
  on
on  observed samples for the
  contingency table of the classification problem.
For binary tasks, MCC has attracted the attention of the machine learning community as a method that summarizes into a single value the confusion matrix [21]. Its use as a reference performance measure on unbalanced data sets is now common in other fields such as bioinformatics. Remarkably, MCC was chosen as accuracy index in the US FDA-led initiative MAQC-II for comparing about 13 000 different models, with the aim of reaching a consensus on the best practices for development and validation of predictive models based on microarray gene expression and genotyping data [22]. A generalization of MCC to the multiclass case was defined in [23], also used for comparing network topologies [24], [25].
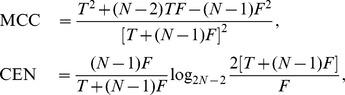
A second family of measures that have a natural definition for multiclass confusion matrices are the functions derived from the concept of (information) Entropy, first introduced in [26]. In the classification framework, measures in the entropy family range from the simpler confusion matrix entropy [27] to more complex functions as the Transmitter Information [28] and the Relative Classifier Information (RCI) [29]. Wei and colleagues recently introduced a novel multiclass measure under the name of Confusion Entropy (CEN) [30], [31]. They compared CEN to both RCI and accuracy, obtaining better discriminative power and precision in terms of two statistical indicators called degree of consistency and degree of discriminancy [32].
In our study, we investigate the intriguing similarity existing between CEN and MCC. In particular, we experimentally show that the two measures are strongly correlated, and that their relation is globally monotone and locally almost linear. Moreover, we provide a brief outline of the mathematical links between CEN and MCC with detailed examples in limit cases. Discriminancy and consistency ratios are discussed as comparative factors, together with functions of the number of classes, class imbalance, and behaviour on randomized labels.
Methods
Given a classification problem on  samples
  and
and  classes
  , define the two functions
  indicating for each sample
  its true class
  and its predicted class
  , respectively. The corresponding confusion matrix is the square matrix
  whose
whose  -th entry
  is the number of elements of true class
  that have been assigned to class
  by the classifier:
The most natural performance measure is the accuracy, defined as the ratio of the correctly classified samples over all the samples:
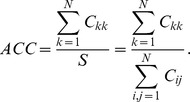 |
Confusion Entropy (CEN)
In information theory, the entropy  associated to a random variable
  is the expected value of the self-information
 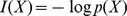 :
:
where  is the probability mass function of
  , with
  for
for  , motivated by the limit
  .
.
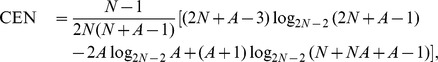
The Confusion Entropy measure CEN for a confusion matrix  is defined in [30] as:
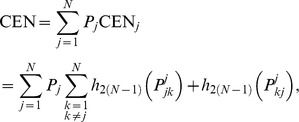 |
(1) |
where  ,
,  ,
,  are defined as follows:
 is the confusion probability of class
  :
: 
 is the probability of classifying the samples of class
  to class
  for
for  subject to class
  :
:
 |
 is the probability of classifying the samples of class
  to class
  subject to class
  :
:
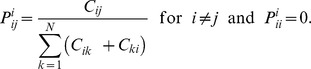 |
For  , this measure ranges between
  (perfect classification) and
  for the complete misclassification case
while in the binary case CEN can be greater than 1, as shown below.
Matthews Correlation Coefficient (MCC)
The definition of the MCC in the multiclass case was originally reported in [23]. We recall here the main concepts. Let 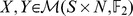 be two matrices where
  if the sample
  is predicted to be of class
  (
( ) and
) and  otherwise, and
  if sample
  belongs to class
  (
( ) and
) and  otherwise. Using Kronecker's delta function, the definition becomes:
Note that  , where
 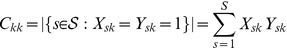 , and, for
  ,
,  .
.
The covariance function between X and Y can be written as follows:
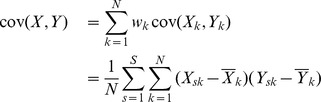 |
where  and
and  and
and  are the means of the
  columns defined respectively as
 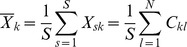 and
and  .
.
Finally the Matthews Correlation Coefficient MCC can be written as:
 |
(2) |
MCC lives in the range  , where
  is perfect classification. The value
  is asymptotically reached in the extreme misclassification case of a confusion matrix
  with all zeros but in two symmetric entries
  ,
,  . MCC is equal to
  when
when  is all zeros but for one column (all samples have been classified to be of a class
  ), or when all entries are equal
  .
.
Relationships between CEN and MCC
As discussed before, CEN and MCC live in different ranges, whose extreme values are differently reached. In Box 1 of Fig. 1, numerical examples are shown for  in different situations: (a) complete classification, (b) complete misclassification, (c) all samples classified as belonging to one class, (d) misclassification case in a very unbalanced situation.
Figure 1. Examples of CEN and MCC for different confusion matrices.

It is worth noting that CEN is more discriminant than MCC in specific situations, although the property is not always welcomed. For instance, in Fig. 1, Box 1(c),  while
while  . Furthermore, as shown in Box 2,
  for constant matrix
  for each
  , regardless of the number of classes
  , while it is easy to show that
  , i.e., CEN is a function of
  . Note that both measures are invariant for scalar multiplication of the whole confusion matrix, so we always set
  in Box 2.
For small sample sizes, we can show that CEN has higher discriminant power than MCC, i.e., different confusion matrices can have same MCC and different CEN. This can be quantitatively assessed by using the degree of discriminancy criterion [32]: for two measures  and
and  on a domain
  , let
, let  and
and  ; then the degree of discriminancy for
  over
over  is
is  . For instance, as in [30], we consider a 3-class case with
  samples respectively: we evaluate all the possible confusion matrices ranging from the perfect classification case
 |
to the complete misclassification case. In this case the degree of discriminancy of CEN over MCC is about 6. Similar results hold for all the 12 small sample size cases on three classes listed in Tab. 6 of [30], ranging from 9 to 19 samples.
We proceed now to show an intriguing relationship between MCC and CEN. First consider the confusion matrix  of dimension
  where
where 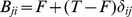 , i.e., all entries have value
  but in the diagonal whose values are all
  , for
, for  ,
,  two integers. In this case,
 |
and thus
This identity can be relaxed to the following generalization, which slightly underestimates CEN:
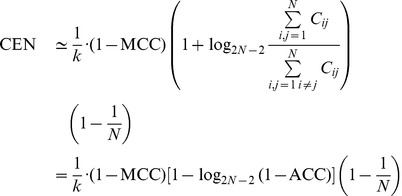 |
(3) |
where both sides are zero when  , and
, and  . For simplicity's sake, we call “transformed MMC” (tMCC) the right member of Eq. 3.
A numerical simulation shows that the tMCC approximation in Eq. 3 holds in a more general and practical setting (Fig. 2). In the simulation, 200 000 confusion matrices  (dimension range: 3 to 30) were generated. For each class
  , the number of correctly classified elements (i.e., the
  -th diagonal element) was uniformly randomly chosen between 1 and 1000. Then the off-diagonal entries were generated as random integers between 1 and
  , where the parameter
  was extracted from the uniform distribution in the range
  , corresponding to small-moderate misclassification. For such data, the Pearson correlation between tMCC and
  CEN is about 0.994.
Figure 2. Dotplots of CEN versus MCC.

(a) and  CEN versus tMCC (b) for 200 000 random confusion matrices of different dimensions.
In order to compare measures, we consider also the degree of consistency indicator [32]: for two measures  and
and  on a domain
  , let
, let  and
and  ; then the degree of consistency
  of
of  and
and  is
is  =
=  . On the given data,
  , while the degree of discriminancy is undefined since no ties occur. In summary, the relation between tMMC and
  CEN is close to linear on this data, with an average ratio of 1.000508 (CI:
  , 95% bootstrap Student).
Comparison on the  family
The behaviour of the Confusion Entropy is instead rather diverse from MCC and ACC for the family of  matrices, where all entries are equal but for a non-diagonal one. Because of the multiplicative invariance, all entries can be set to one but for the leftmost lower corner:
 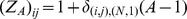 for
for  a positive integer. As shown in Fig. 1, Box 3, when
  grows bigger, more and more samples are misclassified, i.e., the accuracy
  decreases to zero for increasing
  .
.
The MCC measure of this confusion matrix is
which is a function monotonically decreasing for increasing values of  , with limit
  for
for  .
.
On the other hand, the Confusion Entropy for the same family of matrices is
 |
which is still a decreasing function of increasing  , but asymptotically moving towards zero, i.e., to the minimal entropy case. In Box 3 of Fig. 1 we present three numerical examples for
 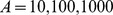 .
.
The dice rolling case
Another pathologic case is found in the case of dice rolling classification on unbalanced classes: because of the multiplicative invariance of the measures, we can assume that the confusion matrix for this case has all entries equal to one but for the last row, whose entries are all  , for
, for  . In this case, the Confusion Entropy is
 |
a decreasing function for growing  whose limit for
  is
is  . As a function of
  , this limit is an increasing function asymptotically growing towards
  . It is easy to see that
  for
for  in this case. More in general, while
  in all those cases where random classification (i.e., no learning) happens, this is lost in the case of CEN, due to its greater discriminant power: there is no unique value associated to the spectrum of random classification problems.
The binary case
In the two-class case (P: positives, N: negatives), the confusion matrix is  , where T and F stand for true and false respectively. The Matthews Correlation Coefficient has the familiar definition [20], [21]:
The Confusion Entropy can be written for the binary case as:
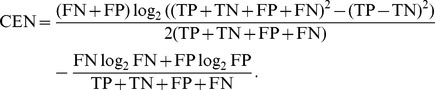 |
Note that in the case  and
and  , we have
and thus  when the ratio
  is smaller than 1. In other words, the confusion matrices
  with
with  have
have  ; the bound is attained for
  , the case of total misclassification. This suggests that CEN should not be used as a classifier performance measure in the binary case. A numerical example is provided in Fig. 1, Box 4, while a plot of CEN and MCC curves for different ratios of
  is shown in Fig. 3.
Figure 3. Lines describing CEN and MCC of a confusion matrix  for increasing ratio
  .
.
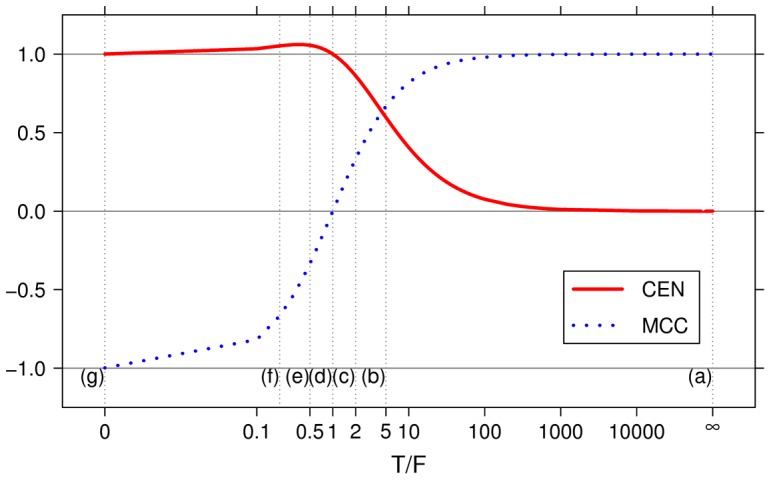
Gray vertical lines correspond to the examples provided in Fig. 1, Box 4.
Indeed, differently from the multi-class case, CEN and MCC are poorly correlated for two classes. We computed MCC and CEN for all the 4 598 125 possible confusion matrices for a binary classification task on  samples (
 ). Results are displayed in Fig. 4, for
  and the cumulative plot with all
  . In this last case, the (absolute) Pearson correlation between the two metrics is only
  .
.
Figure 4. Scatter plots of CEN versus MCC for all the confusion matrices  of binary classification tasks with s = 5,10,50,75 samples and for the cumulative set of all 4 598 125
  matrices with
  .
.

Results and Discussion
We compared the Matthews Correlation Coefficient (MCC) and Confusion Entropy (CEN) as performance measures of a classifier in multiclass problems. We have shown, both analytically and empirically, that they have a consistent behaviour in practical cases. However each of them is better tailored to deal with different situations, and some care should be taken in presence of limit cases.
Both MCC and CEN improve over Accuracy (ACC), by far the simplest and widespread measure in the scientific literature. The point with ACC is that it poorly copes with unbalanced classes and it cannot distinguish among different misclassification distributions.
CEN has been recently proposed to provide an high level of discrimination even between very similar confusion matrices. However, we show that this feature is not always welcomed, as in the case of random dice rolling, for which  , but a range of different values is found for CEN. This case is of practical interest because class labels are often randomized as a sanity check in complex classification studies, e.g., in medical diagnosis tasks such as cancer subtyping [33] or image classification problems (e.g., handwritten ZIP code identification or image scene classification examples) [34].
Our analysis also shows that CEN should not be reliably used in the binary case, as its definition attributes high entropy even in regimes of high accuracy and it even gets values larger than one.
In the most general case, MCC is a good compromise among discriminancy, consistency and coherent behaviors with varying number of classes, unbalanced datasets, and randomization. Given the strong linear relation between CEN and a logarithmic function of MCC, they are exchangeable in a majority of practical cases. Furthermore, the behaviour of MCC remains consistent between binary and multiclass settings.
Our analysis does not regard threshold classifiers; whenever a ROC curve can be drawn, generalized versions of the Area Under the Curve algorithm or other similar measures represent a more immediate choice [35]. This given, for confusion matrix analysis, our results indicate that the MCC remains an optimal off-the-shelf tool in practical tasks, while refined measures such as CEN should be reserved for specific topic where high discrimination is crucial.
Funding Statement
The authors acknowledge funding by the European Union FP7 Project HiperDART and by the PAT funded Project ENVIROCHANGE. The funders had no role in study design, data collection and analysis, decision to publish, or preparation of the manuscript.
References
- 1. Demšar J (2006) Statistical Comparisons of Classifiers over Multiple Data Sets. Journal of Machine Learning Research 7: 1–30. [Google Scholar]
- 2. García S, Herrera F (2008) An Extension on “Statistical Comparisons of Classifiers over Multiple Data Sets” for all Pairwise Comparisons. Journal of Machine Learning Research 9: 2677–2694. [Google Scholar]
- 3. Hand D (2009) Measuring classifier performance: a coherent alternative to the area under the ROC curve. Machine Learning 77: 103–123. [Google Scholar]
- 4. Sokolova M, Lapalme G (2009) A systematic analysis of performance measures for classification tasks. Information Processing and Management 45: 427–437. [Google Scholar]
- 5. Ferri C, Hernández-Orallo J, Modroiu R (2009) An experimental comparison of performance measures for classification. Pattern Recognition Letters 30: 27–38. [Google Scholar]
- 6.Felkin M (2007) Comparing Classification Results between N-ary and Binary Problems. In: Studies in Computational Intelligence, Springer-Verlag, volume 43. pp. 277–301.
- 7. Diri B, Albayrak S (2008) Visualization and analysis of classifiers performance in multi-class medical data. Expert Systems with Applications 34: 628–634. [Google Scholar]
- 8. Hanley J, McNeil B (1982) The meaning and use of the area under a receiver operating characteristic (ROC) curve. Radiology 143: 29–36. [DOI] [PubMed] [Google Scholar]
- 9. Bradley A (1997) The use of the area under the ROC curve in the evaluation of machine learning algorithms. Pattern Recognition 30: 1145–1159. [Google Scholar]
- 10. Everson R, Fieldsend J (2006) Multi-class ROC analysis from a multi-objective optimisation perspective. Pattern Recognition Letters 27: 918–927. [Google Scholar]
- 11.Landgrebe T, Duin R (2005) On Neyman-Pearson optimisation for multiclass classifiers. In: Proceedings 16th Annual Symposium of the Pattern Recognition Association of South Africa. PRASA, pp. 165–170.
- 12.Landgrebe T, Duin R (2006) A simplified extension of the Area under the ROC to the multiclass domain. In: Proceedings 17th Annual Symposium of the Pattern Recognition Association of South Africa. PRASA, pp. 241–245.
- 13. Landgrebe T, Duin R (2008) Efficient multiclass ROC approximation by decomposition via confusion matrix perturbation analysis. IEEE Transactions Pattern Analysis Machine Intelligence 30: 810–822. [DOI] [PubMed] [Google Scholar]
- 14.Ferri C, Hernández-Orallo J, Salido M (2003) Volume under the ROC surface for multi-class problems. In: Proceedings of 14th European Conference on Machine Learning. Springer-Verlag, pp. 108–120.
- 15.Van Calster B, Van Belle V, Condous G, Bourne T, Timmerman D, et al. (2008) Multi-class AUC metrics and weighted alternatives. In: Proceedings 2008 International Joint Conference on Neural Networks, IJCNN08. IEEE, pp. 1390–1396.
- 16.Li Y (2009) A generalization of AUC to an ordered multi-class diagnosis and application to lon-gitudinal data analysis on intellectual outcome in pediatric brain-tumor patients. Ph.D. thesis, College of Arts and Sciences, Georgia State University.
- 17. Hand D, Till R (2001) A Simple Generalisation of the Area Under the ROC Curve for Multiple Class Classification Problems. Machine Learning 45: 171–186. [Google Scholar]
- 18.Freitas C, De Carvalho J, Oliveira J Jr, Aires S, Sabourin R (2007) Confusion matrix disagreement for multiple classifiers. In: Rueda L, Mery D, Kittler J, editors, Proceedings of 12th Iberoamerican Congress on Pattern Recognition, CIARP 2007, LNCS 4756. Springer-Verlag, pp. 387–396.
- 19.Freitas C, De Carvalho J, Oliveira J Jr, Aires S, Sabourin R (2007) Distance-based Disagreement Classifiers Combination. In: Proceedings of the International Joint Conference on Neural Networks, IJCNN 2007. IEEE, pp. 2729–2733.
- 20. Matthews B (1975) Comparison of the predicted and observed secondary structure of T4 phage lysozyme. Biochimica et Biophysica Acta - Protein Structure 405: 442–451. [DOI] [PubMed] [Google Scholar]
- 21. Baldi P, Brunak S, Chauvin Y, Andersen C, Nielsen H (2000) Assessing the accuracy of prediction algorithms for classification: an overview. Bioinformatics 16: 412–424. [DOI] [PubMed] [Google Scholar]
- 22. The MicroArray Quality Control (MAQC) Consortium (2010) The MAQC-II Project: A comprehensive study of common practices for the development and validation of microarray-based predictive models. Nature Biotechnology 28: 827–838. [DOI] [PMC free article] [PubMed] [Google Scholar]
- 23. Gorodkin J (2004) Comparing two K-category assignments by a K-category correlation coefficient. Computational Biology and Chemistry 28: 367–374. [DOI] [PubMed] [Google Scholar]
- 24.Supper J, Spieth C, Zell A (2007) Reconstructing Linear Gene Regulatory Networks. In: Marchiori E, Moore J, Rajapakse J, editors, Proceedings of the 5th European Conference on Evolutionary Computation, Machine Learning and Data Mining in Bioinformatics, EvoBIO2007, LNCS 4447. Springer-Verlag, pp. 270–279.
- 25. Stokic D, Hanel R, Thurner S (2009) A fast and efficient gene-network reconstruction method from multiple over-expression experiments. BMC Bioinformatics 10: 253. [DOI] [PMC free article] [PubMed] [Google Scholar]
- 26. Shannon C (1948) A Mathematical Theory of Communication. The Bell System Technical Journal 27: 379–656, 379-423, 623-656. [Google Scholar]
- 27.van Son R (1994) A method to quantify the error distribution in confusion matrices. Technical Report IFA Proceedings 18, Institute of Phonetic Sciences, University of Amsterdam.
- 28.Abramson N (1963) Information theory and coding. McGraw-Hill, 201 pp.
- 29.Sindhwani V, Bhattacharge P, Rakshit S (2001) Information theoretic feature crediting in multiclass Support Vector Machines. In: Grossman R, Kumar V, editors, Proceedings First SIAM International Conference on Data Mining, ICDM01. SIAM, pp. 1–18.
- 30. Wei JM, Yuan XJ, Hu QH, Wang SQ (2010) A novel measure for evaluating classifiers. Expert Systems with Applications 37: 3799–3809. [Google Scholar]
- 31. Wei JM, Yuan XJ, Yang T, Wang SQ (2010) Evaluating Classifiers by Confusion Entropy. Information Processing & Management Submitted [Google Scholar]
- 32. Huang J, Ling C (2005) Using AUC and Accuracy in Evaluating Learning Algorithms. IEEE Transactions on Knowledge and Data Engineering 17: 299–310. [Google Scholar]
- 33. Sørlie T, Tibshirani R, Parker J, Hastie T, Marron JS, et al. (2003) Repeated observation of breast tumor subtypes in independent gene expression data sets. Proceedings of the National Academy of Sciences 100: 8418–8423. [DOI] [PMC free article] [PubMed] [Google Scholar]
- 34.Hastie T, Tibshirani R, Friedman JH (2003) The Elements of Statistical Learning. Springer.
- 35. Hand D (2010) Evaluating diagnostic tests: The area under the ROC curve and the balance of errors. Statistics in Medicine 29: 1502–1510. [DOI] [PubMed] [Google Scholar]