Abstract
Optimization of targeted cell capture with microfluidic devices continues to be a challenge. On the one hand, microfluidics allow working with microliter volumes of liquids, whereas various applications in the real world require detection of target analyte in large volumes, such as capture of rare cell types in several ml of blood. This contrast of volumes (microliter vs.ml) has prevented the emergence of microfluidic cell capture sensors in the clinical setting. Here, we study the improvement in cell capture and throughput achieved using parallel bioactivated microfluidic channels. The device consists of channels in parallel with each other tied to a single channel. We discuss fabrication and testing of our devices, and show the ability for an improvement in throughput detection of target cells.
Keywords: Microfluidics, Cell capture, Pathogen detection
1 Introduction
Accurate, rapid, and inexpensive analysis and separation of target cells in various biological samples has always been of prime interest in various fields such as medicine, research, food industry, bio-defense, and several others. In medicine and basic biological research, this can include, HIV detection through CD4 cell counting (Cheng et al. 2007), circulating tumor cell isolation (Talasaz et al. 2009; Nagrath et al. 2007; Du et al. 2007), cellular detection biosensors (Javanmard et al. 2007), and stem cell sorting (El-Ali et al. 2006). As an example, in order to detect circulating tumor cells in the blood before cancer metastasis, one must be able to isolate less than 10 cells in 10 ml of blood (Talasaz et al. 2009). In the food industry, pathogen detection, e.g. detection of E. Coli 0157 (Radke and Alocilja 2005) continues to be an important problem. In bio-defense, detection of various cellular contamination agents at low levels with a low false positive rate continues to be a significant challenge. However, typically the procedures required for accurate cellular analysis are either too expensive, complex, or time consuming, or low in throughput (Irmia et al. 2005). These procedures typically also require skilled scientists and technicians to perform the procedure. Avery reliable method for cell separation and analysis is flow cytometry (Nicoletti et al. 1991). The disadvantage of flow cytometry, however, is the high cost associated with the instrumentation and also the expertise required for running the instrumentation. As a result, typically, flow cytometers are mostly found in core facilities.
Pathogen detection currently involves microbiological techniques such as culture enrichment and plating techniques, which can take several days (McClain et al. 1989). In the case of E. Coli 0157:h7 (which continues still to this day being a challenge causing hemorrhagic colitis (Kaper et al. 1998), resulting in death (Mead et al. 1999)) the sample must be pre-concentrated in a sorbitol Maconkey Agar medium and stained for lactose fermentation. This process requires each colony in the sample to be tested individually, taking more than 24 h due to the required incubation time (March and S. Ratnam. J Clinical Microbiol 869 1983). This time consuming process does not fulfill the demands for food inspection, where food needs to be tested rapidly before it gets shipped out.
While microfluidics provides significant promise, targeted cell capture optimization with microfluidic devices continues to be difficult. Microfluidic devices are suitable for working with microliter volumes of liquids, whereas various applications in medicine, biology, food industry, and agriculture, require detection of target cells in large volumes of several milliliters. This large difference in volumes (microliter vs. ml) continues to prevent the emergence of microfluidic cell capture based devices in practical settings.
One pathogen which is clinically of interest to detect in blood is Candida Albicans, particularly for the diagnosis of Candidiasis. Candida Albicans represent the most common fungal pathogens in which humans are affected. Candida species, which are true opportunistic pathogens, invade tissues which typically have the ability to resist invasion, and gain access to blood circulation and deep tissues. Many new clinical syndromes have resulted from the increase of systemic disease caused by Candida species. These species can cause many diseases including haptosplenic candidiasis, Candida peritonitis, and systemic candidiasis. A useful method for diagnosing diseases caused by Candida species is through detecting the presence of Candia species in the patient’s blood sample (Pfaller et al. 1998).
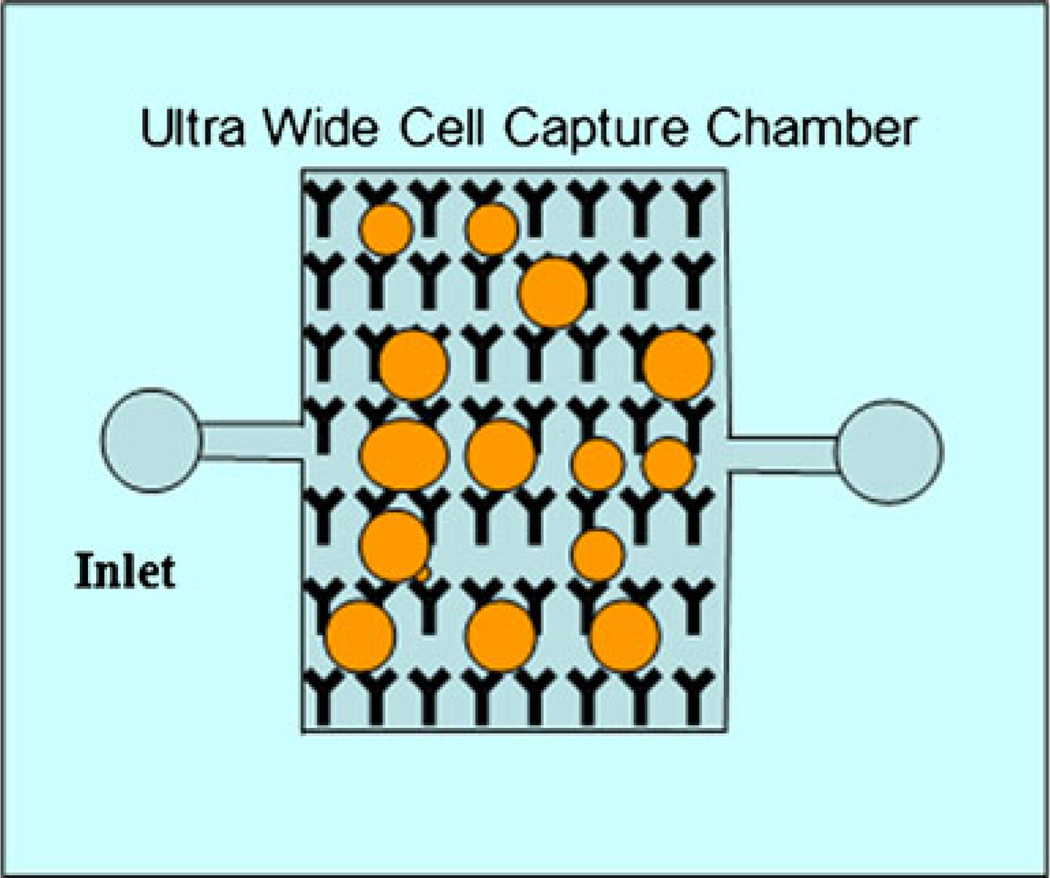
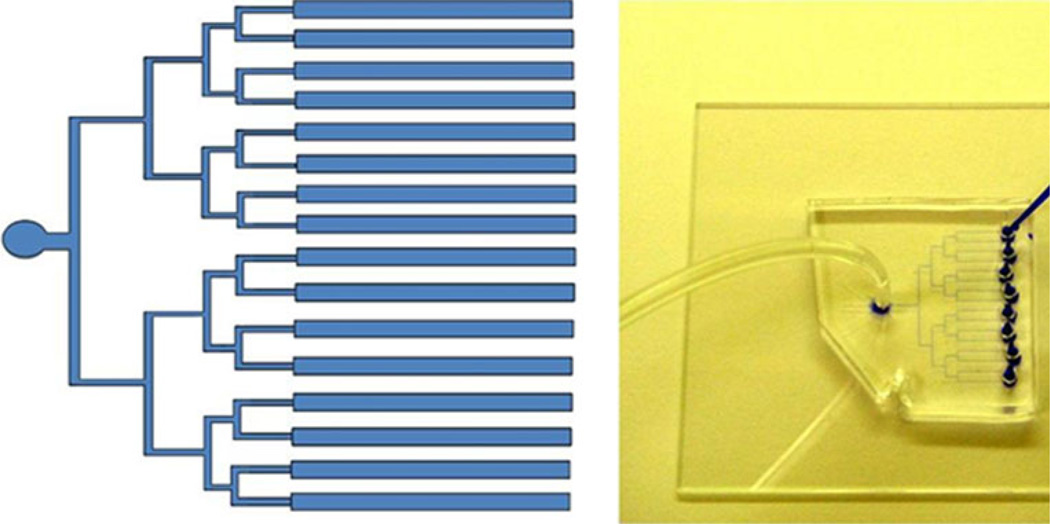
Here we use parallel bioactivated microfluidic channels to improve cell capture efficiency and the speed of sample analysis (Fig. 1). The device consists of channels in parallel with each other tied to a single channel (Fig. 2). Each channel is functionalized with receptor proteins. The parallel architecture allows for high capture rates while using high flow rates. Parallel channels allow low Reynolds number flow and minimize formation of bubbles, something that’s difficult to achieve with several millimeter wide devices. In this paper, we discuss a generalized method for optimizing cell capture in microfluidic devices. Afterwards we discuss fabrication, and testing of our devices, and show the ability for high throughput detection of target cells.
Fig. 1.
Schematic image of ideal ultrawide microfluidic device for capturing cells in large amounts of sample. Antibodies are immobilized on the surface of the channel. Cells are captured as they flow through the device and interact with the surface of the channel. Large width is necessary to process large volumes of fluid
Fig. 2.
Image of parallel channel architecture for capturing cells. Image of 16 channel microfluidic device used for cell capture. Every two channels lead to a well for loading reagents. All channels are tied to a single output where negative pressure is applied. Channels are 25 µm tall and 300 µm wide. Channels fabricated in PDMS and bonded to glass substrate
2 Theory
The rate at which particles are captured in the active area of the sensor is limited by the hit rate of the cells passing through the channel in the active area and the binding kinetics of the surface proteins on the cell surface with the antibodies immobilized on the channel surface. We calculated the hit rate of cells to the wall as they pass through the channel using Monte Carlo simulations of cells undergoing drift resulting from the channel laminar flow and diffusion to Brownian motion of the particle in the channel. The diffusion length and the drift length were calculated for each time step (Δt) in the model. We developed our model for a characteristic E. Coli cell, which has a diameter of 1.2 µm and a diffusion constant of 10−6 cm2/s. To model the diffusion, a randomly oriented displacement of magnitude ld is applied to each cell:
| (2) |
Here D is the diffusion coefficient of E. Coli in water. The velocity profile is calculated in order to determine the hydrodynamic drift of the bead. Constant flow rate is assumed. The microfluidic channel can be approximated as a horizontal pressure-driven flow between stationary parallel plates. Boundary conditions are no-slip. The velocity profile (Ux(y)) of the flow is given by:
| (3) |
where w is the channel width, Q is flow rate, h is the height of the channel, and y is the vertical distance from the channel base. Thus, due to the hydrodynamic drift, the cell is displaced (Ldrift) at each step by
| (4) |
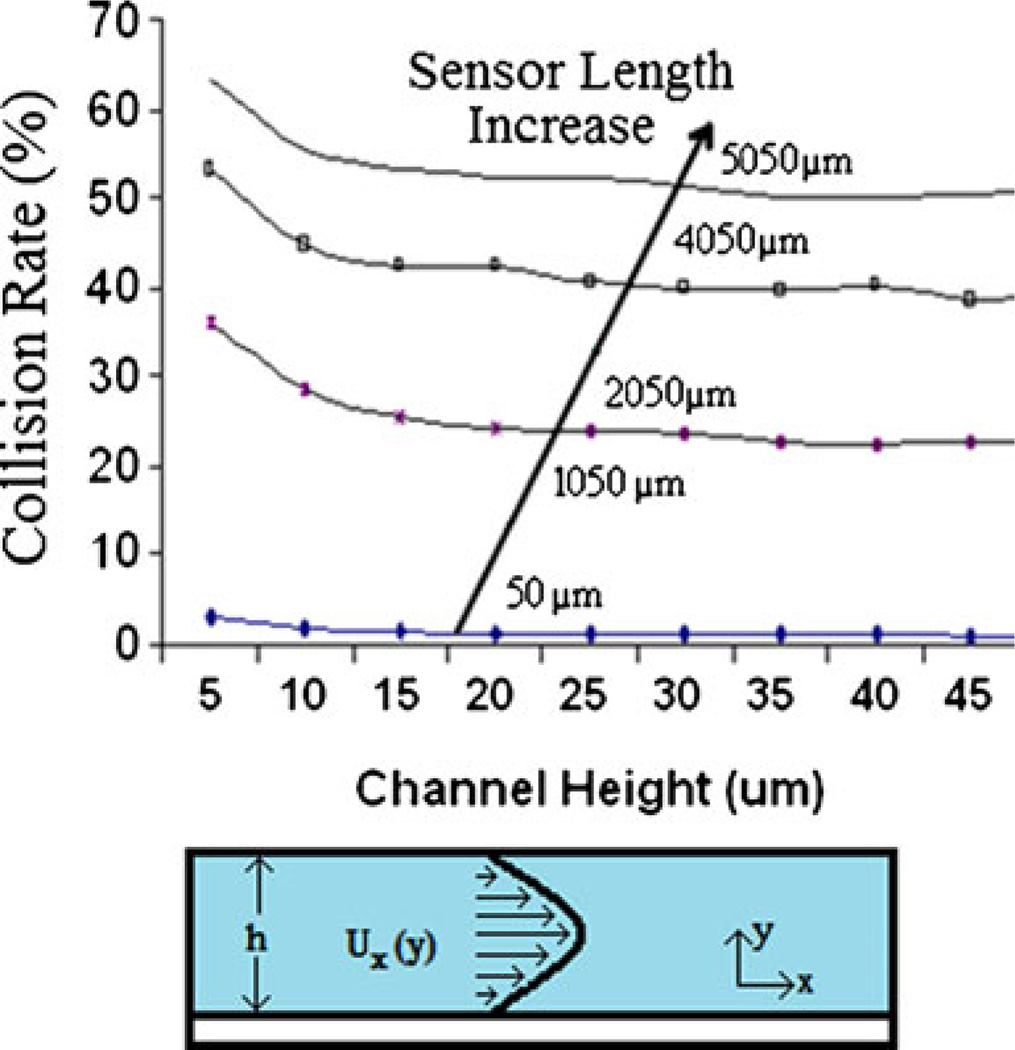
Cells colliding with the channel walls are assumed to be reflected. The relation between cell hit rate and channel height for various active area sizes is plotted (Fig. 3).
Fig. 3.
The collision rate of the 1.2 µm cells are plotted against the channel height for various channel lengths. The main parameter significantly affecting the hit rate is the active area size. An active area of 5050 µm can result in a hit rate greater than 50%
As the channel height is increased beyond 10 µm, there is little decrease in the hit rate of the channel. Since the flow rate is constant, the velocity of the particle decreases as the channel height increases, which explains the modest decrease in the hit rate. This information gives important insight into designing the geometry of the channel, in that it makes it clear that minimizing the channel size is not the best way to optimize the bead hit rate. At smaller channel geometries, non-specific binding of beads and channel clogging become significant. The simulation results, however, indicate that the hit rate of particles is significantly increased with an increasing active area.
3 Materials and methods
3.1 Device fabrication
The microchannel with 200 µm width was fabricated in PDMS (polydimethylsiloxane). The master mold for the microchannel was patterned onto a silicon substrate using SU-8 photoresist. PDMS (10:1 prepolymer:curing agent) was poured onto the master mold and allowed to cure at 75°C for two hours. Once the PDMS channel was formed, it was removed from the mold. Then, two 3 mm holes were punched, one at each end, to serve as the channel’s inlet and outlet ports. The glass chip and the PDMS microchannel were bonded together after oxygen plasma treatment.
3.2 Experimental setup
A 500 µl syringe (Hamilton) was attached to tygon tubing which was attached to the channel inlet. The various buffers in each step were injected into the channel by pipetting directly into the input well. Negative pressure was applied to the output well in order to pull buffer in through the channel. A syringe pump (Harvard Apparatus) was used to control the flow rate through the device.
3.3 Cell culturing and preparation
The wild type of clinical Candida albicans called SC5314 was used from the Canter’s stock at −70°C. The strain was slanted on an YPD (Yeast extract Peptone Dextrose) petri dish (1% yeast extract, 2% bactopeptone, 2% glucose). The YPD dishes were placed in 37°c incubator overnight. One colony was taken out of the petri dish and transferred into 5 ml of YPD in a test tube. The test tube was placed in a 37°C incubator overnight. The optical density of the strain was read at 600 n.m using a spectrophotometer. The number of cells was 1.78 × 10⁷ cells/ml. Saccharomyces Cervisiae was used as negative control in all of the cell capture experiments and the above procedure was applied to measure the cell density. The number of cells was 1.67 × 10⁷ cells/ml.
3.4 Channel surface functionalization
Antibody immobilization is performed by taking a solution of monoclonal anti-Candida Albicans Antibody (abcam) and diluting in Phosphate Buffer Saline by a 1:10 ratio. Antibody solution was injected into the microchannel and incubated for 20 min allowing the antibodies to become physically adsorbed to the surface. A solution of bovine serum albumin (1% BSA) suspended in Phosphate Buffer Saline was introduced into the channels and incubated for 30 min at room temperature to block the nonspecific cell binding.
3.5 Assay procedure
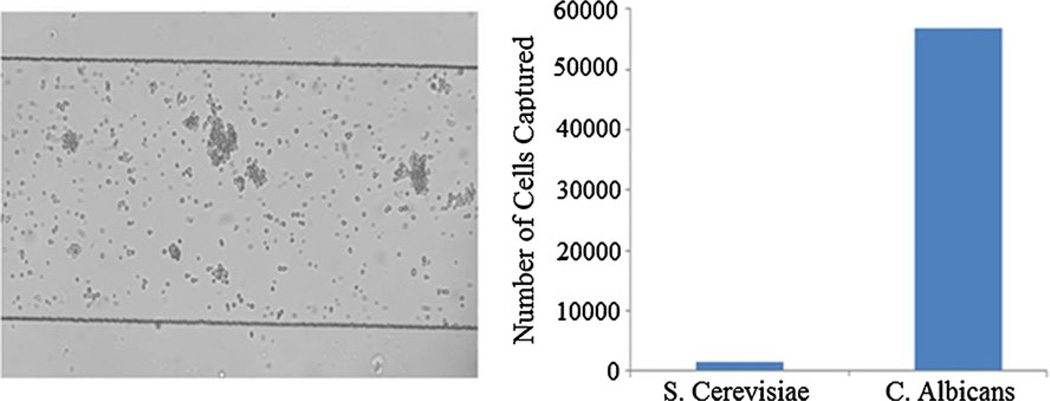
We test our device using cultured pathogenic yeast cells (Candida Albicans) resuspended in Phosphate Buffer Saline (PBS) buffer pH of 7.4 to a concentration of 1 × 10⁵ cfu/ml. Monoclonal antibodies against C. Albicans were immobilized on the base of the channel. We flowed yeast cells through the channels at various flow rates up to several microliters per minute for 15 min. Beads were counted optically under a microscope (Fig. 4). In order to test the selectivity of our platform, we assayed cultured non-pathogenic yeast cells (S. Cerevisiae) resuspended in PBS buffer pH of 7.4. The results of the cell count are plotted in Fig. 4.
Fig. 4.
Sample is injected into microchannel. If Candida Albicans is present, it will bind onto the surface of the channel. Channel width is 300 um and height is 25 um. Each chip consists of 16 parallel 8 mm long channels. Cells flow through the device for 15 min. After cells have bound, a flow is applied so that the unbound cells are washed off. Specifically bound cells are counted optically to quantification. After 15 min of flowing, beads are counted optically. As a control experiment we separately assayed a sample containing S. Cerevisiae and compared the cell counts for the two samples. The amount of S. Cerevisiae binding to the surface compared to the C. Albicans is negligible
3.6 Flow rate dependance
We tested our assay over several different conditions in order to determine the throughput potential of the system. First we looked at different numbers of channels in parallel to each other. We looked at 1, 4, 8, and 16 channels in parallel. We inject cells continuously into our microchannels for 15 min at a flow rate of 3 µl/min. The cell capture rate for each is plotted in Fig. 5. Surprisingly, the increase in cell capture rate relative to increase in the number of channels is not linear and a saturation effect occurs with more channels. A possible explanation for this is that as the number of channels increases and the flow rate is kept constant, the velocity of the cells decreases. They therefore tend to settle at the bottom of the well instead of entering the channel. Resolving this problem would require, either working at a higher flow rate or designing the sample injection method such that settling of the cells is minimized.
Fig. 5.
Cells captured per unit area as a function of number of parallel channels
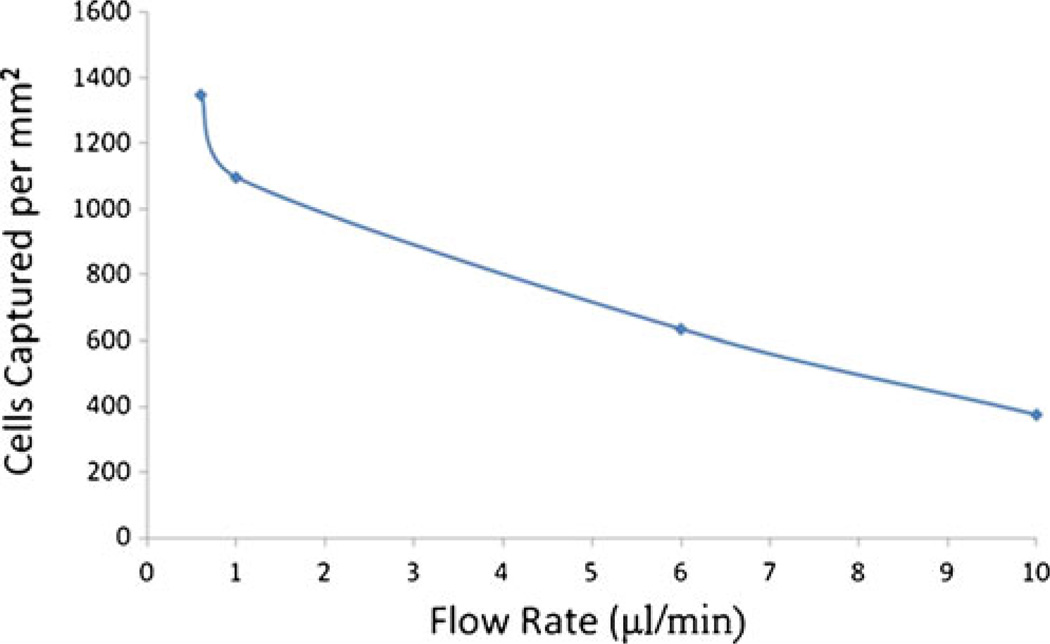
We also examined the capture rate of cells relative to the flow rate. We tested a series of flow rates ranging from 0.5 µl/min to 10 µl/min. Cell capture rates, vs. volumetric flow rate is plotted in Fig. 6. As one would expect, higher flow rate results in lower capture rates.
Fig. 6.
Cells captured per unit area as a function of flow rate
3.7 Complex biological mixture
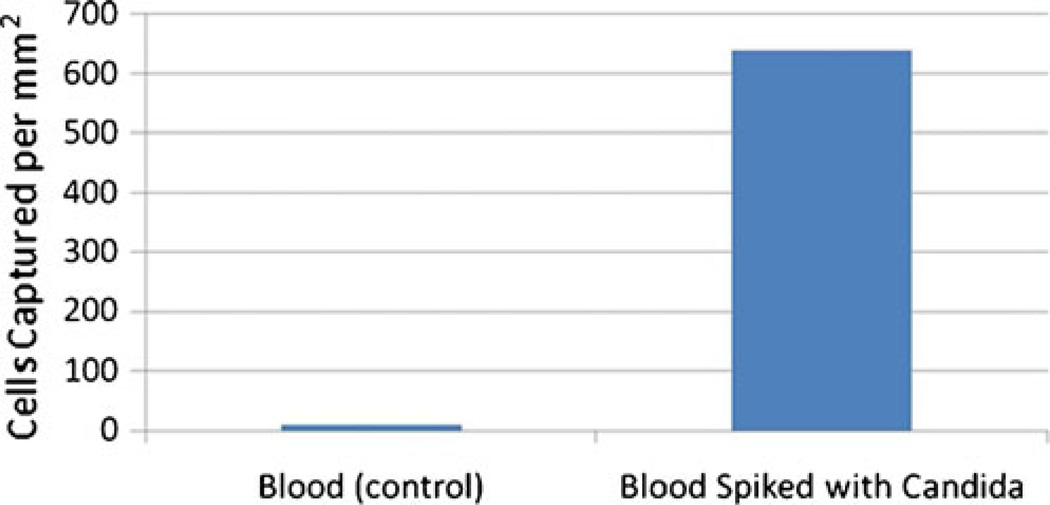
In order to demonstrate the ability of our device to detect target cells in a complex mixture, we introduced Candida Albicans cells into sheep blood at a concentration of 105 cells/ml. The results are plotted in Fig. 7.
Fig. 7.
Cells captured per unit area for blood spiked with Candida Albicans
4 Conclusion
In conclusion, we have developed a microfluidic platform capable of capturing target cells selectively at flow rates of several microliters per minute. The capturing performance is limited by the the diffusion of the cells to the surface and the rate of the reaction kinetics. The channel height, width, and length, and the number of channels in parallel can all be adjusted to maximize the capture rate of the target cells.
With our current implementation, one bottleneck preventing the increase in number of channels to result in better cell capture rate is due to cells settling at the bottom of the input well. This can be solved if one ties all of the parallel channels to a single input well, and has the cells entering through a tube rather than a well. We plan on implementing this modification to improve device performance in the next generation of the device. Using the current devices, we have fabricated a flow rate of 10 µl/min results in a capture rate of 400 cells/mm2, when we have an initial concentration of 107 cells/ml. After 15 min, roughly 1,500,000 cells have flowed through the device. This means that a total of ~96000 cells were captured in an 8 channel device, which is about 6.4% of the cells that have passed through. Further improvements to this sensitivity can be made using the optimizations above. This inexpensive platform can potentially be integrated with an inexpensive CMOS image sensor and can be used in a portable device to perform multiplexed detection for use in high throughput cellomics applications.
Acknowledgement
This research was supported by National Institutes of Health Grant P01 HG000205.
Contributor Information
Mehdi Javanmard, Email: mehdij@stanford.edu, Stanford Genome Technology Center, Stanford University Stanford, Stanford, CA, USA.
Farbod Babrzadeh, Stanford Genome Technology Center, Stanford University Stanford, Stanford, CA, USA; Department of Biotechnology, AlbaNova University Center, KTH, Stockholm, Sweden.
Pål Nyrén, Department of Biotechnology, AlbaNova University Center, KTH, Stockholm, Sweden.
Ronald W. Davis, Stanford Genome Technology Center, Stanford University Stanford, Stanford, CA, USA
References
- Cheng X, Irimia D, Dixon M, Sekine K, Demirci U, Zamir L, Tompkins RG, Rodriguez W, Toner M. Lab Chip. 2007;7:170–178. doi: 10.1039/b612966h. [DOI] [PMC free article] [PubMed] [Google Scholar]
- Talasaz AH, Powell AA, Huber DE, Berbee JG, Roh K-H, Yu W, Xiao W, Davis MM, Pease RF, Mindrinos MN, Jeffrey SS, Davis RW. Proc Natl Acad Sci. 2009;106:3970–3975. doi: 10.1073/pnas.0813188106. [DOI] [PMC free article] [PubMed] [Google Scholar]
- Nagrath S, Sequist LV, Maheswaran S, Bell DW, Irimia D, Ulkus L, Smith MR, Kwak EL, Digumarthy S, Muzikansky A, Ryan P, Balis UJ, Tompkins RG, Haber DA, Toner M. Nature. 2007;450:1235–1239. doi: 10.1038/nature06385. [DOI] [PMC free article] [PubMed] [Google Scholar]
- Du Z, Cheng K, Vaughn M, Collie N, Gollahon L. Biomedical Microdevices. 2007;9:35–42. doi: 10.1007/s10544-006-9010-x. [DOI] [PubMed] [Google Scholar]
- Javanmard M, Talasaz AH, Nemat-Gorgani M, Pease F, Ronaghi M, Davis RW. Biomicrofluidics. 2007;1:044103–044110. doi: 10.1063/1.2815760. [DOI] [PMC free article] [PubMed] [Google Scholar]
- El-Ali J, Sorger PK, Jensen KF. Nature. 2006;442:403–411. doi: 10.1038/nature05063. [DOI] [PubMed] [Google Scholar]
- Radke SM, Alocilja EC. Biosens Bioelectron. 2005;20:1662–1667. doi: 10.1016/j.bios.2004.07.021. [DOI] [PubMed] [Google Scholar]
- Irmia D, Toner M. Annu. Rev. Biomed. Eng. 2005;7 doi: 10.1146/annurev.bioeng.7.011205.135108. [DOI] [PMC free article] [PubMed] [Google Scholar]
- Nicoletti I, Migliorati G, Pagliacci MC, Grignani F, Riccardi C. J Immunol Methods. 1991;139:271–279. doi: 10.1016/0022-1759(91)90198-o. [DOI] [PubMed] [Google Scholar]
- McClain D, Lee W. Maryland: Beltsville; 1989. [Google Scholar]
- Kaper JB, O’Brien AD. Escherichia coli O157:H7 and other Shiga toxin-producing E. coli strains. Washington D.C: ASM Press; 1998. [Google Scholar]
- Mead P, Slutsker L, Dietz V, McCaig L, Bresee J, Shapiro S, Griffin P, Tauxe R. Emerg Infect Dis. 1999;5:607. doi: 10.3201/eid0505.990502. [DOI] [PMC free article] [PubMed] [Google Scholar]
- March SB, Ratnam S. J Clinical Microbiol. 1983;869 doi: 10.1128/jcm.23.5.869-872.1986. [DOI] [PMC free article] [PubMed] [Google Scholar]
- Pfaller MA, Jones RN, Messer SA, Edmond MB, Wenzel RP. Diagn Microbiol Infect Dis. 1998;31:327–332. doi: 10.1016/s0732-8893(97)00240-x. [DOI] [PubMed] [Google Scholar]


