

Abstract
Cell-wall mechanical properties play a key role in the growth and the protection of plants. However, little is known about genuine wall mechanical properties and their growth-related dynamics at subcellular resolution and in living cells. Here, we used atomic force microscopy (AFM) stiffness tomography to explore stiffness distribution in the cell wall of suspension-cultured Arabidopsis thaliana as a model of primary, growing cell wall. For the first time that we know of, this new imaging technique was performed on living single cells of a higher plant, permitting monitoring of the stiffness distribution in cell-wall layers as a function of the depth and its evolution during the different growth phases. The mechanical measurements were correlated with changes in the composition of the cell wall, which were revealed by Fourier-transform infrared (FTIR) spectroscopy. In the beginning and end of cell growth, the average stiffness of the cell wall was low and the wall was mechanically homogenous, whereas in the exponential growth phase, the average wall stiffness increased, with increasing heterogeneity. In this phase, the difference between the superficial and deep wall stiffness was highest. FTIR spectra revealed a relative increase in the polysaccharide/lignin content.
Introduction
Plant cells are surrounded by a wall, which can vary in thickness from 0.1 to several μm according to the phase of growth and the type of cell. It is composed of interconnecting molecules of cellulose, hemicelluloses, pectin, and lignin. The cell wall furnishes plants with physical support and protects them from environmental stress. The mechanical properties of the cell wall play a pivotal role in the growth of plants. Also, stiffness of the cell wall has been proposed to play a major role in control of the cell expansion rate, with low values being proposed as a precondition for cell growth and cell-wall expansion (1–3). However, very little is known regarding the cell wall nanomechanics and its growth-related dynamics. This is essentially due to the lack of an appropriate method that could reveal surface and in-depth wall properties at nanometer resolution in living plant cells. Also, although growth-related changes in the mechanical properties of the cell wall reflect structural changes in its constituent polymers, the interrelationship between these parameters is poorly understood at the molecular level. At the macroscopic level, the elastic moduli of plant cell walls of different compositions have been determined mainly by tensile or bending tests (4–8). Using atomic force microscopy (AFM), it is now possible to characterize the nanomechanical properties of living cells under near-physiological conditions (9). However, as yet, the technique has not been widely applied to measure the elastic properties of plant cells (10–13). It also should be mentioned that AFM has been used to measure the elastic modulus of extracted walls from cotton, soybean, rice, and wheat (14), but interpretation of these results is limited, since AFM nanomechanics analysis has not been performed on living tissues.
Arabidopsis is a frequently used experimental model for higher plants: not only has its genome been fully characterized, but full-genome DNA chips are available for quantifying the mRNA levels of specific genes and their mutants, and this plant is therefore considered a powerful model for cell-wall research (15). Furthermore, the availability of Arabidopsis as suspensions of single cells facilitates noninvasive AFM imaging. In this study, AFM was used to monitor changes in the elasticity of the cell wall of suspensions of Arabidopsis thaliana during the different phases of growth, namely, after 4, 7, 10, 13, 17, and 20 days of culturing. For the first time that we know of, using single cells of a higher plant, we used a new technique, stiffness tomography (16), to map the wall stiffness distribution as a function of depth (see Fig. 1). The changes in the nanomechanical properties of the cell wall that were observed by this AFM imaging technique during the different growth phases were correlated with those in structure, which were revealed by Fourier-transform infrared (FTIR) spectroscopy. Using this latter tool, it is possible to identify the functional groups that typify (fingerprint) specific compounds. We monitored changes in the spectra that characterize the bonds comprising polysaccharides and lignin.
Figure 1.
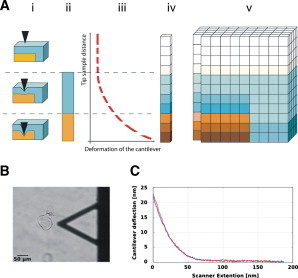
(A) Schematic representation of stiffness-tomography imaging by AFM. The tip of the cantilever is pushed into the sample under controlled conditions, thereby causing its indentation. The resulting deformation of the cantilever is monitored. This information is used to construct a stiffness profile of the sample as a function of penetration depth (z-position). i, Position of the tip according to the sample; ii, Profile of the indented spot of the sample (stiffness is coded by different color/gray values); iii, FD curve displaying the deformation of the cantilever as a function of the position of the tip (dashed line represents segments fitted with the Hertz model); iv, Calculated Young’s modulus of the indented spot; v, reconstructed 3D stiffness tomography matrix of the sample. (B) Optical image of a typical A. thaliana cell. The shadow of the AFM cantilever is visible on the right-hand side of the image. (C) A typical FD curve recorded on a medium-sized Arabidopsis cell.
Materials and Methods
Suspension cultures of A. thaliana
Cell suspensions of cultured A. thaliana (ecotype Columbia) were kindly provided by the Department of Plant Molecular Biology at the University of Lausanne. The cells were cultured in Gamborg’s B5 medium including vitamins (Duchefa Biochemie (Haarlem, The Netherlands) or Sigma (St. Louis, MO)) and containing sucrose (1.5%), 2,4-D (0.1 mg L−1) and kinetin (1 mg L−1), pH 5.7. The cells were subcultured once a week by transferring 20 ml of the suspension to a 500-ml Erlenmeyer flask containing 200 ml of fresh medium. They were grown at 22°C under conditions of continuous light (150 μmol m−2 s−1) and constant agitation (140 rpm). The density of the cell culture was determined spectrophotometrically by measuring the adsorption of chlorophyll a (λ = 646 nm). The cells were sampled for stiffness measurements and for the isolation of cell walls on days 4, 7, 10, 13, 17, and 20. The pH value of the growth medium was measured at each juncture.
Measurement of the elastic (Young’s) modulus of the cell wall by AFM
Before AFM analysis in a Bioscope I (Bruker, Billerica, MA), the cells, suspended in growth medium, were deposited upon glass coverslips that had been pretreated with poly-l-lysine (0.1 mg·ml−1). For the analysis, we used standard silicon nitride triangular cantilevers with a semi-opening angle of 20° on average and a nominal spring constant of 0.06 N·m−1 (DNP, Tokyo, Japan; http://www.brukerafmprobes.com). The tips we used for these experiments had a nominal radius of curvature of 20 nm. The precise spring constant of each cantilever was measured by applying thermal-noise methodology (17) and using Nanoscope 4.43 software. The deflection sensitivity was determined before the experiments by recording a set of force-distance (FD) curves over the petri dish. FD curves were successively recorded over the surface of the sample using the force-volume imaging mode with a maximum force of 1.4 nN. An FD curve monitors the deformation of the cantilever as its tip indents (or penetrates) the sample. The processing of these curves using specific mathematical models permits a determination of the mechanical properties of the sample. In our study, the scan size was set at 5 × 5 μm or 2 × 2 μm with a pixel resolution of 32 × 32 (viz., 32 × 32 FD curves were recorded per force volume file). Additional topographic images were recorded in the classical contact mode with a resolution of 512 × 512 pixels.
Since AFM microscope manufacturers do not provide software dedicated to process force-volume files, we developed our own computational tools to extract stiffness tomography data from the native force-volume files (18). The software was developed in Python language and accepts, in its present version, force-volume data of different microscopes such as Bruker, Park (Santa Clara, CA), and JPK (Berlin, Germany). It detects the point of contact between the tip and the sample using a first-order fit of the off-contact part of the approach curve. The stiffness is then computed according to either Sneddon or Hertz models. A more detailed description of the software can be found at lpmv.epfl.ch/openfovea.
Stiffness-tomography imaging permits a mapping of the mechanical properties of the different layers that are encountered by the tip during its indentation of the sample (Fig. 1 A). This imaging mode is based on the segmentation of the FD curve (Fig. 1 C) in small segments of 1–100 nm long that are analyzed separately according to the Hertz model (19). The length of the segments is adjusted according to the indentation depth, the FD curve resolution, and its noise. In this study, the segment size was fixed at 10 nm. A Young’s modulus value is calculated for each of the segments composing the FD curve. Eventually each segment’s Young’s modulus value is inserted into a 3D matrix representing the observed sample. This matrix can be displayed as a 3D volume or sliced along arbitrary planes to highlight the mechanical properties of the surface or the interior of the sample.
All AFM measurements were performed on living cells, in liquid, at two locations on the cell surface, 5–10 μm apart. At each sampling time, the force-volume measurements were made on cells that fell into three size (diameter) categories: small (∼15 μm), medium (∼50 μm), and large (∼80 μm).
It should be noted again that in this study we used the Hertz model to fit data obtained by stiffness-tomography imaging. The limitations of this model applied to our technique were explored by indenting a 2 MPa polydimethylsiloxane reference material kindly provided by Bruker. These experiments have shown a slight underestimation of the stiffness for segments collected in the deeper parts of the sample: the Young’s modulus was measured to be 1.9 MPa ± 0.3 at 10 nm depth, 1.4 MPa ± 0.2 at 30 nm, and 0.7 MPa ± 0.1 at 50 nm. These errors are inherent to the use of the Hertz model in stiffness tomography data interpretation and affect all the samples in a similar way. Therefore, in this work, some caution should be taken with absolute stiffness values recorded in the deeper parts of the sample. It should be emphasized that this bias does not affect relative values, their distribution, or their evolution as a function of time.
Isolation and purification of cell walls
The cells were lyophilized and pulverized. Cell walls were extracted by mixing the powder with 80% methanol at ambient temperature for 30 s at 4.5 m/s in a FastPrep apparatus (MP Biomedicals, Santa Ana, CA). After centrifugation (1500 × g for 5 min), the pellet was reextracted twice with 80% methanol before being washed according to the methodology described by Strack et al. (20) and Chen et al. (21). This involved a resuspension and 30-min wash of the pellet in 1 M NaCl, then in 0.5% Triton X-100, and three washes first in distilled water, then in 100% methanol, and finally in 100% acetone. The isolated cell walls were then dried in a vacuum.
FTIR spectroscopy of the isolated cell walls
The FTIR spectra of the isolated cell-wall samples were recorded in transmittance mode with the KBr pellet technique, using a Nicolet 6700 spectrometer (Thermo Scientific, Waltham, MA).
Confocal microscopy and measurement of the cell-wall thickness
We used Zeiss LSM 410 confocal laser scanning system based on an Axiovert 135M inverted fluorescence microscope in transmission and fluorescence modes. The excitation source was an Ar-ion laser at 488 nm, a dichroic mirror for 510 nm, and a long-pass emission filter above 560 nm. Scanning time for a 512 × 512-pixel image was 16 s, which showed an area of 127.8 × 127.8 μm. The lateral resolution was 0.229 μm using the 100/1.3 objective with immersion oil. The Arabidopsis cells were stained overnight with freshly prepared 1% aqueous Congo Red solution (Standard Fluka, Sigma) and rinsing in distillated water (10 min, 3 times). Congo red stains cell-wall polymers, predominantly cellulose, and thus makes the cell wall visible.
Statistical analysis of data
A two-way ANOVA was used for comparison of the average stiffness values from various sampling dates and the average stiffness values at various cell-wall depths, as well as to see whether there is interaction between the sampling dates and cell-wall depths. In cases where there was a difference of the average values on various days or at various depths, as well as where interaction was found between them, a Duncan test was used for post hoc comparison of the average stiffness values on sampling days for different depths, as well as at different depths for various days. The Duncan test was also used for comparison of cell-wall thickness among various time points.
Results
Temporal changes in the optical density and the pH of the Arabidopsis thaliana cultures are depicted in Fig. 2. The optical density of the cultures correlates positively with cell growth (this term comprises both proliferation and enlargement). Three distinct phases are apparent: a slow growth phase until day 7, then a rapid, presumably exponential phase, between days 7 and 10, and finally a stationary phase during days 13–20. The pH value of the medium progressively rose between days 0 (5.7) and 17 (8.0).
Figure 2.
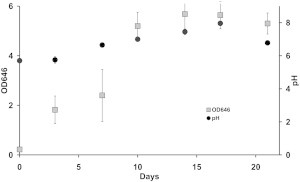
Growth curve of a suspension culture of A. thaliana, monitored by temporal changes in optical density at a wavelength of 646 nm (OD646) and pH-monitored with the passage of time in culture. The error bars represent standard errors of the repeated optical absorbance measurements for each sample.
Fig. 1 B illustrates the appearance of a single cell in an inverted optical microscope after its attachment to a glass coverslip. Such optical images permitted us to estimate the size of each cell and to position the tip of the cantilever at the desired location on its surface for further AFM exploration.
Cell stiffness (Fig. 3) was measured as a function of culturing time and thus of the phase of growth. At each sampling time, the measurements were made on cells that fell into three size categories—small, medium, and large (Fig. S1 in the Supporting Material). Since the results seemed not to be influenced by the size of the cells, the pooled values for the three categories are represented. Special attention was given to the influence of the cell-wall thickness on the AFM measurments. Finite-elements simulation demonstrated a minimal influence of this parameter on the results, as discussed later in this section (Fig. S4). The force-volume files were processed to obtain stiffness values (Young’s modulus) down to a maximal depth of 80 nm from the cell surface. In Fig. 3, stiffness distributions down to a depth of 10 nm are represented graphically in the form of histograms and corresponding surface-stiffness maps are given in false colors (insets: blue, soft pixel; red, hard pixel) for each sampling time. Stiffness histograms display the number (y axis) of pixels (i.e., FD curves) that have a given stiffness (x axis) in a force-volume data file. After four days of culturing, the stiffness of the cell wall was fairly low (maximally 0.6 MPa) and the corresponding distribution curve was narrow. On days 7, 10, and 13, the stiffness-distribution curves broadened significantly, and higher maximal values were achieved (1 MPa); hence, soft and hard regions coexisted within a 10-nm depth of the cell wall. Between days 7 and 10, the cells underwent rapid growth, whereas on day 13 they were in a state of transit between the rapid-growth and stationary phases. The coexistence of soft and hard regions could thus be accounted for by the introduction or reorganization of stiffer material during the cell-expansion phase. On days 17 and 20 (stationary phase of growth), the stiffness-distribution curves again narrowed, with a shift toward lower values. This phenomenon could reflect an expulsion or a reorganization of the harder material. These temporal changes in stiffness distribution are more readily apparent in the color-coded stiffness maps in Fig. 3 (insets). Here, the blue tones (i.e., soft areas) dominate at days 4, 17, and 20, whereas stiff domains (red) predominate at days 7, 10, and 13. Stiffness maps and histograms were also calculated for various cell-wall depths between 0 and 80 nm. The pattern of the stiffness change with growth phases was similar for all depths, and a higher heterogeneity in the deeper wall layers was observed as well (Fig. S2).
Figure 3.
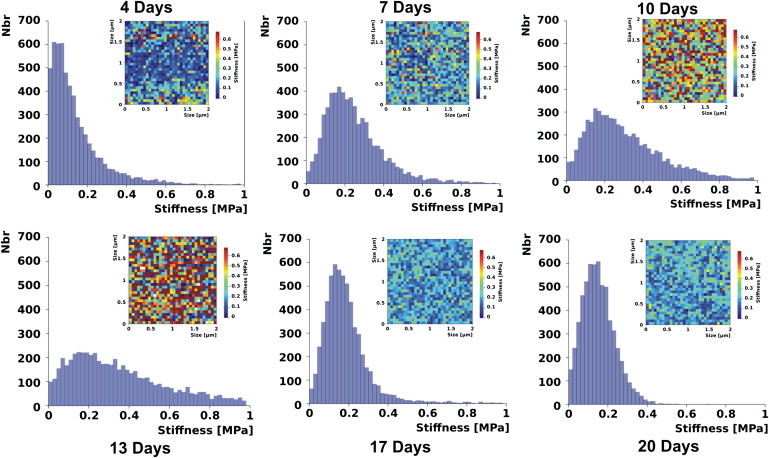
Cell-wall stiffness profiles of suspension cultures of A. thaliana down to an indentation depth of 10 nm after 4, 7, 10, 13, 17, and 20 days of cultivation. The histograms are constructed by pooling stiffness values obtained on three cell categories (six cells in total). Each graph corresponds to 6 × 1024 FD curves obtained on the three cell categories, with each cell sampled at two different locations. The insets correspond to a single 2 μm × 2 μm stiffness map recorded on a medium-sized cell, arbitrarily chosen for illustration among the recorded data set.
The histogram in Fig. 4 represents the average stiffness of a volume of 2000 × 2000 × 80 nm (stiffness of an area of 2 × 2 μm averaged between 0 and 80 nm in depth) as a function of time. Its value changed during the growth period studied (Fig. 4), showing a rise in stiffness in the period from days 4 to 10 and a subsequent decrease between days 13 and 20. This histogram was obtained by averaging the stiffness for the small, medium and large cells. The Duncan test demonstrated that the average stiffness value on day 10 is significantly different from those measured on all the other dates. Also, the average stiffness values on both days 7 and 13 are significantly different from those on all the other days. Finally, the average stiffness values on both days 4 and 17 are significantly different from those on all the other days. Only minor differences in the distribution of elasticity were observed between the two locations on each cell. Since neither the surface location nor the size of the cells influenced the temporal patterns of stiffness distribution, the phenomenon can be deemed to be governed exclusively by the phase of growth.
Figure 4.
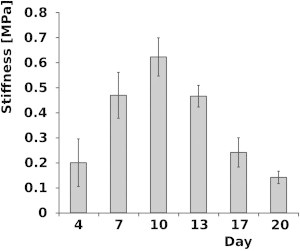
Average stiffness of the cell wall (down to an indentation depth of 80 nm) as a function of cultivation time.
Fig. 5 represents the average cell-wall stiffness as a function of the depth between 0 and 80 nm, for different times of cell cultivation. The stiffness was measured in the volumes of 2000 × 2000 × 10 nm, i.e., stiffness of slices of 2 × 2 μm and 10 nm thick (averaged values for the three cell-size categories). On days 7 and 10 (exponential phase), the average stiffness of the slices increased progressively down to a depth of 30 nm, with maximal values of 0.7 MPa and 1 MPa, respectively, being achieved at these two junctures. The Duncan test was used as a comparison to determine the significance of the difference between average stiffness values versus depths for each measurement day. As can be seen in Fig. 5, days 7, 10, and 13 of cellular cultivation show significant rises in stiffness values at an average depth of 20–30 nm. On days 4, 17, and 20 of cultivation, the average stiffness difference between various depths is not significant. The approximate stiffness value was 0.2 MPa.
Figure 5.
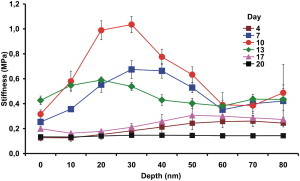
Changes in average cell-wall stiffness (± SE) as a function of indentation depth, on the 4th, 7th, 10th, 13th, 17th, and 20th days of culture. The averaged values for the three size categories (small, medium, and large) are presented. The dots indicating experimental points are connected with lines for visual clarification.
The thickness of the cell wall is an additional parameter that can influence the mechanical properties of Arabidopsis cells. To estimate its importance we first measured cell-wall thickness as a function of growing stage by confocal microscopy. It appeared that the thickness varies between 1.2 and 2.1 μm, with a minimum on days 4, 17, and 20 and a maximum on day 10 (Fig. S3). To estimate the extent to which such variations influence the AFM measurements, we conducted finite-element simulations that demonstrated that on our cells the cell-wall thickness parameter (which was set to vary between 1.2 and 2 μm) influences the stiffness measurements in a range of 70 kPa (Fig. S4). This is lower than the stiffness differences we obtained by AFM measurements on living cells (150–280 kPa, Fig. 4). It indicates that cell-wall thickness variations during cell growth can partly influence the cell-wall stiffness, but there is also considerable effect of other parameters, such as modifications in chemical composition and/or polymerization state of the wall.
The FTIR spectra of the cell walls at each sampling time (Fig. 6) revealed the presence of bands that are characteristic of both lignin and polysaccharides. The band at 1030 cm−1 (C-O, C-C, C-C-O vibration) and that at 1060 cm−1 (C-O, C-C, O-C-H vibration) have been assigned to the glycosidic link in cellulose, xyloglucan, and pectic polysaccharides (polygaracturonate or pectinate). The band at 1060 cm−1 was absent from the cell walls on day 4, but appeared thereafter. The band at 1160 cm−1 (C-O-C vibration) has been likewise assigned to the glycosidic link in cellulose, xyloglucan, and pectic polysaccharides, whereas that at 1245 cm−1 (C-O vibration) is characteristic of pectin (22,23). The small peak at 1330 cm−1, which was most pronounced in the cell walls between days 10 and 20, has been assigned to the condensed rings in the monomer units of lignin (24,25). The band at 1425 cm−1, which is characteristic of C-H stretch in the CH2-groups of cellulose (22,24,25), was most pronounced in the cell walls between days 13 and 20. The 1530–1540 cm−1 band has been assigned to an aromatic ring stretching in lignin, and is considered to be the most characteristic feature of this macromolecule. The vibration between 1635 cm−1 and 1650 cm−1 is characteristic of the C=C bond in both the ring and the phenylpropanoid monomer side chains of lignin (24–26). The band at 1740 cm−1 originates from the C=O bond in ester groups (23–25) and is characteristic of polysaccharides. In the region between 2500 cm−1 and 4000 cm−1 (Fig. 6 A, inset) the band at 2900 cm−1 and the broad, unstructured band at ∼3400 cm−1 correspond to the CH- and OH- bonds, respectively, characteristic of phenols and alcohols (here of the lignin origin). The 2D presentation of the FTIR spectra, in the form of a heat map (Fig. 6 B), clearly shows decrease in the lignin component during the cell growth cycle and predominance of the polysaccharide component between days 13 and 20 of growth.
Figure 6.
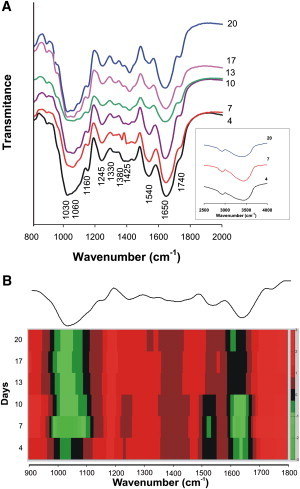
(A) FTIR spectra of the cell walls of A. thaliana, isolated from suspension cultures on the indicated days of cultivation. (B) The data from the subfigure A are shown in the form of a heat map. The absorbance value for each wavenumber divided by the sum of the column of all values for that wavenumber is shown using the color code shown at the right side of the figure. An average spectrum is shown at the top of the figure.
The ratio between the characteristic lignin and polysaccharide peaks in a spectrum has been acquired as a basis to estimate lignin content relative to the content of polysaccharides in a cell wall (27–29). The peak-height ratios at 1540/1160 cm−1, 1540/1425 cm−1, and 1540/1740 cm−1 (Table 1) are used to estimate lignin content relative to that of cellulose + XG + pectic polysaccharides and that of cellulose and esters (of polysaccharide origin), respectively, in the cell walls. The values of all three ratios progressively decreased with an increase in culturing time, which reflects a gradual increase in the content of polysaccharides relative to that of lignin.
Table 1.
Height ratios of characteristic lignin and carbohydrate FTIR peaks in isolated cell wall of A. thaliana suspension-cultured cells
| Days of culture | 4 | 7 | 10 | 13 | 17 | 20 | |
|---|---|---|---|---|---|---|---|
| FTIR peak height ratios | I1540/1160 | 1.16 | 1.55 | 1.03 | 0.90 | 0.78 | 0.54 |
| I1540/1740 | 1.61 | 1.47 | 1.67 | 1.13 | 1 | 1.25 | |
| I1540/1425 | 1.48 | 1.70 | 1.36 | 0.96 | 0.93 | 0.77 |
Peak assignations: 1160 cm−1, C-O-C vibration of the glycosidic link in cellulose, XG, or pectic polysaccharides; 1425 cm−1, C-H stretch in CH2 of cellulose; 1540 cm−1, lignin aromatic ring stretching; 1740 cm−1, C=O stretch in ester groups.
Discussion
Growing plant cells are characterized by a substantial turgor pressure, which typically ranges between 0.3 and 1 MPa (1,30). Since the wall is thin (about 1/100 of the diameter of the cell) and supports the pressure from a large cross-sectional area of the cell, it must be capable of withstanding tensile stress. Hence, during cell growth, the cell wall must be sufficiently strong to equilibrate the high turgor but pliable enough to permit cell enlargement (1,30). These different needs are presumably reflected in the composition and architecture of the wall, which contains networks of interconnected polysaccharides (such as xyloglucans and cellulose), structural glycoproteins (hydroxyproline-rich extensins), enzymes, and expansins (3,31,32). The turgor pressure that develops during plant-cell growth initiates simultaneous deposition of polysaccharides and their interconnection by cross-linkage (33). However, regulation of the growth process is complex, depending not only on turgor but also on other cell processes that are coordinately regulated during growth, such as membrane extension, wall synthesis, osmotic readjustment, cytoskeleton development, energy and protein production, and many other cellular processes, including cell division (34). The walls of growing plant cells are characterized by high synthetic rates and a selective turnover of polysaccharides, both of which facilitate their expansion (2). In dicotyledonous plants such as Arabidopsis, xyloglucan and galacturonan constitute the main polysaccharides of the wall (31,35,36).
In this study, the elastic (Young’s) modulus of the cell wall varied between 0.1 MPa and 1 MPa according to the phase of growth. Several constituents of the cell wall are presumed to contribute to its tensile stiffness. These include microfibrils of cellulose (which are deemed to be the main strain-bearing structures), cross-linked xyloglucan, and networks of pectic polysaccharides (3,30,37,38). Lignin is believed to modulate the elastic properties of the cell wall via its interaction with other constituents (39,40). The mechanical properties of such a heterogenous structure as the cell wall are difficult not only to measure but also to calculate using classical mathematical tools. However, sophisticated numerical algorithms can be implemented to predict the mechanical properties of cell walls. One such software program was recently described by Kha et al. (41). The authors modeled the primary cell wall as a composite of four cellulose-hemicellulose networks arrayed in parallel. Using this virtual model, the software predicted the mechanical properties of the cell wall by a finite-element analysis. In a direction parallel to the cellulose microfibrils, the elastic modulus was estimated to range from 41 to 405 MPa; in a direction perpendicular to the cellulose microfibrils, it was estimated to range from 0.7 to 42 MPa, the lower values being compatible with our measurements. Similar values have been reported for various plant tissues, such as 3.7 MPa (42) and 8–10 MPa (43) for the youngest measurable internodes of poplar (Populus alba) and winding liana (Aristolochia macrophylla), respectively, 1–4 MPa for mesocotyls of maize (44), and 21–28 MPa for Arabidopsis (A. thaliana) hypocotyls (37).
Cell shape plays a major role in the pattern of wall stresses. During growth, plant cells attain distinctive shapes, appropriate for their functions. When surrounded by a structurally homogeneous (isotropic) wall, a cell will expand in the form of a sphere, i.e., at the lowest level of energy. One example is photosynthetically active leaf mesophyll cells, which detach from their neighbors and expand with a high degree of symmetry to yield a round oval shape (45). The wall of a long, cylindrical cell will expand preferentially in length. Longitudinally oriented root epidermal cells illustrate a typical cylindrical shape (46). Although wall stresses in spherical cells are isotropic, in cylindrical cells the circumferential wall stress is twice that in the longitudinal direction (30,47). Since Arabidopsis cells grown in suspension are more or less spherical in shape, one can expect an isotropic distribution of the wall stresses.
Our measurements revealed that the average stiffness of the cell wall of Arabidopsis increases during the exponential phase of growth (days 7–13) and decreases during the stationary phase (days 17–20, Figs. 3 and 4), thereby indicating different requirements at distinct stages. Moreover, during the exponential phase, as compared to the stationary phase, the cell wall was mechanically more heterogeneous (broad distribution of stiffness values (Fig. 3, Fig. S1, and Fig. S2), and different values of average stiffness were recorded at different cell-wall depths (Fig. 5)). In a recent AFM study, stiffness of various cells in the Arabidopsis meristem was measured at 100 nm indentation depth; different stiffness values were recorded, in the range 0.7–2 MPa, depending on the cell localization in the meristem (13). The results of that study also suggest that the stiffness of the outer wall is regulated at the cellular level. Our results show that the walls of Arabidopsis cells in the exponential growth phase are much stiffer (0.6 MPa on average) than they are at the beginning and end of the growth process (0.1–0.2 MPa on average), and that growth-related heterogeneous stiffness distribution in the cell wall is highest in the exponential growth phase as well. All these data indicate that mechanical heterogeneity of the cell wall may be a necessary precondition for growth at both cellular and tissue levels.
Since the capacity of the cell wall to expand is believed to be influenced by pH (48,49), we monitored this parameter with the passage of time in culture (Fig. 2). However, changes in the pH of the medium were not temporally correlated with changes in stiffness. The range spanned during the 21-day culturing period (pH 5.7–8.0) lies within the limits that are considered to be normal for metabolically active cells (50,51). Since the cell wall can be regarded as a polyelectrolyte, the local concentration of ions can differ significantly from their concentration in bulk solution (52). Hence, the pH of the medium does not necessarily reflect that within the cell wall. Nevertheless, a short-term influence of external pH on cell-wall activity cannot be excluded, and the issue is worthy of further investigation.
Similarly, future experiments would be needed to explore turgor pressure influence on the mechanical properties of Arabidopsis cells.
Due to the incomplete knowledge of this subject, several simplified models of growing cell walls have been proposed (49). They differ in details relating to the spatial location of the major components and their interassociations. The changes in the patterns of stiffness that were observed as a function of indentation depth in our study (Fig. 5) are consistent with the model in which cellulose is embedded within layers of hemicelluloses, with pectic polysaccharides filling the interstices (41,49). The difference in stiffness between the harder surface and the deeper softer layers of the cell wall was highest during the exponential phase of growth (Fig. 5), indicating that at this stage, a need arises to increase the stiffness gradient in the aforementioned direction. It has been proposed that cell-wall loosening, which is necessary for cell growth, may occur only locally. In this case, water uptake occurs across the whole plasma membrane, but the wall extends only locally (47). Our results indicate simultaneous existence of stiffer and softer regions in the cell wall (Figs. 3 and 5), which corroborates this theory. But which components of the cell wall are responsible for these different mechanical properties, and how are they reorganized or introduced to affect the changes in stiffness that are observed during growth? By using chemical and microscopic methods, the presence of lignin (53) or cellulose (12) on the surface of the cells grown in suspension has been noted. Cellulose is indeed believed to constitute ∼30% of the dry weight of cell walls (2,31). On the basis of our own FTIR-spectroscopy data (Fig. 6) and of the phloroglucinol-staining results (data not shown), lignin was present in the cell wall of Arabidopsis thaliana suspension-cultured cells during each growth phase. The band at 1330 cm−1, which has been assigned to the condensed rings in the monomers of lignin, was most pronounced in the cell walls between days 10 and 20, thereby confirming the presence of this condensed form of lignin during the late stage of exponential growth and during the stationary phase. According to the FTIR spectra, cellulose, xyloglucan, and pectic polysaccharides are likewise present in the cell walls of A. thaliana during each of the growth phases. The content of these three components increased relative to that of lignin during the exponential and the stationary phases (Table 1). The increase in the height of the peak at 1425 cm−1 that occurred between days 13 and 20 indicates that the content of cellulose was higher at the end of the exponential phase and during the stationary phase than at the earlier stages. These findings, together with the stiffness-tomography measurements (Fig. 5), indicate that a stiffer polymeric network may be formed within the surface layers of the cell wall and a softer one in the deeper regions. It has been proposed that during cell growth, a constant production and deposition of cell-wall components is needed for the cell wall to expand and simultaneously maintain its firmness (2,3,49). The tomography and FTIR data together indicate that xyloglucan, cellulose, and pectic polysaccharides are required during the exponential phase of growth to furnish the structural conditions necessary for an expansion of the cell wall. The increase in the height of the ester band at 1740 cm−1, and the parallel disappearance of the band at 1030 cm−1 and appearance of a band at 1060 cm−1 after day 4, as well as the increase in the height of the band at 1425 cm−1 between days 13 and 20, indicate that the polysaccharides not only undergo structural transformations but are also newly produced during the expansion and stationary phases of growth. The changes in types and content of polysaccharides, namely an increase in cellulose and xyloglucan, between the phases of division and stationary growth were previously observed in suspension cultures of a dicotyledonous plant (54). Hence, the cell wall manifests structural plasticity in response to the requirements of growth. It is structurally organized in such a way that stiffness changes on the surface can be harmonized with those in deeper layers. These structural accommodations are consilient with the two opposing requirements of growing cells: rigidity to withstand internal turgor forces, and pliancy to facilitate expansion during growth (3,30,55).
Acknowledgments
This work was supported by grants from the Indo Swiss Joint Research Programme (ISJRP) 122941 and CR 32I3-130676 and from the Ministry of Education and Science in Serbia, no. 173017. Part of the study was also supported by the University of Lausanne and by the SystemsX.ch project "Plant Growth in a Changing Environment".
Supporting Material
References
- 1.Cosgrove D.J. Wall extensibility: its nature, measurement and relationship to plant cell growth. New Phytol. 1993;124:1–23. doi: 10.1111/j.1469-8137.1993.tb03795.x. [DOI] [PubMed] [Google Scholar]
- 2.Cosgrove D.J. Assembly and enlargement of the primary cell wall in plants. Annu. Rev. Cell Dev. Biol. 1997;13:171–201. doi: 10.1146/annurev.cellbio.13.1.171. [DOI] [PubMed] [Google Scholar]
- 3.Cosgrove D.J. Growth of the plant cell wall. Nat. Rev. Mol. Cell Biol. 2005;6:850–861. doi: 10.1038/nrm1746. [DOI] [PubMed] [Google Scholar]
- 4.Cousins W.J., Armstrong R.W., Robinson W.H. Young’s modulus of lignin from a continuous indentation test. J. Mater. Sci. 1976;10:1655–1658. [Google Scholar]
- 5.Cousins W.J. Young’s modulus of hemicellulose as related to moisture content. Wood Sci. Technol. 1978;12:161–167. [Google Scholar]
- 6.Köhler L., Spatz H.-C. Micromechanics of plant tissues beyond the linear-elastic range. Planta. 2002;215:33–40. doi: 10.1007/s00425-001-0718-9. [DOI] [PubMed] [Google Scholar]
- 7.Keckes J., Burgert I., Fratzl P. Cell-wall recovery after irreversible deformation of wood. Nat. Mater. 2003;2:810–814. doi: 10.1038/nmat1019. [DOI] [PubMed] [Google Scholar]
- 8.Orso S., Wegst U.G.K., Arzt E. The elastic modulus of spruce wood cell wall material measured by an in situ bending technique. J. Mater. Sci. 2006;41:5122–5126. [Google Scholar]
- 9.Casuso I., Rico F., Scheuring S. Biological AFM: where we come from—where we are—where we may go. J. Mol. Recognit. 2011;24:406–413. doi: 10.1002/jmr.1081. [DOI] [PubMed] [Google Scholar]
- 10.Yamada T., Arakawa H., Ikai A. Use of AFM for imaging and measurement of the mechanical properties of light-convertible organelles in plants. Ultramicroscopy. 2002;91:261–268. doi: 10.1016/s0304-3991(02)00107-9. [DOI] [PubMed] [Google Scholar]
- 11.Clair B., Arinero R., Thibaut B. Imaging the mechanical properties of wood cell wall layers by atomic force modulation microscopy. IAWA J. 2003;24:223–230. [Google Scholar]
- 12.Lesniewska E., Adrian M., Pugin A. Cell wall modification in grapevine cells in response to UV stress investigated by atomic force microscopy. Ultramicroscopy. 2004;100:171–178. doi: 10.1016/j.ultramic.2003.11.004. [DOI] [PubMed] [Google Scholar]
- 13.Milani P., Gholamirad M., Hamant O. In vivo analysis of local wall stiffness at the shoot apical meristem in Arabidopsis using atomic force microscopy. Plant J. 2011;67:1116–1123. doi: 10.1111/j.1365-313X.2011.04649.x. [DOI] [PubMed] [Google Scholar]
- 14.Wu Y.J., Sharp R.E., Cosgrove D.J. Growth maintenance of the maize primary root at low water potentials involves increases in cell-wall extension properties, expansin activity, and wall susceptibility to expansins. Plant Physiol. 1996;111:765–772. doi: 10.1104/pp.111.3.765. [DOI] [PMC free article] [PubMed] [Google Scholar]
- 15.Liepman A.H., Wightman R., Scheller H.V. Arabidopsis—a powerful model system for plant cell wall research. Plant J. 2010;61:1107–1121. doi: 10.1111/j.1365-313X.2010.04161.x. [DOI] [PubMed] [Google Scholar]
- 16.Roduit C., Sekatski S., Kasas S. Stiffness tomography by atomic force microscopy. Biophys. J. 2009;97:674–677. doi: 10.1016/j.bpj.2009.05.010. [DOI] [PMC free article] [PubMed] [Google Scholar]
- 17.Butt H.-J., Jaschke M. Calculation of thermal noise in atomic force microscopy. Nanotechnology. 1995;6:1–7. [Google Scholar]
- 18.Roduit C., Longo G., Kasas S. Stiffness tomography exploration of living and fixed macrophages. J. Mol. Recognit. 2012;25:241–246. doi: 10.1002/jmr.2184. [DOI] [PubMed] [Google Scholar]
- 19.Hertz H. Über die Berührung fester elastischer Körper. J. Reine Angew. Math. 1882;92:156–171. [Google Scholar]
- 20.Strack D., Heilemann J., Dirks H. Structures and accumulation patterns of soluble and insoluble phenolics from Norway spruce needles. Phytochemistry. 1989;28:2071–2078. [Google Scholar]
- 21.Chen M., Sommer A.J., McClure J.W. Fourier transform-IR determination of protein contamination in thioglycolic acid lignin from radish seedlings, and improved methods for extractive-free cell wall preparation. Phytochem. Anal. 2000;11:153–159. [Google Scholar]
- 22.Kačuráková M., Čapek P., Ebringerova A. FT-IR study of plant cell wall model compounds: pectic polysaccharides and hemicelluloses. Carbohydr. Polym. 2000;43:195–203. [Google Scholar]
- 23.Wilson R.H., Smith A.C., Waldron K.W. The mechanical properties and molecular dynamics of plant cell wall polysaccharides studied by Fourier-transform infrared spectroscopy. Plant Physiol. 2000;124:397–405. doi: 10.1104/pp.124.1.397. [DOI] [PMC free article] [PubMed] [Google Scholar]
- 24.Faix O. Classification of lignins from different botanical origins by FT-IR spectroscopy. Holzforschung. 1991;45:21–27. [Google Scholar]
- 25.Faix O. Fourier transform infrared spectroscopy. In: Lin S.Y., Dence C.W., editors. Methods in Lignin Chemistry. Springer-Verlag; Berlin: 1992. pp. 83–109. [Google Scholar]
- 26.Pretsch P.D., Seibl J., Simon W. Springer Verlag; Berlin/Heidelberg: 1981. Tabellen zur Strukturaufklarung organischer Verbindungen mit spektroskopischen Methoden. [Google Scholar]
- 27.Schultz T.P., Templeton M.C., McGinnis G.D. Rapid determination of lignocellulose by diffuse reflectance Fourier transform infrared spectrometry. Anal. Chem. 1985;57:2867–2869. [Google Scholar]
- 28.Rodrigues J., Faix O., Pereira H. Determination of lignin content of Eucalyptus globulus wood using FTIR spectroscopy. Holzforschung. 1998;52:46–50. [Google Scholar]
- 29.Pandey K.K., Pitman L.A.J. Examination of the lignin content in a softwood and a hardwood decayed by a brown-rot fungus with the acetyl bromide method and Fourier Transform infrared spectroscopy. J. Polym. Sci: A Polym. Chem. 2004;42:2340–2346. [Google Scholar]
- 30.Schopfer P. Biomechanics of plant growth. Am. J. Bot. 2006;93:1415–1425. doi: 10.3732/ajb.93.10.1415. [DOI] [PubMed] [Google Scholar]
- 31.Burke D., Kaufman P., Albersheim P. The structure of plant cell walls VI. A survey of the walls of suspension-cultured monocots. Plant Physiol. 1974;54:109–115. doi: 10.1104/pp.54.1.109. [DOI] [PMC free article] [PubMed] [Google Scholar]
- 32.Obel N., Neumetzler L., Pauly M. Hemicelluloses and cell expansion. In: Verbelen J.P., Vissenberg K., editors. Vol. 5. Springer Berlin; Heidelberg, Germany: 2007. pp. 57–88. (Plant Cell Monographs. The Expanding Cell). [Google Scholar]
- 33.Proseus T.E., Boyer J.S. Periplasm turgor pressure controls wall deposition and assembly in growing Chara corallina cells. Ann. Bot. (Lond.) 2006;98:93–105. doi: 10.1093/aob/mcl098. [DOI] [PMC free article] [PubMed] [Google Scholar]
- 34.Maggio A., Zhu J.-K., Bressan R.A. Osmogenetics: Aristotle to Arabidopsis. Plant Cell. 2006;18:1542–1557. doi: 10.1105/tpc.105.040501. [DOI] [PMC free article] [PubMed] [Google Scholar]
- 35.McNeil M., Darvill A.G., Albersheim P. Structure and function of the primary cell walls of plants. Annu. Rev. Biochem. 1984;53:625–663. doi: 10.1146/annurev.bi.53.070184.003205. [DOI] [PubMed] [Google Scholar]
- 36.Bacic A., Harris P.J., Stone B.A. Structure and function of plant cell walls. In: Preiss J., editor. vol. 14. Academic Press; New York: 1988. pp. 297–371. (The Biochemistry of Plants). [Google Scholar]
- 37.Ryden P., Sugimoto-Shirasu K., McCann M.C. Tensile properties of Arabidopsis cell walls depend on both a xyloglucan cross-linked microfibrillar network and rhamnogalacturonan II-borate complexes. Plant Physiol. 2003;132:1033–1040. doi: 10.1104/pp.103.021873. [DOI] [PMC free article] [PubMed] [Google Scholar]
- 38.Burgert I. Exploring the micromechanical design of plant cell walls. Am. J. Bot. 2006;93:1391–1401. doi: 10.3732/ajb.93.10.1391. [DOI] [PubMed] [Google Scholar]
- 39.Hepworth D.G., Vincent J.F.V., Schuch W. Using viscoelastic properties of the woody tissue from tobacco (Nicotiana tabacum) to comment on the molecular structure of cell walls. Ann. Bot. 1998;81:723–734. [Google Scholar]
- 40.Åkerholm M., Salmén L. Interactions between wood polymers studied by dynamic FT-IR spectroscopy. Polymer. 2001;42:963–969. [Google Scholar]
- 41.Kha H., Tuble S.C., Williamson R.E. WallGen, software to construct layered cellulose-hemicellulose networks and predict their small deformation mechanics. Plant Physiol. 2010;152:774–786. doi: 10.1104/pp.109.146936. [DOI] [PMC free article] [PubMed] [Google Scholar]
- 42.Park Y.W., Baba K., Hayashi T. Enhancement of growth and cellulose accumulation by overexpression of xyloglucanase in poplar. FEBS Lett. 2004;564:183–187. doi: 10.1016/S0014-5793(04)00346-1. [DOI] [PubMed] [Google Scholar]
- 43.Köhler L., Speck T., Spatz H.C. Micromechanics and anatomical changes during early ontogeny of two lianescent Aristolochia species. Planta. 2000;210:691–700. doi: 10.1007/s004250050669. [DOI] [PubMed] [Google Scholar]
- 44.Schopfer P., Lapierre C., Nolte T. Light-controlled growth of the maize seedling mesocotyl: mechanical cell-wall changes in the elongation zone and related changes in lignification. Physiol. Plant. 2001;111:83–92. [Google Scholar]
- 45.Pyke K.A., Marrison J.L., Leech R.M. Temporal and spatial development of the cells of the expanding first leaf of Arabidopsis thaliana (L.) Heynh. J. Exp. Bot. 1991;42:1407–1416. [Google Scholar]
- 46.Dolan L., Duckett C.M., Roberts K. Clonal relationships and cell patterning in the root epidermis of Arabdidopsis. Development. 1994;120:2465–2474. [Google Scholar]
- 47.Szymanski D.B., Cosgrove D.J. Dynamic coordination of cytoskeletal and cell wall systems during plant cell morphogenesis. Curr. Biol. 2009;19:R800–R811. doi: 10.1016/j.cub.2009.07.056. [DOI] [PubMed] [Google Scholar]
- 48.Rayle D.L., Cleland R. Enhancement of wall loosening and elongation by acid solutions. Plant Physiol. 1970;46:250–253. doi: 10.1104/pp.46.2.250. [DOI] [PMC free article] [PubMed] [Google Scholar]
- 49.Cosgrove D.J. Expansive growth of plant cell walls. Plant Physiol. Biochem. 2000;38:109–124. doi: 10.1016/s0981-9428(00)00164-9. [DOI] [PubMed] [Google Scholar]
- 50.Bonga J.M., Durzan D.J. Martinus Nijhoff; Dordrecht, The Netherlands: 1986. Cell and Tissue Culture in Forestry, Vol. 1. General Principles and Biotechnology. [Google Scholar]
- 51.Shang X.M., Huang J.Y., Trolinder N.L. Buffer capacity of cotton cells and effects of extracellular pH on growth and somatic embryogenesis in cotton cell suspensions. In Vitro Cell. Dev. B. 1991;27:147–152. [Google Scholar]
- 52.Grignon C., Sentenac H. pH and ionic conditions in the apoplast. Annu. Rev. Plant Physiol. Plant Mol. Biol. 1991;42:103–128. [Google Scholar]
- 53.Leppard G.G., Colvin J.R., Martin S.M. Lignofibrils on the external cell wall surface of cultured plant cells. J. Cell Biol. 1971;50:63–80. doi: 10.1083/jcb.50.1.63. [DOI] [PMC free article] [PubMed] [Google Scholar]
- 54.Takeushi Y., Komamine A. Changes in composition of cell wall polysaccharides of suspension-cultured Vinca rosea cells during culture. Physiol. Plant. 1978;42:21–28. [Google Scholar]
- 55.Jarvis M.C., McCann M.C. Macromolecular biophysics of the plant cell wall: concepts and methodology. Plant Physiol. Biochem. 2000;38:1–13. [Google Scholar]
Associated Data
This section collects any data citations, data availability statements, or supplementary materials included in this article.