

Abstract
Fibrils are β-sheet-rich aggregates that are generally composed of several protofibrils and may adopt variable morphologies, such as twisted ribbons or flat-like sheets. This polymorphism is observed for many different amyloid associated proteins and polypeptides. In a previous study we proposed the existence of another level of amyloid polymorphism, namely, that associated with fibril supramolecular chirality. Two chiral polymorphs of insulin, which can be controllably grown by means of small pH variations, exhibit opposite signs of vibrational circular dichroism (VCD) spectra. Herein, using atomic force microscopy (AFM) and scanning electron microscopy (SEM), we demonstrate that indeed VCD supramolecular chirality is correlated not only by the apparent fibril handedness but also by the sense of supramolecular chirality from a deeper level of chiral organization at the protofilament level of fibril structure. Our microscopic examination indicates that normal VCD fibrils have a left-handed twist, whereas reversed VCD fibrils are flat-like aggregates with no obvious helical twist as imaged by atomic force microscopy or scanning electron microscopy. A scheme is proposed consistent with observed data that features a dynamic equilibrium controlled by pH at the protofilament level between left- and right-twist fibril structures with distinctly different aggregation pathways for left- and right-twisted protofilaments.
Introduction
Amyloid fibrils are β-sheet-rich protein aggregates that are associated with various neurodegenerative diseases, such as Alzheimer's disease, Parkinson's disease, Huntington's disease, and prion diseases (1,2). Their deposits, amyloid plaques, display apple-green birefringence upon Congo red binding. Striking evidence suggests that the ability to form amyloid fibrils is not unique to this small group of disease-related proteins, but rather is a generic property of the polypeptide chain (3). Insulin, a 51-amino-acid residue hormone, is also able to aggregate and form long, unbranched fibrillar aggregates with variable morphologies (4). Fibrillar aggregates have been found in human derma at the location of frequent insulin injections, a rare disorder known as injection amyloidosis (5). Moreover, insulin aggregation is also involved in type II diabetes and insulinoma (6,7).
It has been shown that the toxicity of amyloid fibrils is strongly associated with their morphology (8,9). For example, morphologically different prion fibrils that are formed from the same protein under slightly different aggregation conditions have different toxicities (10,11). However, experimentally it is very difficult to prove or disprove this hypothesis with regard to insulin, due to the high polymorphism of its amyloid fibrils (12). For example, insulin aggregation in vitro results in >10 different morphologies. Some fibrils are flat and untwisted, whereas others exhibit a twisted morphology (13,14). Similar observations have been made for β-amyloid and serum amyloid A (SAA) proteins (15,16).
Amyloid polymorphism is commonly associated with the morphological heterogeneity of fibril aggregates. In a previous study using vibrational circular dichroism (VCD), we demonstrated that insulin fibrils have another level of the polymorphism associated with their chiral organization (17,18). These chiral polymorphs exhibit two types of VCD spectra: normal and reversed. These spectra are roughly mirror images of each other with respect to their signs, intensities, and peak positions, whereas the corresponding infrared (IR) spectra are virtually identical. The selective formation of either chiral polymorph can be controlled by small variations in the pH during insulin fibrillation.
A growing body of literature indicates that VCD has become a useful tool for chiral characterization of amyloid aggregates. For example, Measey and Schweitzer-Stenner (19) recently reported a large enhancement of VCD upon aggregation of short polypeptides. They also showed that mature fibrils formed from the N-terminal peptide fragment of the yeast prion protein, Sup35, and the amyloidogenic alanine-rich peptide AKY8 have opposite-signed VCD. Fulara et al. (20) demonstrated that opposite-signed VCD spectra can be obtained for mature fibrils formed from poly-L or -D glutamic acid. Polyglutamic acid forms spirally twisted aggregates with handedness determined by the amino acid chirality (left-handed for poly-L and right-handed for poly-D).
Our main goal in this study was to increase our understanding of the origin of VCD chirality in insulin fibrils by correlating it with fibril morphology and protein structure. To that end, we carried out a systematic morphological and structural characterization of normal and reversed insulin fibrils using fluid cell atomic force microscopy (AFM), scanning electron microscopy (SEM), VCD, IR, deep UV resonance Raman (DUVRR) scattering, and induced electronic circular dichroism (ICD). We found that normal insulin fibrils that are formed under incubation conditions of pH 2.5, 70°C, have a well-defined left-twisted morphology, as previously observed for both insulin fibrils (4,13) and fibrils prepared from other proteins (21,22). On the other hand, a few examples of right-twisted fibrils have also been reported (16). It was logical to suggest that the reversed chirality and associated VCD spectra should originate from the right-twisted fibrils. However, we have not yet found a single example of right-twisted insulin fibril morphology for samples that show reversed VCD. That is why we devoted significant time and effort to determine the morphology of reversed VCD fibrils in this study. Instead, we found that reversed VCD is correlated with tape-like or binary fibrils without morphological twist that are abundantly present in insulin fibrillar samples grown under conditions of lower pH at the same elevated temperatures. These fibrils exhibit a unique VCD spectrum (17,18) that is almost the mirror image, with respect to signs, intensities, and peak locations, of that of the normal insulin fibrillar VCD spectrum. Nevertheless, both chiral polymorphs of insulin fibrils share the same cross-β-sheet secondary structure, as is evident from our previous study using DUVRR spectroscopy (17).
From our studies, we find that all known microscopic tools provide relatively limited information in terms of fibril chirality. This limit lies at the level of observed morphological fibril chirality, and none of these techniques appears to probe more deeply to the protofilament level of fibril chiral organization. By contrast, according to basic theoretical concepts of CD, enhanced VCD spectra as large as those observed from protein fibrils can originate only from supramolecular aggregates that have a long-range chiral organization. Thus, one would expect VCD to probe a deeper level of fibril organization that lies below that of surface fibril morphological handedness, or its absence. It was recently proposed that chiral fibril polymorphism may be associated with different protofibril self-orientations inside the fibril (19). This discovery raises the possibility that VCD is a unique stereo-structural tool that does not conflict with any of the currently known microscopic tools. It can probe amyloid supramolecular chiral organization beneath the surface of the apparent amyloid fibril structure probed by microimaging techniques such as AFM and SEM.
Materials and Methods
Preparation of insulin fibrils
Fibrils were prepared from bovine insulin (60 mg/ml; Sigma, St. Louis, MO) at 70°C. Concentrated HCl was used to adjust the solution pH. The fibrillation process was terminated by reducing the temperature to ∼25°C and a sample centrifugation at 14,000 × g for 20 min.
VCD instrumentation
We measured VCD and IR spectra at BioTools (Jupiter, FL) using a dual-source, Dual-PEM ChiralIR-2X Fourier transform VCD spectrometer equipped with a mercury-cadmium-telluride detector that covers a spectral range from 800 to 2000 cm−1. GRAMS/AI 7.0 (Thermo Galactic, Salem, NH) was used for spectral data processing. For each measurement, ∼10 μl of a fibril gelatinous solution were placed into a CaF2 cell with a 6-μm path length. VCD and IR spectra were acquired for 2–3 h and 20–30 min, respectively. Typically, three to four accumulations were averaged to obtain the reported spectra.
ICD
For each measurement, 20 μl of fibril gel were redispersed in a thioflavin T (ThT; Sigma, St. Louis, MO) solution, with a final ThT concentration of 0.019 mM. CD spectra were collected with the use of a JASCO (Tokyo, Japan) J-810 spectropolarimeter at room temperature. For each sample, we averaged 20 CD spectra, recorded with 1 nm resolution, using GRAMS/AI 7.0 (Thermo Galactic, Salem, NH).
AFM
Immediately after the fibrillation was completed, an aliquot of fibrillar gel was resuspended in HCl, with a pH value equal to the aggregation one, in a 1:400 dilution factor (V/V). A drop of this solution was placed onto freshly cleaved mica in the AFM fluid chamber and incubated for 2 min, and then excess solution was removed. To avoid drying of the mica surface, 2 ml of pure HCl solution, with a pH equal to the aggregation one, were placed on top of the mica. AFM scanning was performed immediately in tapping mode on an MFP-3D Bio microscope (Asylum Research, Santa Barbara, CA) with Olympus TR400PSA tips. Surface profiles were plotted with the use of MFP3D software. The AFM technique accurately reports the species' height; however, width dimensions are subject to broadening due to the finite size of the tip.
SEM
For each sample, 20 μL of analyzed solution were diluted in a 1:400 ratio by HCl, with the pH at which the sample was aggregated, and deposited onto a 200-mesh copper grid. Staining with 1% uranyl acetate (Sigma, St. Louis, MO) was performed 10 min after the deposition was completed. The samples were imaged on a Zeiss (Oberkochen, Germany) Supra SEM in InLense mode with 5 kV EHT.
DUVRR spectroscopy
We obtained DUVRR spectra at the University at Albany using an in-house-built DUVR spectrometer as described elsewhere (23) with a 199-nm excitation wavelength. A spinning NMR tube with a magnetic stirrer inside was used for sampling. For each measurement, 100 μl of fibril gel were placed into the NMR tube. Each Raman spectrum was accumulated for 30 min. All reported Raman spectra are an average of at least three independent accumulations. GRAMS/AI 7.0 (Thermo Galactic, Salem, NH) was used for spectral data processing.
Results and Discussion
Effect of pH on the morphology of reverse VCD fibrils
We recently demonstrated that insulin forms fibrils with opposite chirality depending on small variations in the solution pH (17). Normal, left-handed fibrils (NFs) form in solution at pH ≥ 2.4. These fibrils show a typical fibrillar VCD spectrum with peaks at 1554, 1593, 1627, 1647, and 1670 cm−1, with a sign pattern of + + − + + (17,18). However, when the solution pH is <2.1, insulin aggregation results in morphologically different reverse fibrils (RFs) that exhibit opposite chirality, as is evident from the VCD spectrum (− − + − −). We found that insulin fibrils that were grown at different values of low pH showed variable intensities of VCD spectra (Fig. 1).
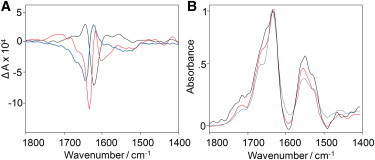
Figure 1.
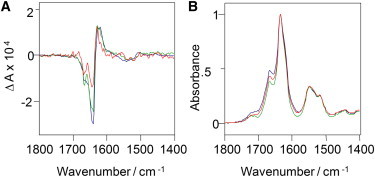
Supramolecular chirality of reversed VCD insulin fibrils grown at different pH levels. Shown are VCD (A) and IR (B) spectra of insulin fibrils grown at pH 1.9 (red), 1.5 (green), and 1.3 (blue) at 70°C. The negative VCD intensity at 1647 cm−1 stepwise increases from solutions grown at pH values ranging from 1.9 to 1.5. The insulin fibrillar solution grown at pH 1.3, 70°C, showed the largest negative intensity (−3.1 × 10⁴).
Fibrils that were grown at higher pH (1.9) had the smallest negative VCD intensity at 1647 cm−1 and 1662 cm−1. Fibrils that were formed at lower pH (1.5) showed a larger negative intensity for these peaks. Finally, insulin fibrils grown at very low pH (1.3) had the largest negative VCD intensity at these frequencies. However, for all three studied samples, the positive VCD intensity of a peak at 1627 cm−1 remained approximately the same, as can be seen in Fig. 1. We reproduced this trend by repeating the experiment for the same initial protein solution and adjusting the pH. Fibril samples prepared from different protein solutions show some variations in the VCD intensity that did not affect the trend of increasing negative VCD intensities with lower pH as described here.
To determine how the morphology of insulin fibrils changes with VCD intensity variations, we used fluid-cell AFM. We imaged the fibrils that were grown at pH 1.9, 1.5, and 1.3, as shown in Fig. 2. Fluid-cell AFM has been shown to be a highly preservative technique for imaging soft materials. Unlike electron microscopy, it does not require additional sample preparation or staining and drying. Thus, the fibril heights, as well as the small morphological features of their topology, can be more accurately observed and measured.
Figure 2.
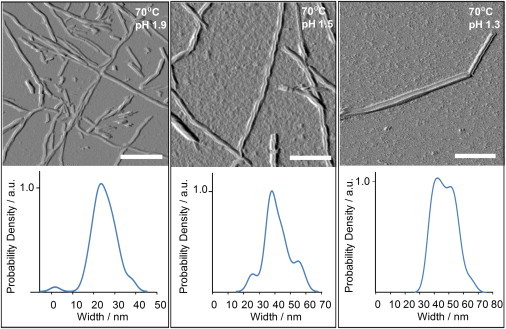
Morphology and dimensions of reversed VCD insulin fibrils grown at different pH levels. Fluid-cell AFM images (top) of insulin fibril samples exhibiting reversed VCD spectra grown at 70°C at pH 1.9, 1.5, and 1.3. Scale bar is 200 nm. Diagrams (bottom) of average fibril width distributions determined by Kernel distribution density calculations (or just a typical single fibril width, not clear from text above) for groups 1 (left), 2 (middle), and 3 (right), predominantly associated with the pH values of 1.9, 1.5, and 1.3, respectively.
Most of the fibrils on the recorded images show a flat, tape-like topology without noticeable right-handed (or left-handed) twists. We found that the fibril width varies with the pH of the solution in which it was incubated (from pH 1.9 to 1.3). Fibrils grown at pH 1.9 are significantly thinner than fibrils grown at pH 1.5 and 1.3 (Fig. S1 in the Supporting Material). Because the classification of fibrils based on their morphologies is quite complicated, we performed a statistical analysis of fibril dimensions to quantify their morphological differences. We measured no fewer than 60 individual fibrils for each aggregation pH, and evaluated the data using Kernel distribution density (24) calculations to characterize the width and height distributions of insulin fibrils associated with those in Fig. 2. The results obtained are presented in Table 1.
Table 1.
Main groups of reversed VCD fibrils according to their morphology
| Fibril incubation pH | Group 1R |
Group 2R |
Group 3R |
VCD intensity at 1647 cm−1 | ||||||
|---|---|---|---|---|---|---|---|---|---|---|
| Shape | Height/nm AFM | Width/nm AFM | Shape | Height/nm AFM | Width/nm AFM | Shape | Height/nm AFM | Width/nm AFM | ||
| 1.3 | — | — | — | Binary tapes (almost all) | 2.0 ± 0.5 | 41.5 ± 5 | Binary tapes (small amount) | 3.6 ± 0.6 | 50 ± 7 | −3.1 × 10⁻⁴ |
| 1.5 | Tapes (small amount) | 3.0 ± 1 | 25.1 ± 2 | Binary tapes (almost all) | 3.0 ± 1 | 37.5 ± 4 | Binary tapes (small amount) | 6.3 ± 2 | 53 ± 4 | −2.5 × 10⁻⁴ |
| 1.9 | Tapes (almost all) | 1.9 ± 0.4 | 23 ± 4 | Binary tapes (small amount) | 3.2 ± 2 | 37.2 ± 2 | - | - | - | −1.3 × 10⁻⁴ |
Subpopulations of insulin fibrils (groups 1R–3R) were grown at various pH levels at 70°C. Their abundance, shape, height, and width are presented. All of these fibrils exhibit reversed VCD spectra.
It is evident from Fig. 2 and Table 1 that the width of insulin fibrils changes significantly with pH according to three relatively distinct groups (groups 1R, 2R, and 3R). Specifically, insulin fibrils that form at pH 1.9 have a dominating population of tape-like fibrils from group 1R with a width distribution of 23 ± 4 nm and a height of 1.9 ± 0.4 nm. These fibrils have a flat, nontwisted, tape-like topology. At the same time, insulin fibrils that form at pH 1.5 show a very small subpopulation of the group 1R tape-like fibrils, whereas the majority of the fibrils possess the group 2R binary morphology. These binary fibrils have a width distribution of 37.5 ± 4 nm and a height of 3.0 ± 1 nm. We found that some of these fibrils have a left twist with periodicity of ∼100 nm per strand (Fig. S2). However, on the surface of some of these fibrils we found regular waves rather than a well-defined twist (Fig. 2, center). In the same incubation solution at pH 1.5, we found a third subpopulation of fibrils, group 3R, with a width distribution of 53 ± 4 nm and a height of 6.3 ± 2 nm. Insulin fibrils that form at pH 1.3 also show a binary structure and have two populations: group 2R with a width of 41.5 ± 5 nm, and group 3R with a width of 50 ± 7 nm. These populations have a fibrillar height of 2.0 ± 0.5 nm and 3.6 ± 0.6 nm, respectively. These results indicate that the observed reversed VCD spectra of insulin fibrillar solution grown in the range of pH 1.3 to 1.9 at 70°C are associated with predominantly tape-like fibrils, and the main negative VCD intensity at 1647 cm−1 became more negative with decreasing incubation pH and increasing fibril width as determined from fluid-cell AFM.
At this point, we want to establish a relatively obvious nomenclature that is common in the literature regarding fibril structure and development. We refer to the simplest and most primitive form of fibrils as protofilaments. The next level of development is protofibrils, followed by mature, larger fibrillar structures, which often involve intertwining and braiding of protofilaments or protofibrils, and are referred to as fibrils.
Core structure of reversed insulin fibrils
We used DUVRR spectroscopy combined with hydrogen-deuterium exchange to characterize the structure of the fibril core.
As is evident from the Raman spectra presented in Fig. 3, the frequencies and approximate relative intensities of the Amide I, II, and III bands did not change with the pH of fibril preparation. This indicates that the conformation of the polypeptide backbone stayed the same. However, the intensity of 1602 cm−1 and 1618 cm−1 bands assigned to the aromatic amino acids tyrosine and phenylalanine monotonically increased from pH 1.3 to pH 1.9 (Fig. 3). These data indicate a change in the hydrophobic-hydrophilic local environment of these amino-acid residues and/or degree of protonation.
Figure 3.
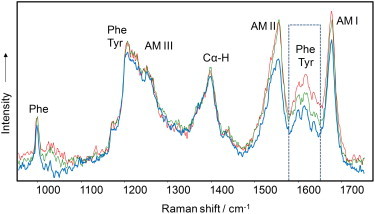
Structure of reversed VCD insulin fibril polymorphs. DUVRR spectra of insulin fibrils formed at pH 1.3 (blue), 1.5 (green), and 1.9 (red) indicate that the conformation of the polypeptide backbone does not change with pH, whereas the local environment and/or the extent of protonation (where appropriate) of aromatic amino acid residues changes. Amide I vibrational mode (Am I) is dominated by C=O stretching, with a small contribution from C––N stretching and N––H bending. Amide II and Amide III bands involve significant C––N stretching, N––H bending, and C––C stretching. The Cα-H bending vibration mode involves Cα-H symmetric bending and C––Cα stretching.
On the basis of the Raman results, we conclude that the structure of the cross-β-core is the same for all fibrils that exhibit reversed VCD. Consequently, the mechanism of nucleation and protofilament formation should be the same. Small variations in pH and temperature come into play during protofibril formation and further fibril development and aggregation. This hypothetical mechanism is further supported by a kinetic study of insulin fibrillation, as discussed below.
Normal VCD fibrils
We previously described the experimental pH conditions for the formation of NF insulin fibrils with normal signed VCD spectra (17). We now compare the morphology of those NFs with that of fibrils found in the samples with reversed signed VCD spectra.
Fig. 4 shows an AFM image of a sample of NFs that exhibit a very strong, normal VCD signal, also shown in the figure. The fibrillar composition is dominated by left-hand twisted fibrils with a small subpopulation of smaller fibrils, which could be protofibrils (Table 2).
Figure 4.
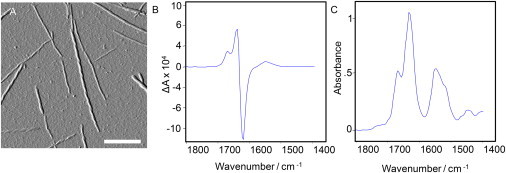
Morphology and supramolecular chirality of normal VCD insulin fibrils grown at pH 2.5, 70°C. (A) The fluid-cell AFM image shows the dominance of left-handed fibrils, with a small subpopulation of smaller fibrils. Scale bar is 250 nm. (B and C) Also shown are VCD (B) and IR (C) spectra of the fibril solution.
Table 2.
Main groups of normal VCD fibrils
| Fibril incubation pH | Group 1N |
Group 2N |
VCD intensity at 1625 cm−1 | ||||
|---|---|---|---|---|---|---|---|
| Shape | Height/nm AFM | Width/nm AFM | Shape | Height/nm AFM | Width/nm AFM | ||
| 2.5 | Left-twisted (almost all) | 8.5 ± 1.4 | 24.2 ± 2 | Left-twisted (small amount) | 4.9 ± 1 | 16.2 ± 2 | −1.3 × 10⁻³ |
Subpopulations of insulin fibrils (groups 1N and 2N) were grown at pH 2.5, 70°C.
The analysis of the fibril dimensions from the solution with normal VCD indicates that they are significantly different from those of reversed VCD. For example, considering RFs incubated at pH 1.5, the fibril width of the subpopulation group 1N of NFs is almost the same as group 1R for RFs (25.1 ± 2 nm for reversed and 24.2 ± 2 nm for normal), but their heights are significantly different (3.0 ± 1 nm for reversed and 8.5 ± 1.4 nm for normal). On the other hand, some NF aggregates classified in group 2N have a height of 4.9 ± 1 nm in the solution with normal VCD. Some fibrils that were found in the solution with reversed VCD (groups 2R and 3R) have heights (3.0 ± 1 nm and 6.3 ± 2 nm) with a small statistical overlap with group 2N (4.9 ± 1 nm). However, their respective widths (37.5 ± 4 nm and 53 ± 4 nm) are significantly different from those of group 2N (16.2 ± 2 nm).
No tape-like or binary fibrils are evident, which is the major difference in the images reported for samples with reversed VCD spectra. Thus, if single or binary tape-like fibrils are associated with reversed VCD, we find that normal sense VCD spectra are associated with left-twisted fibrils mostly from a predominant subpopulation or a smaller, possibly protofibril population. Because enhanced VCD intensity, relative to VCD intensity from a typical isolated protein, must originate from some kind of supramolecular chiral organization at the molecular level, and we do not see evidence of this structure reflected in the AFM surface morphologies of the insulin RFs, we must therefore conclude that the reversed VCD is a characteristic of some kind of inner intrafibrillar chiral organization rather than an externally visible fibrillar twist. It would be logical to expect that other techniques, such as ICD, which probes the fibrillar chirality based mainly on surface morphology without detecting intrafibrillar structural organization, should not show any signal for flat tape-like fibrils. At the same time, left-handed fibrils, which have normal VCD, would be expected to display significant ICD intensity.
ICD of NFs and RFs
In 2005, Dzwolak and Pecul (25) proposed that ICD could be used to characterize the supramolecular chirality of amyloid fibrils. The ICD signal is generated by binding of the nonchiral molecule ThT to fibrils, yielding a new electronic CD band associated with UV absorption from ThT. Dzwolak and Pecul (25) showed that fibrils with randomly negative or positive ICD form in a vortex-agitated insulin solution. However, without vortexing, insulin fibrillation at 60°C results in a sample with zero ICD signal (26). On the basis of AFM images, Loksztejn and Dzwolak (26) explained the absence of the ICD signal as being due to aggregation of insulin fibrils into large clumps.
Given these results, we used ThT-ICD spectroscopy to probe the supramolecular chirality of normal and reversed VCD insulin fibrils.
As is evident from Fig. 5, the reversed VCD sample dominated by binary fibers showed near-zero ICD. At the same time, left-twisted fibrils with normal VCD resulted in a strong negative ICD signal. These results are in agreement with an earlier observation that the chiral microarchitecture of a twisted fiber serves as a scaffold for ThT molecules, enabling strong couplings between them that gives rise to a strong ICD signal (27). Developing this hypothesis further, one could suggest that tape-like and binary untwisted fibrils should not exhibit a noticeable ICD signal when they are being decorated with ThT. In fact, according to the images reported by Loksztejn and Dzwolak (26), vortex-free insulin fibrils have a tape-like morphology and as a result exhibit no ICD signal.
Figure 5.
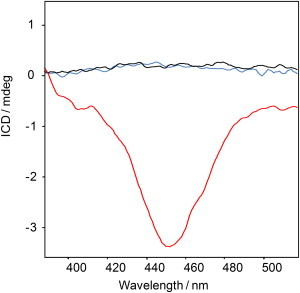
Evaluation of insulin fibril chirality by ICD. ICD spectra of normal (red) and reversed (blue) VCD fibrils. NFs were grown at pH 2.5 and reversed at pH 1.5, 70°C. The reversed VCD sample dominated by binary fibers shows zero ICD. At the same time, normal VCD left-twisted fibrils result in a large negative ICD signal. The pure ThT solution also has zero ICD (black) and represents the instrument baseline.
Therefore, ThT-ICD and VCD are complementary methods for characterizing amyloid fibrils. The ICD signal, which comes from the dye adsorbed on the surface of the fibril, reports on the overall shape-level morphology (primarily twist), is not structure-specific, and does not provide information about the intrafibrillar organization. In contrast, VCD probes the fibrillar structure and reports on the intrafiber organization. Reversed VCD spectra (Fig. 1) are related to the internal structural chirality of tape-like or binary fibrils, despite a relatively simple overall flat tape-like shape with no apparent twist.
The spectra reported here indicate that normal VCD from a fibril sample is comprised mainly of fibers with a left-handed twist that shows a negative ICD signal, known as a negative Cotton effect. The formation of insulin fibrils with negative ICD does not necessarily require solution vortexing. An appropriate combination of pH and incubation temperature results in the formation of normal left-twisted fibrils with normal VCD and negative ICD.
SEM
One might expect that the resolution of the AFM technique is not good enough to visualize the right-handed twist that may be present on the surface of flat-like fibrils. Thus, we used SEM as an alternative method to characterize the morphology of fibers. It was previously demonstrated that cryo-SEM is capable of resolving the morphology of right-handed fibrils formed from a 12-residue fragment of SAA protein (16,21).
Specifically, Fig. 6 shows SEM images of both binary fibrils that dominate the insulin fibrillar solution grown at pH 1.5, 70°C (Fig. 6, a and b), and left-handed fibrils that are formed st pH 2.5, 70°C (Fig. 6, c and d). Two morphological variations of the binary fibrils grown at pH 1.5, 70°C, are evident in the SEM images (Fig. 6, a and b). Some of them (group 2R; Fig. 6 b and Fig. S2) have a flat, tape-like smooth topology with two distinct protofibrils that have a hollow between them. In addition to these fibrils, we also observe flat, tape-like fibrils with smaller width (group 1R; Fig. 6 a).
Figure 6.
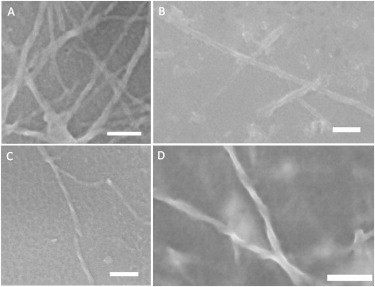
Morphology of normal and reversed VCD insulin fibrils. Shown are SEM images of (A and B) binary insulin fibrils prepared at pH 1.5, 70°C, and (C and D) left-handed fibrils from an insulin solution at pH 2.5, 70°C. Not a single right-twisted fiber was found in the solution of insulin fibrils that was grown at pH 1.5, 70°C, and instead flat tape-like fibrils dominated in the images. (C and D) In contrast, fibrils that were grown at pH 2.5 show a distinct left-handed topology. Scale bar is 100 nm.
As indicated above, the advantage of SEM is that it provides a real fibril width (i.e., without an AFM tip convolution effect). Binary fibrils are ∼34 nm wide (38 ± 4 by AFM), whereas tape-like fibrils are ∼18 nm wide (25.1 ± 2 by AFM). On the basis of these data, we concluded that the tip convolution error was relatively small. This allowed us to use the reported AFM fiber widths for the comparative analysis. Neither AFM nor SEM images showed fibrils with a right-handed twist. On the other hand, SEM showed a left-handed topology of fibrils (group 1N) that were grown at pH 2.5, 70°C. We found that these fibrils were ∼18 nm wide and had a twist periodicity of ∼100 nm.
Kinetics of reversed insulin fibril formation
An important question remains as to whether the reversed VCD fibrils could be composed of right-twisted protofilaments and protofibrils. To answer this question, we probed the morphology and VCD spectral properties of insulin aggregates at the early stages of fibrillation. Specifically, we terminated the fibrillation process after a 15-min incubation at pH 1.5, 70°C, and characterized the kinetic intermediates using fluid-cell AFM (Fig. 7).
Figure 7.
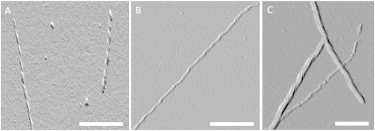
Morphological characterization of aggregates formed at different stages of insulin fibrillation. (A and B) Fluid-cell AFM images of insulin protofilaments (A) and protofibrils (B) that dominate the insulin aggregation solution after a 15-min incubation at 70°C, pH 1.5. (C) Further development of these protofilaments and protofibrils results in mature fibrils after a 2-h incubation at 70°C. Scale bar is 200 nm.
According to Khurana et al. (28), the fibril height (thickness) can be used to classify protein aggregates at various stages of fibrillation. Specifically, they consider protofilaments and protofibrils to have average heights of 1.2 ± 0.3 nm and 1.9 ± 0.3 nm, respectively, whereas fibrils have heights of 3.0 ± 0.4 and 4.8 ± 0.4 nm. It is important to emphasize that the insulin aggregation conditions used by Khurana et al. (pH 1.6) strongly favored the formation of reversed VCD fibrils. Thus, the discussed categorization will be applied only to the RF classification in our study.
Left-twisted protofibrils dominated the sample at the early stages of insulin fibrillation, as is evident from the AFM image shown in Fig. 7 a. These protofilaments have heights of 1.3–1.5 nm and an obvious periodic twist. Larger protofibrils evident in the same AFM image also exhibit the left-twisted morphology (Fig. 7 b). The latter species have a ∼2-nm height and ∼23-nm width. One might expect the subsequent development of these left-twisted protofibrils to lead to binary fibrils (Fig. 7 c; also see Fig. 2, central image and profile) under these pH conditions; however, this expectation is not supported by the results of the VCD characterization of insulin fibrillation kinetics (see below).
We measured VCD spectra at various stages of insulin fibrillation at pH 1.5, 70°C. Aliquots of insulin solution were taken periodically and cooled immediately to room temperature for VCD measurements, as shown in Fig. 8.
Figure 8.
Kinetic of reversed VCD fibril formation. Shown are VCD (A) and IR (B) spectra recorded at various stages of insulin fibrillation at pH 1.5, 70°C. Normal VCD spectra that were evident in the beginning (black curve) flipped and became reverse-signed after ∼40 min of incubation (red curve). After 120 min of sample incubation, the VCD intensity slightly decreased (blue curve).
It appears that insulin aggregation at low pH resulted in a strong, normal VCD at the early stages of fibril formation, when protofilaments and protofibrils dominated the sample. However, the signs of the major features of the VCD spectrum reversed after longer incubation, when binary fibrils became the predominant species.
Based on x-ray studies and mass-per-length measurements, Eisenberg and co-authors (4) proposed that each protofilament of insulin fibrils is composed of two pairs of stacked β-sheets with different sheet-to-sheet distances. According to their model, a single pair of β-sheets (the cross-β-sheet core structure and the basic protofilament structural element) is twisted along its axis, creating the most basic twisted element of the whole fibril architecture. Building on these ideas, we propose here that the solution pH determines the sense (left or right) of the twist of single pairs of stacked β-sheets as probed by VCD. The sense of the twist not only determines the sign of the VCD spectra, it also establishes a template for further growth of these β-sheets. Our imaging data indicate that in the case of normal VCD, intertwining of the cross-β-sheet cores enlarges the magnitude of the twist that is seen in the morphological appearance of the left-handed fibrils, as was previously observed by Eisenberg and co-authors (4). However, in the case of right-twisted β-sheets, further intertwining is not favorable for some reason, and the fibril growth instead leads to the side-to-side aggregation of protofilaments and formation of flat binary fibrils. One could hypothesize that right-twisted β-sheet protofilaments are stable only in the binary complexes and do not extend their width with additional protofilaments until the late stages of insulin fibrillation. The right-twisted β-sheet structure is a prerequisite of the reversed VCD found for mature insulin fibrils prepared at 1.5, 70°C. Further study will be necessary to confirm this hypothesis.
This model is also supported by the theoretical exciton oscillator model of Measey and Schweitzer-Stenner (19) regarding the origin of reversed and normal VCD fibril spectra. According to their calculations, enhanced VCD originates from the specific way peptide carbonyls align as β-sheet structures as they form protofilaments, as well as the sense of twist of these β-sheet models. They found that a small-angle twist along the axis in the protofilament structure is critical for the appearance of large VCD, and the sign of the VCD is dependent on the sense of this twist angle. The same authors previously demonstrated that fibrils formed from short peptide AKY8 resulted in what we call a reversed VCD, which is almost 10 times more intense than the insulin fibril VCD reported here (29). It is noteworthy here that no noticeable twist is evident in the AFM images of AKY8 fibrils, despite a very strong VCD signal.
In contrast, protofibrils and protofilaments can orient and associate more constructively by braiding with each other to form mature fibrils that have only normal VCD. Indeed, kinetic studies of insulin aggregation at pH 2.5 demonstrated a continuous increase of normal VCD spectra intensities with time. No reversal of VCD signs was observed (18). It is important to mention that the protein secondary structures of protofibrils, protofilaments, and fibrils (the cross-β-core) in this case and in the case of reversed VCD fibril maturation, are the same, as evidenced by their identical DUVRR spectra (17). In addition, the smallest protein assembly (protofilament) appears to be the same for normal and reversed VCD fibrils. However, the pH of aggregation directs the pathway of fibril maturation, forming either tape-like and binary fibrils with reversed VCD or left-twisted helices of braided protofibrils and protofilaments with normal, usually larger VCD.
On the basis of the evidence presented here, as well as previous work, we propose a specific kinetic development pathway as illustrated in Scheme 1. Protofilaments initially form as left-twisted stacked β-sheet structures. If the pH is above a threshold of ∼2.0, these protofilaments aggregate by mutual braiding to form left-twisted protofibrils consisting of two intertwined protofilaments. The protofilaments subsequently continue to aggregate by intertwining and braiding to form large, mature, left-twisted fibrils. The more advanced the aggregation of left-twisted fibrils, the larger is the observed normal VCD. If the pH is below the threshold of 2.0, the exposed left-twisted protofilaments reverse their gradual twist (approximately one turn per 100 nm or longer) to become right-twisted, as evidenced by VCD with opposite-signed VCD patterns. The observed VCD may become slightly larger with time or a lower incubation pH, but reversed VCD has never been seen to grow significantly with time. Instead, right-twisted protofilaments, which because they are composed of L-amino-acid residues are structurally distinct from left-twisted fibrils, form a binary, tape-like fibril morphology. This morphology does not involve intertwining or braiding, but rather a parallel aggregation of the original right-twisted protofilament. This is consistent with the VCD originating only from the protofilament level, the simplest level of fibril structure, and no subsequent dramatic growth of VCD, because no additional level of chirality (protofibril or protofilament braiding) occurs with time. One can observe thicker binary or tape-like structures (groups R1, R2, and R3) but no additional chiral features.
Scheme 1.
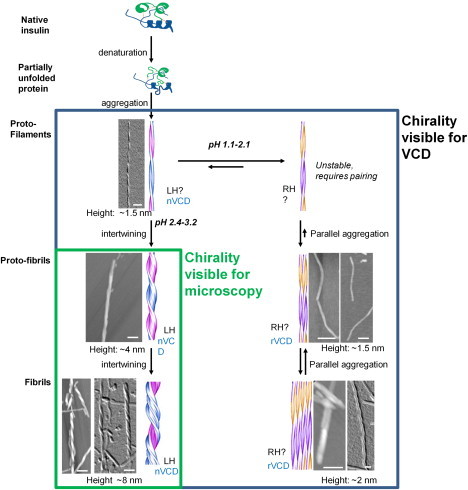
Effect of pH on the insulin aggregation pathway and the sense of fibril supramolecular chirality. LH, left-handed; RH, right-handed; nVCD, normal VCD; rVCD, reversed VCD. Scale bars are 50 nm.
In Scheme 1, we additionally propose that there exists an equilibrium between left- and right-twisted fibrils for pH values between 1.5 and 2.5, and that conversion of fibrils with reversed VCD to normal VCD must pass through this protofilament equilibrium stage. Because there is no braiding for fibrils with binary or tape-like structure, when the pH is increased well above 2.0, their passage to NFs with left-twisted structure is a much simpler process than unwinding already braided left-twisted structures. In fact, we recently reported that insulin fibrils with reversed VCD can spontaneously convert to fibrils with normal VCD when the pH is raised from 1.5 to 2.5, but it is not possible to convert insulin fibrils with normal VCD to fibrils with reversed VCD by lowering the pH from 2.5 to 1.5 (30).
It is not entirely clear why AFM and SEM can image left-twisted insulin protofilaments but not the corresponding right-twisted protofilaments. One strong possibility, as indicated in Scheme 1, is that the latter are not stable and quickly aggregate into tape-like or binary structures where the right-twist of the individual protofilaments is not apparent. They may also have a lower pitch of helical twist (i.e., a repeat distance significantly > 100 nm) that would make the twist more difficult to see with AFM or SEM imaging.
Conclusions
In conclusion, our findings and all experimental evidence available to date strongly indicate that tape-like individual and binary fibrils give rise to a reversed VCD spectrum, despite the fact that these fibrils are assembled from protofilaments and protofibrils that initially, at least, have an observable left-handed twist and a characteristic normal VCD. The normal VCD spectrum is a spectroscopic signature of amyloid fibrils with a strong left-handed twist and a lack of tape-like morphology. Thus far, no right-handed twist morphology has been associated with the observation of reversed VCD. This pH-driven determination of amyloid fibril morphology has been observed for other amyloid fibrils, such as those formed by HET-S218-289 and α-synuclein (31,32). In both cases, the pH determines the formation of either flat-like tapes or twisted cable-like fibrils. These observations lead us to conclude that control of amyloid fibril morphology by pH may be a general feature of fibril formation, and that these two basic types of morphology are associated with opposite supramolecular chirality at the level of protofilament structure.
Acknowledgments
We thank Aliaksandra Sikrzhytskaya for assistance with the graphics.
This work was supported by the National Institute on Aging, National Institutes of Health (R01AG033719 to I.K.L.), and the National Science Foundation (SBIR phase II grant IIP-0945484 to R.K.D., L.A.N., and X.L.).
Supporting Material
References
- 1.Dobson C.M. Protein misfolding, evolution and disease. Trends Biochem. Sci. 1999;24:329–332. doi: 10.1016/s0968-0004(99)01445-0. [DOI] [PubMed] [Google Scholar]
- 2.Sipe J.D. Wiley-VCH, Weinheim; Germany: 2005. Amyloid Proteins: The Beta Sheet Conformation and Disease. [Google Scholar]
- 3.Dobson C.M. Protein folding and misfolding. Nature. 2003;426:884–890. doi: 10.1038/nature02261. [DOI] [PubMed] [Google Scholar]
- 4.Ivanova M.I., Sievers S.A., Eisenberg D. Molecular basis for insulin fibril assembly. Proc. Natl. Acad. Sci. USA. 2009;106:18990–18995. doi: 10.1073/pnas.0910080106. [DOI] [PMC free article] [PubMed] [Google Scholar]
- 5.Störkel S., Schneider H.M., Kashiwagi S. Iatrogenic, insulin-dependent, local amyloidosis. Lab. Invest. 1983;48:108–111. [PubMed] [Google Scholar]
- 6.Westermark P., Wernstedt C., Johnson K.H. Amyloid fibrils in human insulinoma and islets of Langerhans of the diabetic cat are derived from a neuropeptide-like protein also present in normal islet cells. Proc. Natl. Acad. Sci. USA. 1987;84:3881–3885. doi: 10.1073/pnas.84.11.3881. [DOI] [PMC free article] [PubMed] [Google Scholar]
- 7.Dische F.E., Wernstedt C., Watkins P.J. Insulin as an amyloid-fibril protein at sites of repeated insulin injections in a diabetic patient. Diabetologia. 1988;31:158–161. doi: 10.1007/BF00276849. [DOI] [PubMed] [Google Scholar]
- 8.Anderson M., Bocharova O.V., Baskakov I.V. Polymorphism and ultrastructural organization of prion protein amyloid fibrils: an insight from high resolution atomic force microscopy. J. Mol. Biol. 2006;358:580–596. doi: 10.1016/j.jmb.2006.02.007. [DOI] [PubMed] [Google Scholar]
- 9.Seilheimer B., Bohrmann B., Döbeli H. The toxicity of the Alzheimer's β-amyloid peptide correlates with a distinct fiber morphology. J. Struct. Biol. 1997;119:59–71. doi: 10.1006/jsbi.1997.3859. [DOI] [PubMed] [Google Scholar]
- 10.Krishnan R., Lindquist S.L. Structural insights into a yeast prion illuminate nucleation and strain diversity. Nature. 2005;435:765–772. doi: 10.1038/nature03679. [DOI] [PMC free article] [PubMed] [Google Scholar]
- 11.Kreplak L., Aebi U. From the polymorphism of amyloid fibrils to their assembly mechanism and cytotoxicity. Adv. Protein Chem. 2006;73:217–233. doi: 10.1016/S0065-3233(06)73007-8. [DOI] [PubMed] [Google Scholar]
- 12.Petkova A.T., Leapman R.D., Tycko R. Self-propagating, molecular-level polymorphism in Alzheimer's β-amyloid fibrils. Science. 2005;307:262–265. doi: 10.1126/science.1105850. [DOI] [PubMed] [Google Scholar]
- 13.Jiménez J.L., Nettleton E.J., Saibil H.R. The protofilament structure of insulin amyloid fibrils. Proc. Natl. Acad. Sci. USA. 2002;99:9196–9201. doi: 10.1073/pnas.142459399. [DOI] [PMC free article] [PubMed] [Google Scholar]
- 14.Jansen R., Dzwolak W., Winter R. Amyloidogenic self-assembly of insulin aggregates probed by high resolution atomic force microscopy. Biophys. J. 2005;88:1344–1353. doi: 10.1529/biophysj.104.048843. [DOI] [PMC free article] [PubMed] [Google Scholar]
- 15.Paravastu A.K., Qahwash I., Tycko R. Seeded growth of β-amyloid fibrils from Alzheimer's brain-derived fibrils produces a distinct fibril structure. Proc. Natl. Acad. Sci. USA. 2009;106:7443–7448. doi: 10.1073/pnas.0812033106. [DOI] [PMC free article] [PubMed] [Google Scholar]
- 16.Rubin N., Perugia E., Addadi L. Relation between serum amyloid A truncated peptides and their suprastructure chirality. J. Am. Chem. Soc. 2010;132:4242–4248. doi: 10.1021/ja909345p. [DOI] [PubMed] [Google Scholar]
- 17.Kurouski D., Lombardi R.A., Nafie L.A. Direct observation and pH control of reversed supramolecular chirality in insulin fibrils by vibrational circular dichroism. Chem. Commun. (Camb.) 2010;46:7154–7156. doi: 10.1039/c0cc02423f. [DOI] [PubMed] [Google Scholar]
- 18.Ma S., Cao X., Nafie L.A. Vibrational circular dichroism shows unusual sensitivity to protein fibril formation and development in solution. J. Am. Chem. Soc. 2007;129:12364–12365. doi: 10.1021/ja074188z. [DOI] [PubMed] [Google Scholar]
- 19.Measey T.J., Schweitzer-Stenner R. Vibrational circular dichroism as a probe of fibrillogenesis: the origin of the anomalous intensity enhancement of amyloid-like fibrils. J. Am. Chem. Soc. 2011;133:1066–1076. doi: 10.1021/ja1089827. [DOI] [PubMed] [Google Scholar]
- 20.Fulara A., Lakhani A., Dzwolak W. Spiral superstructures of amyloid-like fibrils of polyglutamic acid: an infrared absorption and vibrational circular dichroism study. J. Phys. Chem. B. 2011;115:11010–11016. doi: 10.1021/jp206271e. [DOI] [PubMed] [Google Scholar]
- 21.Rubin N., Perugia E., Addadi L. Chirality of amyloid suprastructures. J. Am. Chem. Soc. 2008;130:4602–4603. doi: 10.1021/ja800328y. [DOI] [PubMed] [Google Scholar]
- 22.Goldsbury C.S., Cooper G.J., Kistler J. Polymorphic fibrillar assembly of human amylin. J. Struct. Biol. 1997;119:17–27. doi: 10.1006/jsbi.1997.3858. [DOI] [PubMed] [Google Scholar]
- 23.Lednev I.K., Ermolenkov V.V., Xu M. Deep-UV Raman spectrometer tunable between 193 and 205 nm for structural characterization of proteins. Anal. Bioanal. Chem. 2005;381:431–437. doi: 10.1007/s00216-004-2991-5. [DOI] [PubMed] [Google Scholar]
- 24.Bowman A., Azzalini A. Oxford University Press; Oxford: 1997. Applied Smoothing Techniques for Data Analysis. [Google Scholar]
- 25.Dzwolak W., Pecul M. Chiral bias of amyloid fibrils revealed by the twisted conformation of Thioflavin T: an induced circular dichroism/DFT study. FEBS Lett. 2005;579:6601–6603. doi: 10.1016/j.febslet.2005.10.048. [DOI] [PubMed] [Google Scholar]
- 26.Loksztejn A., Dzwolak W. Chiral bifurcation in aggregating insulin: an induced circular dichroism study. J. Mol. Biol. 2008;379:9–16. doi: 10.1016/j.jmb.2008.03.057. [DOI] [PubMed] [Google Scholar]
- 27.Dzwolak W. Vortex-induced chiral bifurcation in aggregating insulin. Chirality. 2010;22(Suppl 1):E154–E160. doi: 10.1002/chir.20896. [DOI] [PubMed] [Google Scholar]
- 28.Khurana R., Ionescu-Zanetti C., Carter S.A. A general model for amyloid fibril assembly based on morphological studies using atomic force microscopy. Biophys. J. 2003;85:1135–1144. doi: 10.1016/S0006-3495(03)74550-0. [DOI] [PMC free article] [PubMed] [Google Scholar]
- 29.Measey T.J., Smith K.B., Schweitzer-Stenner R. Self-aggregation of a polyalanine octamer promoted by its C-terminal tyrosine and probed by a strongly enhanced vibrational circular dichroism signal. J. Am. Chem. Soc. 2009;131:18218–18219. doi: 10.1021/ja908324m. [DOI] [PMC free article] [PubMed] [Google Scholar]
- 30.Kurouski D., Dukor R.K., Lednev I.K. Spontaneous inter-conversion of insulin fibril chirality. Chem. Commun. (Camb.) 2012;48:2837–2839. doi: 10.1039/c2cc16895b. [DOI] [PMC free article] [PubMed] [Google Scholar]
- 31.Sen A., Baxa U., Steven A.C. Mass analysis by scanning transmission electron microscopy and electron diffraction validate predictions of stacked β-solenoid model of HET-s prion fibrils. J. Biol. Chem. 2007;282:5545–5550. doi: 10.1074/jbc.M611464200. [DOI] [PubMed] [Google Scholar]
- 32.Hoyer W., Antony T., Subramaniam V. Dependence of α-synuclein aggregate morphology on solution conditions. J. Mol. Biol. 2002;322:383–393. doi: 10.1016/s0022-2836(02)00775-1. [DOI] [PubMed] [Google Scholar]
Associated Data
This section collects any data citations, data availability statements, or supplementary materials included in this article.