

Abstract
Inward rectifier potassium (Kir) channels act as cellular diodes, allowing unrestricted flow of potassium (K+) into the cell while preventing currents of large magnitude in the outward direction. The rectification mechanism by which this occurs involves a coupling between K+ and intracellular blockers—magnesium (Mg2+) or polyamines—that simultaneously occupy the permeation pathway. In addition to the transmembrane pore, Kirs possess a large cytoplasmic domain (CD) that provides a favorable electronegative environment for cations. Electrophysiological experiments have shown that the CD is a key regulator of both conductance and rectification. In this study, we calculate and compare averaged equilibrium probability densities of K+ and Cl− in open-pore models of the CDs of a weak (Kir1.1-ROMK) and a strong (Kir2.1-IRK) rectifier through explicit-solvent molecular-dynamics simulations in ∼1 M KCl. The CD of both channels concentrates K+ ions greater than threefold inside the cytoplasmic pore while IRK shows an additional K+ accumulation region near the cytoplasmic entrance. Simulations carried out with Mg2+ or spermine (SPM4+) show that these ions interact with pore-lining residues, shielding the surface charge and reducing K+ in both channels. The results also show that SPM4+ behaves differently inside these two channels. Although SPM4+ remains inside the CD of ROMK, it diffuses around the entire volume of the pore. In contrast, this polyatomic cation finds long-lived conformational states inside the IRK pore, interacting with residues E224, D259, and E299. The strong rectifier CD is also capable of sequestering an additional SPM4+ at the cytoplasmic entrance near a cluster of negative residues D249, D274, E275, and D276. Although understanding the actual mechanism of rectification blockade will require high-resolution structural information of the blocked state, these simulations provide insight into how sequence variation in the CD can affect the multi-ion distributions that underlie the mechanisms of conduction, rectification affinity, and kinetics.
Introduction
Inward rectifier potassium (Kir) channels are involved in a multitude of physiological processes, but their primary function is to regulate outwardly directed K+ current. They do this through a process called rectification, which occurs via blockade of outward current by intracellular cations such as Mg2+ (1,2) and polyamines like spermine (3,4). Approximately half of the Kir subtypes exhibit very little rectification behavior, and so by convention Kir channels are also classified as being weak or strong. For example, Kir1.1-ROMK is a weak rectifier that regulates K+ secretion into the urine, whereas Kir2.1-IRK is a strong rectifier in excitable muscle tissues, virtually shutting off K+ current during depolarization thereby helping to repolarize the membrane in between action potentials. X-ray crystallography (5–8) shows that the structure of the Kir conduction pore is formed by two components: 1), a KcsA-like transmembrane domain containing the K+ selectivity filter (9,10) and 2), a wide cytoplasmic domain (CD) that extends the permeation pathway into the intracellular solution by >50 Å (Fig. 1). Strong rectifiers carry a conserved negative residue in the aqueous vestibule just below the selectivity filter—the transmembrane cavity. Inserting a negative charge into the cavity of the weak ROMK confers strong rectification to this channel; however, neutralizing this residue in the strong IRK does not abolish it (11,12). On the other hand, it appears that a particular CD sequence is sufficient for strong rectification because exchanging the entire CD of the strong IRK to the weak ROMK confers strong rectification in the absence of the cavity negative residue (13,14).
Figure 1.
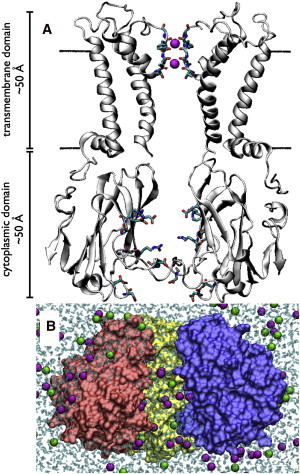
Kir channel structure and simulation setup. (A) The full-length Kir2.1/IRK open model. The two opposing positioned subunits of the transmembrane (I and III, residues 57–184) and cytoplasmic (II and IV, residues 185–350) domains are shown to reveal the ion permeation pathway. (Black line) Position of the membrane. The selectivity filter backbone atoms, including the K+ ions (magenta spheres), are shown explicitly. Side chains of residues in the cytoplasmic domain that are strong contributors to the electrostatic environment inside the pore of Kir2.1/IRK are also shown (E224, R228, D247, D255, D259, R260, and E299). (B) A snapshot of the all-atom, solvated open model of the Kir2.1/IRK cytoplasmic domain simulation system with ∼1 M KCl. (Magenta) K+ ions. (Green) Cl− ions. (Cyan) Water molecules. One of the subunits has been removed to show water and ions inside the pore.
Although it is evident that the CD plays a significant role in rectification, it has been difficult to reconcile this with the fact that the phenomenon is strongly voltage-dependent. This means that the blocker is affected, directly or indirectly, by the transmembrane potential that is focused across the selectivity filter located >35 Å away from the CD (15). How the CD exerts its influence over such a long-range distance to participate in strong rectification is a puzzle. One plausible explanation is that the multiple K+ ions organize as a strongly correlated single file along the full length of the conduction pore, and that the interaction of blockers with this file of ions at the CD then couples to the voltage-dependent movement of K+ ions across the selectivity filter (16). Recently, several high-resolution x-ray crystal structures have been solved showing these types of filed ion densities in the CD (6–8,17–20). These results provide a picture of how ions associate inside the long pore of the channel. However, these structures show the channels in multiple conformations—closed and intermediately open states (see Table S2, Fig. S1, Fig. S2, Fig. S3, Fig. S4, and Fig. S5 in the Supporting Material)—and it is not known if they correspond to the conductive structure relevant to rectification. Even in the closed state, the CD forms a large volume that could attract and accommodate multiple ions that are not resolvable in the crystal structure, and this could increase in the conductive state of the channel. Furthermore, it is not known how ion organization differs between the weak and strong rectifiers, as all of the mammalian CDs crystallized so far fall into the strong-rectifier category.
A previous study calculating the electrostatic free energy of K+ along open models of the pore of ROMK and IRK based on continuum electrostatics showed that in both channels, the CD creates a K+-favorable electronegative environment (21). However, these calculations were qualitative scans of pore energetics reflecting a nonphysical situation of a single ion in the pore. In reality, the wide CDs contain permeant K+ and rectification blockers simultaneously, and under these conditions, weak and strong rectifiers might show differences in the way ions are distributed inside the pore. Here, we take a computational approach, using molecular dynamics (MD) simulations with explicit ions and water, to calculate average equilibrium K+ and Cl− densities inside the CDs of ROMK and IRK. Although these structural models are relatively crude—they are only homology models rather than high-resolution crystal structures—we can use this to our advantage to examine the effect of sequence variation, by itself, on the same structural scaffold. The results show that both the ROMK and IRK CDs are strong cation attractors, significantly increasing concentrations of K+ inside the pore. We also find that spermine behaves differently in the strong-rectifier CD, finding long-lived configurations inside the pore and near the cytoplasmic entrance that are not observed in the weak-rectifier simulations.
Methods
Structural models
The structures of the CDs of ROMK and IRK were taken from homology models of the full-length channels (21) based on the open state model of KirBac1.1 that in turn is derived from the electron crystallography structure of KirBac3.1 (5,22,23). Relationships of these models with other crystal-derived structures are shown in Table S2 and in Fig. S1, Fig. S2, Fig. S3, Fig. S4, Fig. S5, Fig. S6, and Fig. S7. Residues 184–350 of ROMK and 185–350 of IRK were isolated corresponding to the same structural region in the two channels. The total number of protein atoms is 10,808 for ROMK and 10,828 for IRK, while the total charge is QROMK = +20 e and QIRK = −24 e for each domain, respectively, where all titratable residues were set to their native charge state: GLU/ASP = −1, ARG/LYS = +1, HIS = 0. For each channel, three separate initial structures were used in the simulations to introduce variability from the protein modeling. The root mean-square deviation (RMSD) of all protein atoms between these different models is ∼3.5 Å for both channels. One simulation was carried out for the closed-form crystal structure of IRK (PDB:1U4F) in ∼1 M KCl (24). This structure is different from the open models as it contains residues 45–64 of the N-terminus and 189–368 of the CD, corresponding to 12,646 atoms with an overall charge of Q1U4F = −28 e.
MD simulations
MD simulations with explicit solvent and ions were carried out on a total of 19 separate systems of the CD of either ROMK or IRK in ∼1 M KCl. For each system, an orthorhombic box of waters with density of 0.0334 waters/Å3 was built to extend 12 Å from the protein edges, and all water molecules overlapping within 2.6 Å were deleted. Ions were inserted into the system by random replacement of water molecules. The number of KCl molecules was calculated by nKCl = [C]Vion, where [C] = 1 M and Vion is the ion-accessible volume determined by multiplying the number of waters in the system by the individual volume of a water molecule at standard density, Vwater = 29.89 Å3. To maintain electroneutrality, an additional Qprot number of counterions were added to the solution to balance out the protein charge. For example, if Qprot = +20 e, then an additional 20 Cl− ions were added to the solution. As a result, the actual ion concentrations are very close to, but not exactly 1 M in each simulation. A snapshot of one of the configurations of the CD of IRK, waters, and ions is shown in Fig. 1. For the Mg2+/KCl simulations, four Mg2+ ions were aligned along the central pore as part of the initial protein configuration. The system was then built as described with the K+ ion number reduced by eight to balance the addition of +8 e charge of the Mg2+ ions. Similarly, the SPM4+/KCl simulations were built with the molecule aligned along the central axis in a fully extended conformation (from −8.5 Å < Z < 8.5 Å), with the number of K+ ions offset by the addition +4 e charge. The initial construction of the systems was done using MMTSB (25) and CHARMM version c33a2 (26). The complete simulation details of each system are specified in Table S1.
The minimization and MD simulations were performed using NAMD (27), with the CHARMM27 force-field parameters (28); the water potential TIP3 was used (29) and the ions as developed previously (30). Parameters for SPM4+ were obtained from S. Y. Noskov (Weill Cornell School of Medical Sciences, personal communication, 2004). Equilibration consisted of initial restraint of the protein atoms, with gradual relaxation over a series of short minimization and MD cycles. During the production run, a 2 kcal/mole harmonic restraint on the Cα atom position was maintained to limit overall structural changes within the protein, though side chains were left completely free. The simulations used Langevin dynamics at 310 K and a Langevin piston for pressure control. Periodic boundaries were employed in the x, y, and z directions. Electrostatics were calculated using the particle-mesh Ewald algorithm, with a grid dimensions 120 Å × 120 Å × 108 Å. The real-space short-range nonbonded interactions were truncated at 10 Å. The software package RATTLE was used to fix the bond lengths of hydrogen atoms and a timestep of 2 fs was used throughout the simulation. Overall, >300 ns of simulation time was generated and ∼380,000 CPU hours were used in calculating the results in this study.
The time series of the (x,y,z) position of all ions were generated using VMD (31). To calculate the densities, the radial position was calculated as R = (x2 + y2)1/2 at every frame. The time series was then binned into 1 Å increments of ΔR and ΔZ. The number of counts in each bin was divided by the total number of frames in the time series and by the volume element because the radial volume increases as R increases. The volume element is the cylindrical annulus calculated at the center of the ith bin as ΔVi = π (Ri+12-Ri2) ΔZ. The resultant densities are in units of ions/Å3. Note that in these results the spatial density naturally converges to ρ1M = 6.022 × 10⁻⁴ ions/Å3 in the bulk solution and was not imposed in the normalization.
Results
In this study, we simulate mammalian homology models of isolated, open CDs, based on the open-model of KirBac1.1 derived from an electron-crystallography density map (21–23). This is admittedly a low-resolution model of the open state, but in this study we are not interested in the precise molecular details of the protein, simply a common structural scaffold to test changes in ion interactions with the protein that come about from sequence variation only. However, we expect that these models are reasonable estimates of the open states based on structural information currently available, and sufficiently accurate for the purpose of our study. To date, 31 crystallographic structures of Kir channels have been deposited into the Protein Data Bank, including prokaryotic and mammalian homologs (see Table S2). Most of these channel structures are in a closed conformation, either at the transmembrane helix-bundle or in the G-loop gate at the top of the CD (see Fig. S1, Fig. S2, Fig. S3, Fig. S4, and Fig. S5). Recent crystallization of Kir3.2/GIRK2 with a constitutively active mutation R201A, and activating lipid PIP2, yielded a structure with two out of the four inner helices in a possible open conformation (17). Although this x-ray structure represents the most opened conformation to date, it may still correspond to a partially open state of the channel, because the radius is <5 Å at two positions along the pore (see Fig. S1). The open models of ROMK and IRK used for this study are only 3–5 Å wider than the Kir3.2/GIRK2 crystallographic structure.
Additional differences in the models arise from inherent differences in the cytoplasmic subunits of Kirs, as indicated by the RMSDs of the subunit Cα for different types of Kir structures (see Table S3). For mammalian channels, i.e., Kir2 versus Kir3, the subunit RMSD is up to 2 Å, whereas comparing prokaryotic versus mammalian structures gives RMSD values > 3 Å. Our models, being built upon a prokaryotic template, are also within this range. Overlaying these structures shows that the differences are mainly in the loop regions whereas the β-strands forming the pore are better aligned (see Fig. S7). This means that the pore-lining residues are in a similar position in the crystal structures and our models. The pore openings of the latter are wider than those from x-ray crystal structures but reflect a similar architecture with the same residues lining the pore. In support, we have previously carried out extensive electrostatics analysis using these homology models, showing a strong correlation between the electrostatic positions of residues shown to be important in conduction, rectification, and gating (19). To this date, there have been no crystal structures of weak rectifiers and whether their CDs have the same conformation in the open state is uncertain. With our approach emphasizing electrostatic interactions in the more open models, the impact of such changes is minimized.
Throughout the simulations, the Cα atoms of the protein were restrained to limit conformational changes in the tetramer. In addition, for each channel and ion condition, three separate simulations were carried out starting with a different protein model and randomized initial configurations of ions. The calculated densities reflect the number of ions in a normalized volume element defined by (R, Z), averaged over the total number of frames in each simulation. The density plots shown throughout the article represent averages calculated from three separate converged simulations, and tabulated numbers of ions inside each domain are reported as averages ± standard deviation (n = 3).
K+ and Cl− inside the CD pore
The density distributions of K+ and Cl− are shown for the two inward-rectifier CD systems, ROMK and IRK (Fig. 2). For each simulation, the concentration of K+ and Cl− converged to ∼1 M in the bulk region outside of the CD, indicating equilibration of the ions in the system. In this respect, these ion densities are referenced to the concentrations in the bulk solution and the calculated increases represent absolute values.
Figure 2.
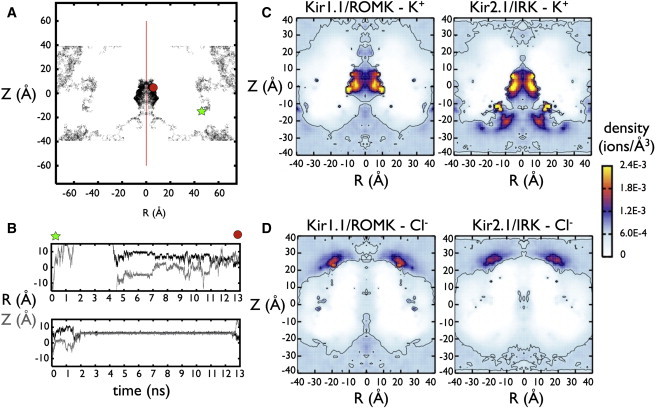
K+ and Cl− in Kir1.1/ROMK and Kir2.1/IRK cytoplasmic domains. (A) An example K+ ion trajectory from one Kir2.1/IRK simulation. This trajectory and subsequent density plots are shown as functions of radial distance from the pore axis (R = sqrt(X2+Y2)) and height in the simulation box (Z). For a clearer visualization of the cytoplasmic pore structure, all plots are represented for the real values of R > 0 Å, as well as the mirror image defined for R < 0 Å, along the pore-axis symmetry line (red). In this trajectory, the K+ ion starts at position (R, Z) = (47.7 Å, −11.3 Å), represented by a symbol (green star) where it travels around the bulk and exits the top of the simulation box. Under periodic boundary conditions, the same ion reenters at the bottom of the cell (i.e., Z = −60 Å and Z = 60 Å are identical) and then finds its way into the cytoplasmic pore (R < 15 Å, −9 Å < Z < 15 Å) where it remains until the end of the simulation (red circle). (B) Two example time series of K+ inside the Kir2.1/IRK pore, with radial position R (black) and pore position Z (gray). The top time series is the same trajectory from panel A, showing the ion entering the pore and jumping from stationary sites along the protein surface. The bottom time series is another ion from the same simulation, showing a long-lived interaction, which exits the pore at the end of the simulation. (C) K+ and (D) Cl− density distributions in Kir1.1/ROMK and Kir2.1/IRK. The density plots are calculated for each simulation and then averaged between three separate runs. A molecular density of ρ = 6.022 × 10⁻⁴ ions/Å3 corresponds to 1 M concentration. Contours are shown for densities corresponding to 1 and 2.5 M.
Both ROMK and IRK attract K+ inside the CD, with local concentrations exceeding 3 M. For the central pore, defined within 15 Å of the center of the domain at (R, Z) = (0 Å, 0 Å), the average K+ occupancy is similar, with 9.6 ± 1.4 for ROMK and 7.7 ± 2.1 for IRK (Table 1). The density of K+ is highest near the protein surface, as K+ interacts directly with protein residues as opposed to being focused along the central pore axis. Sample traces of stepwise movement of K+ ions along the protein surface are shown in Fig. 2 B. The calculated diffusion coefficient is more than twofold reduced for K+ inside both CDs (see Fig. S8). In addition, IRK shows an enrichment region for K+ near the cytoplasmic entrance to the pore that is not present in ROMK. This leads to a doubling of the number of K+ in this region: 23.3 ± 0.9 vs. 11.4 ± 1.7.
Table 1.
Ion localization in the cytoplasmic domain: ∼1 M KCl simulations
| Kir1.1/ROMK |
Kir2.1/IRK |
Kir2.1/IRK (1U4F) |
||||
|---|---|---|---|---|---|---|
| K+ | Cl− | K+ | Cl− | K+ | Cl− | |
| Central pore (R < 15 Å, −9 Å < Z < 15 Å) | 9.6 ± 1.4 | 1.6 ± 0.2 | 7.7 ± 2.1 | 0.9 ± 0.3 | 4.8 | 0.0 |
| PIP2 binding region (5 Å < R < 30 Å, 15 Å < Z < 30 Å) | 11.1 ± 0.4 | 30.4 ± 1.0 | 11.7 ± 0.0 | 27.3 ± 0.7 | 17.7 | 18.6 |
| Constriction region (R < 15 Å, 15 Å < Z < 25 Å) | 1.7 ± 0.2 | 1.3 ± 0.2 | 0.8 ± 0.0 | 1.0 ± 0.2 | 0.5 | 1.2 |
| Cytoplasmic entrance (R < 20 Å, −30 Å < Z < −10Å) | 11.4 ± 1.7 | 8.7 ± 1.1 | 23.3 ± 0.9 | 7.7 ± 0.5 | 21.2 | 7.0 |
| Bulk (R < 40 Å, 35 Å < Z < 40 Å) | 15.8 ± 0.3 | 16.1 ± 0.2 | 13.6 ± 1.7 | 13.8 ± 1.9 | 16.6 | 16.8 |
All numbers are represented as averages ± SD, calculated over three independent runs, except the numbers for the 1U4F simulation, which was calculated from a single run.
The chloride concentration is low inside the CD, but Cl− ions are not completely excluded. On average, there are 1.6 ± 0.2 Cl− ions inside the central core of the domain of ROMK and 0.9 ± 0.3 in IRK (Table 1). Although there are positively charged residues within the central region of IRK, Cl− remains delocalized reflecting charge-screening by the more strongly interacting K+ in the pore. Outside of the pore, there is a region of increased Cl− density near the part of the CD that connects to the transmembrane pore in the full-length protein. This is due to a large number of positively charged residues present that interact with PIP2 in all mammalian Kir channels (32) and in the absence of this negatively charged lipid, Cl− acts as a counterion.
We also carried out a simulation of the closed IRK CD crystal structure, PDB:1U4F (24), in ∼1 M KCl (Fig. 3). Qualitatively, the crystal structure gives similar results to the open model, accumulating many K+ ions inside the pore. However, the K+ enrichment region at the cytoplasmic entrance in the open model is now closer to the center of the pore and forms a coordinating site for a hydrated cation in the closed state. This ion interacts with residues D255 and D259 and remains throughout the entire simulation. A structure of a mutant of the IRK CD crystallized in the presence of KCl shows a hydrated ion at the same position (PDB:2GIX) (18). Note that the closed state does not show Cl− accumulation near the transmembrane PIP2 binding region because this structure is truncated and does not contain those positive residues.
Figure 3.
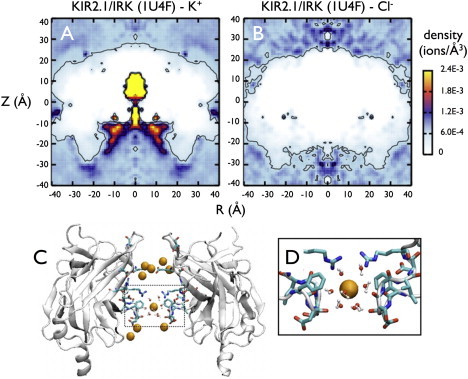
Ion densities in the crystal structure of a closed Kir2.1/IRK cytoplasmic domain, PDB:1U4F. (A) K+ and (B) Cl− radial density plots. (C) A snapshot of ions inside the pore, with two of the subunits removed for clarity. Charged residues that line the pore are shown explicitly as in Fig. 1. (D) A closeup view of the hydrated K+ ion near the cytoplasmic entrance of the pore that remains throughout the simulation (15 ns).
K+ and Cl− in the presence of rectification blockers: Mg2+ and SPM4+
Simulations were carried out in ∼1 M KCl, with either four Mg2+ ions or an extended spermine (SPM4+) molecule initially aligned along the central axis, with these overall ratios (Mg2+:K+ ∼1:125 and SPM4+:K+ ∼1:500) chosen to approximate physiological concentrations (33). The rectification cations, along with all other ions and solvent were simulated without constraints. It is important to note that whereas K+ and Cl− ions freely exchanged between the CD and the bulk, these events did not occur for Mg2+ or SPM4+. In each simulation, one Mg2+ ion exited the CD, never to return, whereas the other three remained in the pore for the duration of the run. We never observed SPM4+ leaving the pore in any of the simulations. Therefore, although the absolute magnitudes of K+ and Cl− densities are meaningful as they are determined relative to the equilibrated bulk solution, we are limited to analyzing only local effects of Mg2+ and SPM4+ inside the cytoplasmic pore.
The densities for Mg2+, K+, and Cl− are shown in Fig. 4, A–F. The Mg2+ ion distribution is similar for both channels and on average, three Mg2+ ions remain inside the pore for each homolog (Table 2). As was observed with K+, Mg2+ interacts preferentially with the protein surface, showing periods of diffusive behavior interrupted by long-lived interactions inside the pore. The presence of Mg2+ inside the pore changes how other ions distribute inside the channel. As Mg2+ binds to negative residues it screens the charge and changes the pore electrostatics. In both channels, K+ is reduced approximately twofold inside the CD (from 10 to 6 K+ ions in ROMK and 8–4 ions in IRK). There is also a modest reduction at the cytoplasmic entrance of IRK (from 23 to 20 ions) coming from the Mg2+ ion that exits the pore and resides here about half of the time. This does not occur in the ROMK simulation. The number of Cl− ions also increases slightly, with one additional ion inside the cytoplasmic pore in both channels. This suggests that the distribution of K+ and Mg2+ inside the pore sufficiently shields the protein static field to allow for the stabilization of Cl− inside an overwhelmingly electronegative protein environment.
Figure 4.
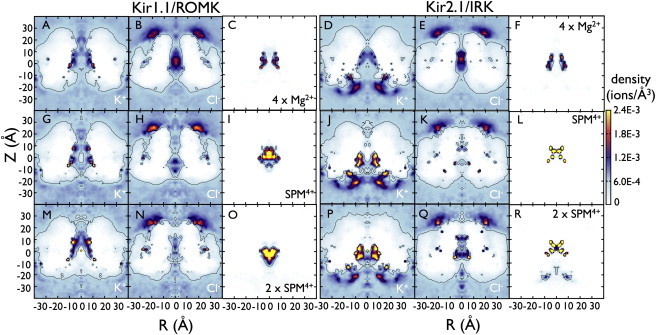
K+ and Cl− densities in the presence of rectification blockers Mg2+ and SPM4+. Density plots of: K+ (A) and Cl− (B) with 4 Mg2+ ions inside the CD of ROMK (C); K+ (D) and Cl− (E) with 4 Mg2+ ions inside the CD of IRK (F). Each plot was calculated from an average over three simulations. Density plots of: K+ (G), Cl− (H), and SPM4+ (I) in a single structural model of ROMK; K+ (J), Cl− (K), and SPM4+ (L) in a single structural model of IRK. Averaged density plots for single spermine simulations are shown in Fig. S9. Density plots of K+, Cl−, and SPM4+ after an additional spermine molecule is added along the pore from −24 Å < Z < −6 Å and simulated for 10 ns: K+ (M), Cl− (N), and SPM4+ (O) in ROMK, and K+ (P), Cl− (Q), and SPM4+ (R) in IRK. The spermine densities are calculated using the nitrogen atoms (N1, N2, N3, N4) as the ions. A molecular density of ρ = 6.022 × 10⁻⁴ ions/Å3 is equivalent to 1 M concentration, and contours are shown for densities corresponding to 1 and 2.5 M. Note that whereas K+ and Cl− adequately sample the system and converge to 1 M in the bulk, Mg2+ and SPM4+ remain mainly in the pore throughout the simulations. Therefore, the Mg2+ and SPM4+ distributions can only be interpreted as local densities and do not represent equilibrium.
Table 2.
Ion localization inside the cytoplasmic domain: 4 Mg2+ + ∼1 M KCl simulations
| Kir1.1/ROMK |
Kir2.1/IRK |
|||||
|---|---|---|---|---|---|---|
| Mg2+ | K+ | Cl− | Mg2+ | K+ | Cl− | |
| Central pore (R < 15 Å, −9 Å < Z < 15 Å) | 2.8 ± 1.0 | 5.7 ± 0.4 | 3.1 ± 0.5 | 2.8 ± 1.2 | 3.7 ± 1.4 | 1.9 ± 0.6 |
| PIP2 binding region (5 Å < R < 30 Å, 15 Å < Z < 30 Å) | 0.0 ± 0.1 | 11.3 ± 0.3 | 30.9 ± 0.8 | 0.0 ± 0.0 | 10.8 ± 1.4 | 27.7 ± 1.1 |
| Constriction region (R < 15 Å, 15 Å < Z < 25 Å) | 0.0 ± 0.0 | 1.7 ± 0.1 | 1.5 ± 0.2 | 0.0 ± 0.0 | 0.8 ± 0.1 | 1.1 ± 0.2 |
| Cytoplasmic entrance (R < 20 Å, −30 Å < Z < −10Å) | 0.2 ± 0.2 | 10.8 ± 0.7 | 8.6 ± 0.4 | 0.2 ± 0.3 | 20.2 ± 2.9 | 7.9 ± 0.8 |
| Bulk (R < 40 Å, 35 Å < Z < 40 Å) | 0.1 ± 0.0 | 16.4 ± 0.3 | 16.7 ± 0.3 | 0.1 ± 0.0 | 12.9 ± 2.5 | 14.0 ± 1.6 |
All numbers are represented as averages ± SD (n = 3).
The densities of SPM4+, K+, and Cl− distributions are shown for a single protein model in Fig. 4, G–R, while the averages are shown in Fig. S9. The SPM4+ density was calculated using the positions of the four charged nitrogen atoms in the molecule. The profiles are similar to the Mg2+ density plots, but instead of interacting with the protein surface the SPM4+ charges fill the pore. In addition, the distribution inside ROMK is diffuse compared to IRK. As was the case for Mg2+, the presence of SPM4+ depletes cytoplasmic K+ twofold, with a reduction from 10 to 6 ions in ROMK and 8–5 ions in IRK (Table 3). The enrichment region along the cytoplasmic entrance of IRK remains, still accumulating ∼20 K+ ions near the internal mouth of the pore. We investigated whether a second SPM4+ molecule could interact with this part of the protein while a first SPM4+ was inside the CD. The second molecule was aligned along the pore-axis from −24 Å < Z < −6 Å and then run unrestrained for 10 ns. In the ROMK simulation, the second SPM4+ diffuses away to the bulk after 5 ns. However, in the IRK simulation it remains close to the cytoplasmic entrance throughout the entire 10 ns, resulting in an increased density in this region (Fig. 4 R). In the SPM4+ simulations, the Cl− densities do not increase with SPM4+ inside the cytoplasmic pore.
Table 3.
Ion localization inside the cytoplasmic domain: SPM4+ + ∼1 M KCl simulations
| Kir1.1/ROMK |
Kir2.1/IRK |
|||||
|---|---|---|---|---|---|---|
| SPM4+ | K+ | Cl− | SPM4+ | K+ | Cl− | |
| Central pore (R < 15 Å, −9 Å < Z < 15 Å) | 4.0 ± 0.0 | 5.9 ± 0.4 | 2.0 ± 0.6 | 3.7 ± 0.3 | 4.7 ± 1.4 | 1.4 ± 0.1 |
| PIP2 binding region (5 Å < R < 30 Å, 15 Å < Z < 30 Å) | 0.0 ± 0.0 | 11.5 ± 0.5 | 30.4 ± 0.8 | 0.0 ± 0.0 | 11.7 ± 0.2 | 26.9 ± 0.7 |
| Constriction region (R < 15 Å, 15 Å < Z < 25 Å) | 0.0 ± 0.0 | 1.5 ± 0.2 | 1.3 ± 0.1 | 0.0 ± 0.0 | 0.8 ± 0.1 | 1.0 ± 0.1 |
| Cytoplasmic entrance (R < 20 Å, −30 Å < Z < −10Å) | 0.0 ± 0.0 | 11.7 ± 1.1 | 9.0 ± 0.6 | 0.2 ± 0.2 | 23.0 ± 0.3 | 8.2 ± 0.4 |
| Bulk (R < 40 Å, 35 Å < Z < 40 Å) | 0.0 ± 0.0 | 16.3 ± 0.2 | 16.7 ± 0.3 | 0.0 ± 0.0 | 13.7 ± 1.8 | 13.8 ± 1.8 |
All numbers are represented as averages ± SD (n = 3).
Spermine configurations in the CD
The actual binding configuration of SPM4+ relevant to rectification will depend on details of the protein that are likely missing from our structural models. However, these models allow us to isolate the effect of sequence variation alone by using a similar structural scaffold. Even with these crude models, we observe that SPM4+ interacts with weak and strong rectifier CDs in different ways that agree with experimental mutagenesis studies. We analyzed the structure of SPM4+ inside the CD by calculating the distribution of end-to-end distance between the first (N1) and last (N4) nitrogen atoms (Fig. 5). In simulations of SPM4+ in solution, the molecule adopts a compact configuration with most probable end-to-end distance ∼5 Å, far closer than the extended distance of 16 Å (34). We find that within the cytoplasmic pore, extended conformations are preferred, with end-to-end sampling from 11 to 16 Å and mean values of ∼15 Å in ROMK and ∼13 Å in IRK.
Figure 5.
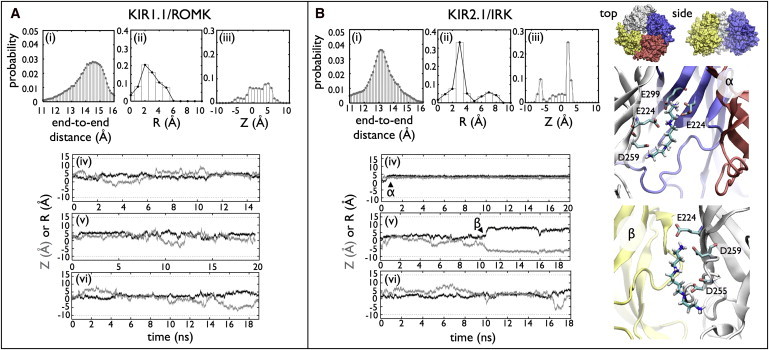
Spermine structure and position analysis. (A) Kir1.1/ROMK and (B) Kir2.1/IRK. Three probability distributions are shown: (i) the end-to-end distribution calculated between the first and last nitrogen atoms in the polyamine, (ii) the radial position of the center of mass, R, and (iii) the pore position of the spermine center of mass, Z. (iv–vi) The corresponding center of mass trajectories with R (black) and Z (gray). In the Kir2.1/IRK trajectories, two long-lived states of the spermine molecule are observed, denoted as α and β. Snapshots from the simulations corresponding to the α- and β-states are shown on the right. (Silver, blue, red, and yellow) The four subunits. (CPK coloring) The spermine molecule. The residues involved in coordinating the spermine, E224, E299, D255, and D259 are shown explicitly.
To identify possible long-lived states of SPM4+, we also analyzed the center of mass of the molecule throughout the simulation. The distributions of the radial position (R) and pore position (Z) show that the molecule is delocalized in ROMK. However, in IRK, there are three distinct peaks at R = 3 Å, and Z = −7 Å or 2 Å. The trajectories of the center of mass show that SPM4+ finds these long-lived states and remains there for the rest of the simulation. The structures of these two states are shown in Fig. 5 B. In the first state (α), SPM4+ interacts with two adjacent subunits of the pore, with N1 interacting with both E224 and E299 of one subunit, whereas the other three nitrogens interact with residues of E224 and D259 of the adjacent subunit. Although the center of mass is essentially fixed for the simulation, it actually reflects multiple conformational states. Whereas the top E224/E299 pair clamps on to one end of the SPM4+, the other E224 residue interacts with N2 or N3 by changing its rotameric state. In the second long-lived state observed in the trajectories (β), the SPM4+ interacts with a stable site near the cytoplasmic entrance. In this configuration, residues E224, D259, and D255, all within a single monomer, interact with the SPM4+. In the double SPM4+ simulations, the second sequestered SPM4+ interacts near a cluster of negative residues D249, D274, E275, and D276 but is also observed to wind around the cytoplasmic entrance of the protein.
Discussion
The role of weak and strong Kir CD domains—a cation attractor
Experiments have shown that the CDs of ROMK and IRK influence conductance and rectification behavior. This makes sense structurally, as the CD extends the permeation pathway and ions in this region could couple to permeant ions along the transmembrane pore. Mutagenesis studies have identified negative residues in IRK that are neutral in ROMK (e.g., E224 versus G223) that are important for strong rectification affinity. Although this hints that the CD of IRK is more electronegative and therefore a better domain for interacting with cations, this is not the case. The overall electrostatic potential has been calculated and is very similar inside these two pores (21), because IRK also contains positive residues (e.g., R229, R260) that compensate for the added negative charge. In line with the electrostatics, we observe that the CDs of ROMK and IRK accumulate K+ (8–10 ions) in similar amounts.
Thus, it appears that the CD collects cations irrespective of rectification strength. We can only speculate how this could relate to ion conduction as our simulations only report the equilibrium densities of ions and give no indication as to the kinetics of ion movement, but it is expected that the ability to concentrate permeant cations in the CD will facilitate the conductance of the channels in the outward direction (35,36). On the other hand, the accumulation of cytoplasmic blocking cations, including Mg2+ and polyamines such as SPM4+, will enable inward rectification in both strong and weak rectifiers. By reducing the local concentration of K+ in this part of the permeation pathway, the blockers will lower the availability of permeant cations for outward flow (37). Furthermore, the lowered K+ concentrations in the CD may enhance the ability of blockers to reach deeper sites in the transmembrane cavity by reducing competition for those sites from the permeant ions.
It is important to note that we carried out our simulations in ∼1 M KCl, approximately sevenfold higher than physiological K+. This is a common strategy in MD simulations, used to increase sampling to obtain equilibrium configurations that would otherwise be unfeasible (38). With this, the density plots are equivalent to relative energy maps of ion equilibrium with respect to bulk, applicable at any salt concentration. Although our numbers may reflect the saturated CD, the energetic drive for K+ to be concentrated inside the pore will still be pertinent at physiological concentrations.
Model dependency of simulations
Conformational changes of the cytoplasmic pore are expected to affect the ion distributions. As a first step to examine this issue, the crystal structure of the closed IRK CD (PDB:1U4F) bathed by a KCl salt solution was simulated (Fig. 3). The simulation showed accumulation of up to 5 K+ ions inside the center of the CD, with one hydrated K+ locked-in near the cytoplasmic entrance, meaning that it never left that position during the MD run. Electron density for this ion was also found when the domain was crystallized in the presence of KCl (PDB:2GIX). However, the fact that the ion does not leave this site during the simulation shows that sampling becomes a major issue when actual binding occurs. We can infer based on our closed and open simulations, that similar analysis of intermediately open Kir crystal structures (see Table S2) will show analogous results for K+ accumulation in the wider regions of the pore, with numbers somewhere between these two states (5–10 ions). As these structures are narrower than our open models by 3–5 Å, it is expected that ion localization sites would become apparent and coincide with electron densities for ions observed in the crystal structures. However, as in the closed-state structure, sampling issues would also become more apparent, limiting interpretation of the results.
Rectification blockers and the CDs
When interpreting the Mg2+ and SPM4+ results, it must be kept in mind that these are local free-energy wells that may not reflect true equilibrium of the system, and that the simulation length required for examining a block is not feasible with current computational resources. For example, experimental estimates place residence times for SPM4+ at its blocking site on the order of milliseconds at zero membrane potential (39). This is well beyond the timescale of our simulations (15–20 ns), in contrast to K+, which exits and enters many times. While in the pore, SPM4+ shows differences in structure and behavior inside the different CDs. Two long-lived states are observed in the IRK simulations showing SPM4+ interacting with residues E224, E299, and D259 (Fig. 5). Experiments have shown that these residues are the strongest cytoplasmic determinants of rectification affinity (14,40,41). In contrast, we do not observe any long-lived states in the weak-rectifier simulations. Even though ROMK is electronegative inside the CD, it is missing a key glutamate (E224) and does not contain any positive residues inside the pore that might participate in restricting the conformation of SPM4+. We also observe that the two CDs differ in their ability to sequester SPM4+ near the entrance of the CD. In IRK, a second SPM4+ near the cytoplasmic entrance remains for at least 10 ns, interacting with a cluster of negatively charged residues. This is very different from the weak rectifier, where the second SPM4+ exits to the bulk solution after several nanoseconds of simulation. In IRK, this part of the structure contains at least two more negative charges (D249 and D276) that are not present in ROMK. These mutations have not been studied experimentally, but another residue that is in a similar structural position facing the cytoplasmic bulk, D255, has been examined and has a specific effect on the kinetics of SPM4+ blockade (42). A predocking region in the strong rectifiers that increases the local concentration of rectification blockers has been proposed (43,44). Our simulations show that this part of the pore is a good candidate for such a site, and that it is only present in the strong-rectifier domain.
The Kir CD provides a unique structural motif for ion channels, creating a large, strongly charged vestibule for collecting ions en route to the transmembrane pore. Our simulations show that these are multi-ion domains, capable of concentrating K+ ions while simultaneously interacting with blockers. The strong- and weak-rectifier CDs differ in SPM4+ interactions in two ways, with IRK selectively: 1), influencing SPM4+ conformations inside the pore, and 2), collecting additional SPM4+ at the cytoplasmic entrance. In our simulations, these differences come about from sequence variation alone as we examine them on the same structural scaffold. Although this work presents a first step toward a multi-ion picture that is required to understand conductance and rectification, it does not yet give us answers to these big questions. For this, much more work is needed to determine high-resolution structures of rectification block and to couple this information with nonequilibrium simulations of ion permeation such as grand canonical Monte Carlo Brownian dynamics (45).
Acknowledgments
We thank Dr. Declan Doyle for sharing the KirBac1.1 open model coordinates and Dr. Sergei Y. Noskov for providing the spermine parameters.
J.L.R. was supported by the National Science and Engineering Research Council postgraduate doctoral scholarship from Canada. This work was supported by National Institutes of Health grants GM062342 (to B.R.) and DK27847 (to L.G.P.). Computational resources were provided by the National Center for Supercomputing Applications through grant MCA01S018.
Footnotes
J. L. Robertson's current address is Department of Biochemistry, Howard Hughes Medical Institute, Brandeis University, Waltham, MA.
Supporting Material
References
- 1.Matsuda H., Saigusa A., Irisawa H. Ohmic conductance through the inwardly rectifying K channel and blocking by internal Mg2+ Nature. 1987;325:156–159. doi: 10.1038/325156a0. [DOI] [PubMed] [Google Scholar]
- 2.Vandenberg C.A. Inward rectification of a potassium channel in cardiac ventricular cells depends on internal magnesium ions. Proc. Natl. Acad. Sci. USA. 1987;84:2560–2564. doi: 10.1073/pnas.84.8.2560. [DOI] [PMC free article] [PubMed] [Google Scholar]
- 3.Lopatin A.N., Makhina E.N., Nichols C.G. Potassium channel block by cytoplasmic polyamines as the mechanism of intrinsic rectification. Nature. 1994;372:366–369. doi: 10.1038/372366a0. [DOI] [PubMed] [Google Scholar]
- 4.Ficker E., Taglialatela M., Brown A.M. Spermine and spermidine as gating molecules for inward rectifier K+ channels. Science. 1994;266:1068–1072. doi: 10.1126/science.7973666. [DOI] [PubMed] [Google Scholar]
- 5.Kuo A., Gulbis J.M., Doyle D.A. Crystal structure of the potassium channel KirBac1.1 in the closed state. Science. 2003;300:1922–1926. doi: 10.1126/science.1085028. [DOI] [PubMed] [Google Scholar]
- 6.Nishida M., Cadene M., MacKinnon R. Crystal structure of a Kir3.1-prokaryotic Kir channel chimera. EMBO J. 2007;26:4005–4015. doi: 10.1038/sj.emboj.7601828. [DOI] [PMC free article] [PubMed] [Google Scholar]
- 7.Tao X., Avalos J.L., MacKinnon R. Crystal structure of the eukaryotic strong inward-rectifier K+ channel Kir2.2 at 3.1 Å resolution. Science. 2009;326:1668–1674. doi: 10.1126/science.1180310. [DOI] [PMC free article] [PubMed] [Google Scholar]
- 8.Clarke O.B., Caputo A.T., Gulbis J.M. Domain reorientation and rotation of an intracellular assembly regulate conduction in Kir potassium channels. Cell. 2010;141:1018–1029. doi: 10.1016/j.cell.2010.05.003. [DOI] [PubMed] [Google Scholar]
- 9.Doyle D.A., Morais Cabral J., MacKinnon R. The structure of the potassium channel: molecular basis of K+ conduction and selectivity. Science. 1998;280:69–77. doi: 10.1126/science.280.5360.69. [DOI] [PubMed] [Google Scholar]
- 10.Zhou Y., Morais-Cabral J.H., MacKinnon R. Chemistry of ion coordination and hydration revealed by a K+ channel-Fab complex at 2.0 Å resolution. Nature. 2001;414:43–48. doi: 10.1038/35102009. [DOI] [PubMed] [Google Scholar]
- 11.Lu Z., MacKinnon R. Electrostatic tuning of Mg2+ affinity in an inward-rectifier K+ channel. Nature. 1994;371:243–246. doi: 10.1038/371243a0. [DOI] [PubMed] [Google Scholar]
- 12.Wible B.A., Taglialatela M., Brown A.M. Gating of inwardly rectifying K+ channels localized to a single negatively charged residue. Nature. 1994;371:246–249. doi: 10.1038/371246a0. [DOI] [PubMed] [Google Scholar]
- 13.Taglialatela M., Wible B.A., Brown A.M. Specification of pore properties by the carboxyl terminus of inwardly rectifying K+ channels. Science. 1994;264:844–847. doi: 10.1126/science.8171340. [DOI] [PubMed] [Google Scholar]
- 14.Yang J., Jan Y.N., Jan L.Y. Control of rectification and permeation by residues in two distinct domains in an inward rectifier K+ channel. Neuron. 1995;14:1047–1054. doi: 10.1016/0896-6273(95)90343-7. [DOI] [PubMed] [Google Scholar]
- 15.Roux B., Bernèche S., Im W. Ion channels, permeation, and electrostatics: insight into the function of KcsA. Biochemistry. 2000;39:13295–13306. doi: 10.1021/bi001567v. [DOI] [PubMed] [Google Scholar]
- 16.Shin H.G., Xu Y., Lu Z. Evidence for sequential ion-binding loci along the inner pore of the IRK1 inward-rectifier K+ channel. J. Gen. Physiol. 2005;126:123–135. doi: 10.1085/jgp.200509296. [DOI] [PMC free article] [PubMed] [Google Scholar]
- 17.Whorton M.R., MacKinnon R. Crystal structure of the mammalian GIRK2 K+ channel and gating regulation by G proteins, PIP2, and sodium. Cell. 2011;147:199–208. doi: 10.1016/j.cell.2011.07.046. [DOI] [PMC free article] [PubMed] [Google Scholar]
- 18.Pegan S., Arrabit C., Choe S. Andersen's syndrome mutation effects on the structure and assembly of the cytoplasmic domains of Kir2.1. Biochemistry. 2006;45:8599–8606. doi: 10.1021/bi060653d. [DOI] [PubMed] [Google Scholar]
- 19.Xu Y., Shin H.G., Lu Z. Physical determinants of strong voltage sensitivity of K+ channel block. Nat. Struct. Mol. Biol. 2009;16:1252–1258. doi: 10.1038/nsmb.1717. [DOI] [PMC free article] [PubMed] [Google Scholar]
- 20.Hansen S.B., Tao X., MacKinnon R. Structural basis of PIP2 activation of the classical inward rectifier K+ channel Kir2.2. Nature. 2011;477:495–498. doi: 10.1038/nature10370. [DOI] [PMC free article] [PubMed] [Google Scholar]
- 21.Robertson J.L., Palmer L.G., Roux B. Long-pore electrostatics in inward-rectifier potassium channels. J. Gen. Physiol. 2008;132:613–632. doi: 10.1085/jgp.200810068. [DOI] [PMC free article] [PubMed] [Google Scholar]
- 22.Domene C., Doyle D.A., Vénien-Bryan C. Modeling of an ion channel in its open conformation. Biophys. J. 2005;89:L01–L03. doi: 10.1529/biophysj.105.060855. [DOI] [PMC free article] [PubMed] [Google Scholar]
- 23.Kuo A., Domene C., Vénien-Bryan C. Two different conformational states of the KirBac3.1 potassium channel revealed by electron crystallography. Structure. 2005;13:1463–1472. doi: 10.1016/j.str.2005.07.011. [DOI] [PubMed] [Google Scholar]
- 24.Pegan S., Arrabit C., Choe S. Cytoplasmic domain structures of Kir2.1 and Kir3.1 show sites for modulating gating and rectification. Nat. Neurosci. 2005;8:279–287. doi: 10.1038/nn1411. [DOI] [PubMed] [Google Scholar]
- 25.Feig M., Karanicolas J., Brooks C.L., 3rd MMTSB Tool Set: enhanced sampling and multiscale modeling methods for applications in structural biology. J. Mol. Graph. Model. 2004;22:377–395. doi: 10.1016/j.jmgm.2003.12.005. [DOI] [PubMed] [Google Scholar]
- 26.Brooks B.R., Brooks C.L., 3rd, Karplus M. CHARMM: the biomolecular simulation program. J. Comput. Chem. 2009;30:1545–1614. doi: 10.1002/jcc.21287. [DOI] [PMC free article] [PubMed] [Google Scholar]
- 27.Phillips J.C., Braun R., Schulten K. Scalable molecular dynamics with NAMD. J. Comput. Chem. 2005;26:1781–1802. doi: 10.1002/jcc.20289. [DOI] [PMC free article] [PubMed] [Google Scholar]
- 28.MacKerell A.D., Jr., Brooks B., Karplus M. CHARMM: the energy function and its parameterization with and overview of the program. In: Schleyer P.v.R., Allinger N.L., Clark T., Gasteiger J., Kollman P.A., Schaefer H.F., III, Schreiner P.R., editors. The Encyclopedia of Computational Chemistry. John Wiley & Sons; Chichester, UK: 1998. pp. 271–277. [Google Scholar]
- 29.Jorgensen W.L., Chandrasekhar J., Klein M.L. Comparison of simple potential functions for simulating liquid water. J. Chem. Phys. 1983;79:926–935. [Google Scholar]
- 30.Beglov D., Roux B. Finite representation of an infinite bulk system—solvent boundary potential for computer simulations. J. Chem. Phys. 1994;100:9050–9063. [Google Scholar]
- 31.Humphrey W., Dalke A., Schulten K. VMD: visual molecular dynamics. J. Mol. Graph. 1996;14:27–33. doi: 10.1016/0263-7855(96)00018-5. [DOI] [PubMed] [Google Scholar]
- 32.Hilgemann D.W., Feng S., Nasuhoglu C. The complex and intriguing lives of PIP2 with ion channels and transporters. Sci. STKE. 2001;2001:re19. doi: 10.1126/stke.2001.111.re19. [DOI] [PubMed] [Google Scholar]
- 33.Hille B. Sinauer Associates; Sunderland, MA: 2001. Ion Channels of Excitable Membranes. [Google Scholar]
- 34.Shamma T., Haworth I.S. Spermine inhibition of the 2,5-diaziridinyl-1,4-benzoquinone (DZQ) crosslinking reaction with DNA duplexes containing poly(purine). poly(pyrimidine) tracts. Nucleic Acids Res. 1999;27:2601–2609. doi: 10.1093/nar/27.13.2601. [DOI] [PMC free article] [PubMed] [Google Scholar]
- 35.Zhang Y.Y., Robertson J.L., Palmer L.G. Carboxy-terminal determinants of conductance in inward-rectifier K channels. J. Gen. Physiol. 2004;124:729–739. doi: 10.1085/jgp.200409166. [DOI] [PMC free article] [PubMed] [Google Scholar]
- 36.Fujiwara Y., Kubo Y. Functional roles of charged amino acid residues on the wall of the cytoplasmic pore of Kir2.1. J. Gen. Physiol. 2006;127:401–419. doi: 10.1085/jgp.200509434. [DOI] [PMC free article] [PubMed] [Google Scholar]
- 37.Xie L.H., John S.A., Weiss J.N. Spermine block of the strong inward rectifier potassium channel Kir2.1: dual roles of surface charge screening and pore block. J. Gen. Physiol. 2002;120:53–66. doi: 10.1085/jgp.20028576. [DOI] [PMC free article] [PubMed] [Google Scholar]
- 38.Im W., Roux B. Ions and counterions in a biological channel: a molecular dynamics simulation of OmpF porin from Escherichia coli in an explicit membrane with 1 M KCl aqueous salt solution. J. Mol. Biol. 2002;319:1177–1197. doi: 10.1016/S0022-2836(02)00380-7. [DOI] [PubMed] [Google Scholar]
- 39.Shin H.G., Lu Z. Mechanism of the voltage sensitivity of IRK1 inward-rectifier K+ channel block by the polyamine spermine. J. Gen. Physiol. 2005;125:413–426. doi: 10.1085/jgp.200409242. [DOI] [PMC free article] [PubMed] [Google Scholar]
- 40.Taglialatela M., Ficker E., Brown A.M. C-terminus determinants for Mg2+ and polyamine block of the inward rectifier K+ channel IRK1. EMBO J. 1995;14:5532–5541. doi: 10.1002/j.1460-2075.1995.tb00240.x. [DOI] [PMC free article] [PubMed] [Google Scholar]
- 41.Kubo Y., Murata Y. Control of rectification and permeation by two distinct sites after the second transmembrane region in Kir2.1 K+ channel. J. Physiol. 2001;531:645–660. doi: 10.1111/j.1469-7793.2001.0645h.x. [DOI] [PMC free article] [PubMed] [Google Scholar]
- 42.Kurata H.T., Cheng W.W., Nichols C.G. The role of the cytoplasmic pore in inward rectification of Kir2.1 channels. J. Gen. Physiol. 2007;130:145–155. doi: 10.1085/jgp.200709742. [DOI] [PMC free article] [PubMed] [Google Scholar]
- 43.Xie L.H., John S.A., Weiss J.N. Inward rectification by polyamines in mouse Kir2.1 channels: synergy between blocking components. J. Physiol. 2003;550:67–82. doi: 10.1113/jphysiol.2003.043117. [DOI] [PMC free article] [PubMed] [Google Scholar]
- 44.Kurata H.T., Phillips L.R., Baukrowitz T. Molecular basis of inward rectification: polyamine interaction sites located by combined channel and ligand mutagenesis. J. Gen. Physiol. 2004;124:541–554. doi: 10.1085/jgp.200409159. [DOI] [PMC free article] [PubMed] [Google Scholar]
- 45.Im W., Seefeld S., Roux B. A grand canonical Monte Carlo-Brownian dynamics algorithm for simulating ion channels. Biophys. J. 2000;79:788–801. doi: 10.1016/S0006-3495(00)76336-3. [DOI] [PMC free article] [PubMed] [Google Scholar]
Associated Data
This section collects any data citations, data availability statements, or supplementary materials included in this article.