Abstract
Linker histone H1 binds to the nucleosome core particle and linker DNA, facilitating folding of chromatin into higher order structure. H1 is essential for mammalian development1 and regulates specific gene expression in vivo2-4. Among the highly conserved histone proteins, the family of H1 linker histones is the most heterogeneous group. There are 11 H1 subtypes in mammals that are differentially regulated during development and in different cell types. These H1 subtypes include 5 somatic H1s (H1a-e), the replacement H10, 4 germ cell specific H1 subtypes, and H1x5. The presence of multiple H1 subtypes that differ in DNA binding affinity and chromatin compaction ability6-9 provides an additional level of modulation of chromatin function. Thus, quantitative expression analysis of individual H1 subtypes, both of mRNA and proteins, is necessary for better understanding of the regulation of higher order chromatin structure and function.
Here we describe a set of assays designed for analyzing the expression levels of individual H1 subtypes (Figure 1). mRNA expression of various H1 variant genes is measured by a set of highly sensitive and quantitative reverse transcription-PCR (qRT-PCR) assays, which are faster, more accurate and require much less samples compared with the alternative approach of Northern blot analysis. Unlike most other cellular mRNA messages, mRNAs for most histone genes, including the majority of H1 genes, lack a long polyA tail, but contain a stem-loop structure at the 3' untranslated region (UTR)10. Therefore, cDNAs are prepared from total RNA by reverse transcription using random primers instead of oligo-dT primers. Realtime PCR assays with primers specific to each H1 subtypes (Table 1) are performed to obtain highly quantitative measurement of mRNA levels of individual H1 subtypes. Expression of housekeeping genes are analyzed as controls for normalization.
The relative abundance of proteins of each H1 subtype and core histones is obtained through reverse phase high-performance liquid chromatography (RP-HPLC) analysis of total histones extracted from mammalian cells11-13. The HPLC method and elution conditions described here give optimum separations of mouse H1 subtypes. By quantifying the HPLC profile, we calculate the relative proportion of individual H1 subtypes within H1 family, as well as determine the H1 to nucleosome ratio in the cells.
Keywords: Genetics, Issue 61, H1 linker histones, histone H1 subtypes, chromatin, RT-PCR, HPLC, gene expression
Protocol
1. Sample Preparation and RNA Extraction
Before RNA extraction, all working surfaces and pipettes should be wiped with 70% ethanol and treated with RNase decontamination solution, such as RNase Zap. This practice reduces the chances of RNase contamination and RNA degradation. Wear gloves for all procedures.
To extract RNA from mouse tissue, dissect the organ of interest from euthanized mouse, and wash the tissue in ice cold Phosphate Buffered Saline (PBS: 0.13 M NaCl, 5 mM Sodium phosphate dibasic heptahydrate, 5 mM Sodium dihydrogen phosphate heptahydrate, pH 7.4). Proceed immediately to RNA extraction in step 1.4. If fresh tissue is not to be processed for RNA extraction, the tissue samples should be snap frozen in liquid nitrogen immediately and be stored at -80 °C for later use.
If RNA is to be extracted from adherent cell culture, aspirate culture media, rinse with sufficient amount of PBS, and add Trizol Reagent (Invitrogen) onto the plate and proceed to step 1.4. For cells grown in suspension, harvest the cells and pellet cells by centrifugation. Discard media, rinse the pellets briefly with PBS, and pellet the cells with centrifugation. Add Trizol Reagent and proceed to step 1.4.
Sufficient Trizol Reagent is necessary for obtaining high quality RNA. Use 1 ml Trizol Reagent to extract RNA from 50 - 100 mg tissue, 5 - 10 x 106 cells (for suspension cultures) or per 3.5 cm plate (for adherent cultures). Homogenize the tissue in Trizol Reagent with Polytron PT2100 homogenizer (or equivalent). Proceed to extract RNA from tissue samples or cells according to the manufacturer's manual for Trizol Reagent (Invitrogen).
RNA concentration is measured using Nanodrop 1000 (Thermo Scientific) and RNA quality is analyzed by gel electrophoresis. The typical yield ranges from 1-10 μg of RNA per mg of tissue or 5-15 μg of RNA per 1 x 10⁶ cultured cells. To eliminate the potential contamination of RNA from trace amount of genomic DNA, RNA samples are treated with RNase-free DNase (Sigma AMP-D1) according to the manufacturer's instruction. Repeat RNA concentration determination and gel electrophoresis to ensure no degradation of RNA from this treatment. Store extracted RNA at -80 °C.
*Note: RNA may also be extracted using RNAeasy kit (Qiagen) according to the kit manual, or by DNA/RNA kit (Qiagen) if both DNA and RNA are desired.
2. Quantitative Reverse Transcription PCR (qRT-PCR)
Total RNA is reverse transcribed into cDNA using Superscript III First-strand Synthesis System (Invitrogen). Since mRNA of most H1 genes lack poly-A-tails, it is critical to use random hexamers instead of oligo-dT as primers for cDNA synthesis. However, if expression analysis of genes with polyadenylated messages at low levels is also desired, a mixture of random hexamers and oligo-dT should be used in the reverse transcription (RT) reaction to improve the reverse transcription efficiency of polyadenylated mRNAs.
- Perform the RT reaction according to the manufacturer's manual. Briefly,
- In a 0.5 ml PCR tube, combine 5 μg of total RNA, 1 μl of 50 ng/μl random hexamers, 1 μl of 10 mM dNTP mix, and add DEPC-treated H2O to make the total reaction volume as 10 μl. Mix well and incubate for 5 minutes at 65 °C, followed by 1 minute incubation on ice.
- Prepare 10 μl of cDNA Synthesis Mix: 2 μl of 10xRT buffer, 4 μl of 25 mM MgCl2, 2 μl of 0.1M DTT, 1 μl of RNaseOut (40 U/μl), 1 μl of SuperScript III RT (200 U/μl) and add it to RNA/primer mixture.
- Incubate for 10 minutes at 25 °C, followed by 50 minutes at 50 °C and terminate the reaction at 85 °C for 5 minutes.
- Each reaction typically yields 100-250 ng/μl of cDNA product. Store cDNA products at -20 °C or proceed immediately for real-time quantitative PCR (qPCR).
qPCR can accurately quantify the target sequence copies with high efficiency and reproducibility14. We choose qPCR measured by SYBR Green dye, which gives a fluorescent signal only when it intercalates with double-stranded DNA (dsDNA). Although not as specific as Taqman assay14, this method is more cost effective, easier to be adopted in the laboratory, and gives more versatility to qPCR. Therefore, it is important to examine the amplification plot (Figure 2A) and the derivative melting curves of the qPCR product (Figure 2B) to ensure reaction efficiency and specificity.
| Histone subtypes | Mouse histone nomenclature | Human histone nomenclature | ||
| Gene name | Accession no. | Gene name | Accession no. | |
| Histone H1a | Hist1h1a | NM_030609 | HIST1H1A (H1.1) | NM_005325 |
| Histone H1b | Hist1h1b | NM_020034 | HIST1H1B (H1.5) | NM_005322 |
| Histone H1c | Hist1h1c | NM_015786 | HIST1H1C (H1.2) | NM_005319 |
| Histone H1d | Hist1h1d | NM_145713 | HIST1H1D (H1.3) | NM_005320 |
| Histone H1e | Hist1h1e | NM_015787 | HIST1H1E (H1.4) | NM_005321 |
| Histone H1° | H1f0 | NM_008197 | H1F0 | NM_005318 |
| Histone H1oo | H1foo | NM_183811 | H1FOO | NM_153833 |
| Histone H1t | Hist1h1t | NM_010377 | HIST1H1T | NM_005323 |
| Histone H1t2 | H1fnt | NM_027304 | H1FNT | NM_181788 |
| Histone H1x | H1fx | NM_198622 | H1FX | NM_006026 |
| Histone Hils1 | Hils1 | NM_081792 | HILS1 | AY286318 |
Table 1. Histone H1 subtype nomenclature in mouse and human.
Design forward and reverse PCR primers specific for each H1 gene (Table 1). Due to the high sequence similarity among somatic H1s, particularly in the region corresponding to the central globular domain, it is critical to ensure that the primers designed for a specific H1 subtype do not align with other H1 genes, or cross amplify other H1 subtypes. It is also important to note that most H1 genes do not contain introns. Thus intron-spanning primers typically adopted for RT-PCR to avoid genomic contamination are not available. Instead, RNA samples should be pre-treated with DNase (see 1.5) to eliminate any trace amount of genomic contamination. In addition, RT(-)-qPCR should be performed in parallel to validate the lack of genomic contamination in the cDNA samples.
Also design primers for internal reference genes, whose expression are not changed among samples. Often housekeeping genes, such as glyceraldehyde-3-phosphate dehydrogenase (GAPDH) and beta-actin genes, are chosen as reference genes. qPCR signals of housekeeping genes serve as normalization controls.
Prepare each PCR reaction (total volume 25 μl) as following: 12.5 μl of 2x IQ SYBR Green Supermix (Bio-Rad) (containing dNTPs, 50 U/ml iTaq DNA polymerase, 6 mM MgCl2, SYBR Green I and 20 nM fluorescein), 2 μl of 4 ng/μl cDNA, 1.25 μl of 10 nM forward/reverse primer mix, and 9.25 μl of ddH2O, and mix well in Microseal 96-well PCR plate. Use Microseal 'B' Adhesive Seals (Bio-rad) to ensure that the plate cover is sealed to the plate. Tap or briefly vortex the PCR plate, and spin down the reaction mixtures by a short centrifugation. Place the plate in MyIQ Single Color real-time PCR Detection System (Bio-rad) for qPCR.
We use the following qPCR conditions: 95 °C for 3 minutes, followed by 40 cycles of 95 °C for 10 seconds, 60 °C for 20 seconds, 72 °C for 30 seconds. Examine the amplification curves (Figure 2A) for PCR efficiency and Ct (Threshold of cycle) values. The threshold line can be automatically set by the IQ5 Optical System Software Version 2.0.
The primer efficiency and optimal cDNA concentration needed can be tested by a standard curve assay, in which a serial dilution of genomic DNA is used for qPCR and Ct values are plotted against log of template DNA amount. An optimized qPCR assay with primers of high specificity and efficiency will give a linear standard curve, with the coefficient of determination (R2)>0.98. Avoid primers with amplicon length longer than 200 bp, which tend to have poor amplification efficiency.
Because SYBR Green detects any dsDNA, it is critical to perform a melting curve run following the qPCR to ensure that the desired amplicon, but not primer dimers or contaminants, are amplified and detected. For melt-curve analysis, program the qPCR instrument to heat the samples from 55 °C to 95 °C in 0.5 °C increments with data collection. The default setting of melt-curve analysis for MyIQ (Bio-rad) instrument is the following: 95 °C for 1 minute, 55 °C for 1 minute, followed by 81 cycles of 10 seconds at setpoint 55 °C, melt curve, + temp 0.5 °C (camera collects data at each cycle).
Since melting temperature (Tm) of dsDNA is dependent on amplicon length and GC content, different amplicons will have different Tm(s). Examine the derivative melting curves of the qPCR products to confirm the specific melting temperature of desired amplicons as well as the lack of noise amplicon peaks (Figure 2B).
Prepare duplicate or triplicate reactions for each assay for statistical analysis. Include negative controls for qRT-PCR, such as RT(-)-qPCR (qPCR with RNA as template without reverse transcription) and qPCR with no cDNA, RNA or DNA source added in the PCR mix. RT(-)-qPCR can serve as control for potential genomic DNA contamination (RT(-) in Figure 2 & 3).
Analyze qPCR data with IQ5 Optical System Software Version 2.0 (Bio-rad). Normalize the expression values of H1 isoform genes with the expression of housekeeping gene (e.g. GAPDH, ß-actin, HPRT) to obtain relative expression levels of H1 genes.
3. Preparation of Total Histones
* All procedures should be performed on ice or at 4 °C.
Dissect mouse tissue and rinse it with ice cold PBS. (If not proceed to extraction immediately, snap freeze and store the samples as described in step 1.2.) Mince the tissue into pieces with razor blade. Transfer mince to a Dounce homogenizer (B pestle). Add 10 ml Sucrose Buffer (0.3 M Sucrose, 15 mM NaCl, 10 mM HEPES [pH 7.9], 2 mM EDTA, 0.5 mM PMSF, Complete Mini Protease Inhibitor Cocktail Tablet, add fresh) per gram of tissue. Homogenize the tissue with 10-15 strokes.
Transfer the homogenates to a 15 ml tube, spin at 500 rpm for 30 seconds (centrifuge model: Eppendorf 5810R); carefully transfer the supernatant to a new tube (discard the pellet-tissue debris), and centrifuge at 2000 rpm for 5 minutes, to pellet cells. Proceed to step 3.4.
If histones and chromatin are to be extracted from cells grown in monolayer, rinse with PBS, add PBS to the culture dish, and harvest the cells using cell scraper, and pellet cells by centrifugation. For cells grown in suspension, pellet cells by centrifugation.
Resuspend the cell pellet in 10 ml Sucrose Buffer supplemented with 0.5% NP-40 (per gram starting tissue amount or 10(8) cells). Transfer the sample to a Dounce homogenizer (B pestle) and dounce 10 strokes within 20 minutes incubation. At this point, nuclei are obtained. Examine the nuclei quality under a microscope. Pellet the nuclei by centrifugation at 2000 rpm for 5 minutes. Discard the supernatant.
Resuspend the nuclei pellet in 3 ml High Salt Buffer (0.35 M KCl, 10 mM Tris [pH 7.2], 5 mM MgCl2, 0.5 mM PMSF - add fresh before each use) per 1 g of tissue or 10(8) cells. Transfer the sample to a small Dounce homogenizer (B pestle) and homogenize with 5-10 strokes.
Aliquot the suspension into 3 Eppendorf tubes (1 ml each), incubate on ice for 20 minutes, followed by centrifugation at 14,000 rpm for 10 minutes to pellet chromatin. Discard the supernatant.
Add 0.8 ml 0.2 N H2SO4 to each chromatin pellet. Use an eppendorf tube pestle dounce to grind the pellet well until the pellet is completely dissociated. Incubate the samples on a rotating platform at 4 °C overnight. Total histones are extracted with this step of acid treatment.
Centrifuge at 14,000 rpm for 10 minutes. Transfer the supernatant (histone extracts) into two Eppendorf tubes (400 μl/tube). Discard the pellet. Add 2.5 volumes (1 ml) of ice cold ethanol to each tube.. Keep the samples at -20 °C overnight.
Centrifuge at 14,000 rpm for 10 minutes to pellet total histones, discard the supernatant. Wash the pellet three times with 70% EtOH, leave on bench for 20-30 minutes to air dry. Store the dried proteins at -80 °C or dissolve them in ddH2O and proceed to HPLC analysis immediately. Dried proteins can be stored at -80 °C for up to 1 year.
4. HPLC Analysis of Linker Histones
Resuspend the histone pellet in the recommended volume of ddH2O depending on the capacity of reverse-phase column and the HPLC instrument. We use C18 reverse phase column 250 x 4.6 mm (Vydac) and Äktapurifier UPC 900 instrument (GE healthcare) for HPLC analysis. We typically dissolve 50-100μg of total histones in 100 μl of ddH20 for analysis.
Centrifuge at 14,000 rpm for 5 minutes to remove insoluble residues. Bradford protein assay is used to determine the amount of protein to be injected onto the column. Inject 50-100 μg of total protein into the reverse phase column on HPLC system. Loading an excess amount of protein should be avoided to prevent clogging of the column.
Fractionate the linker histones and core histones with an increasing acetonitrile gradient as listed in Table 2.
| Time (Min.) | Acetonitrile/0.1% TFA (%) | 0.1% TFA/ddH2O (%) |
| 0 | 0 | 100 |
| 1 | 5 | 95 |
| 11 | 25 | 75 |
| 26 | 30 | 70 |
| 45 | 35 | 65 |
| 66 | 40 | 60 |
| 75 | 43 | 57 |
| 126 | 55 | 45 |
| 131 | 90 | 10 |
| 136 | 5 | 95 |
Table 2. Increasing acetonitrile gradient over time.
The effluent is monitored at 214 nm, and the HPLC profiles (Figure 4) are recorded and analyzed using Äktapurifier UPC 900 (GE Healthcare) with UNICORN 5.11 software (GE Healthcare). The protein fractions can be also collected with fraction auto-collector (Frac-920 - GE) for further analysis, e.g. SDS-PAGE and mass spectrometry.
The A214 values of the peaks of each H1 subtype and H2B are normalized by the number of peptide bonds of each corresponding histone protein. The relative proportion of individual H1 histone subtypes within the H1 family, as well as the ratio of H1 subtypes to nucleosome core particles can be calculated from these normalized A214 values (Figure 5).
5. Representative Results
The list of mammalian H1 subtypes, overall flowchart and representative results of the expression analysis of individual histone H1 genes are shown in Table 1, Figure 1 and Figure 2-5, respectively. Figure 2A shows typical amplification curves of H1a qPCR reactions using cDNA prepared from mouse liver and mESCs, whereas Figure 2B shows the derivative melting curves of the corresponding amplicons. The melting curve displays a single characteristic peak at melting temperature (Tm) at 86 °C for the H1a PCR amplicon, and lacks non-specific background peaks, suggesting high specificity of H1a qPCR assay. Evaluation of the amplification plot (Figure 2A) shows that the triplicate qPCR reactions of each sample gave consistent signals with almost identical Ct values, suggesting high reproducibility. The lack of amplicons build-up from RT(-)-qPCR reactions indicates that genomic DNA contamination was not present, or minimal. Utilizing the Ct values of H1 genes and housekeeping genes, such as GAPDH, the relative RNA expression levels of each H1 gene were calculated. Examples of calculated results for H1° and H1a genes are shown in Figure 3. The relative expression levels of H1a mRNA are higher in mESCs compared with mouse liver, whereas H1° expression is much higher in liver than in mESCs.
The difference in expression of H1a or H1° in mESC versus adult mouse liver is also evident from HPLC profiles of histone proteins (Figure 4). H1°, the differentiation specific H1, is accumulated to a large amount in mature tissues, accounting for 27.2% of total H1 in adult liver (Figure 5A). In contrast, H1° protein is nearly absent in undifferentiated mESCs (Figure 4B). On the other hand, H1a is highly expressed, both in mRNA transcripts and proteins, in mESCs (Figure 3 & 4B). Through quantification of H1 peaks in HPLC profile, the relative proportion of each individual H1 subtype within the H1 family is determined (Figure 5A). Furthermore, the values of individual H1 subtype (or total H1) per nucleosome can be calculated by the ratio of the normalized A214 peak value of corresponding H1 subtypes (or sum of total H1) to one-half of the normalized A214 values for H2B (Figure 5B).
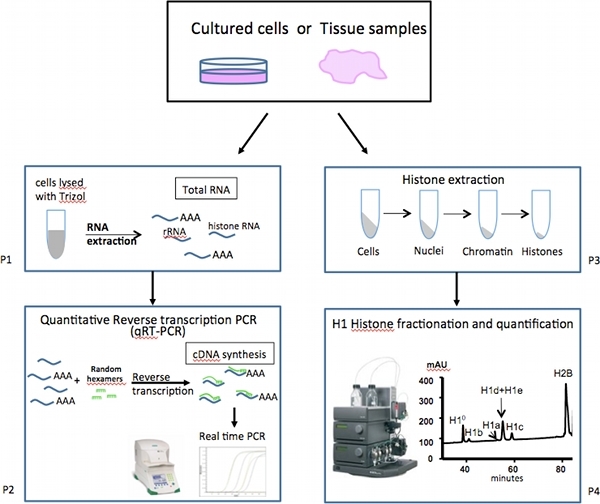 Figure 1. Overall scheme of expression analysis of mammalian linker-histone subtypes.
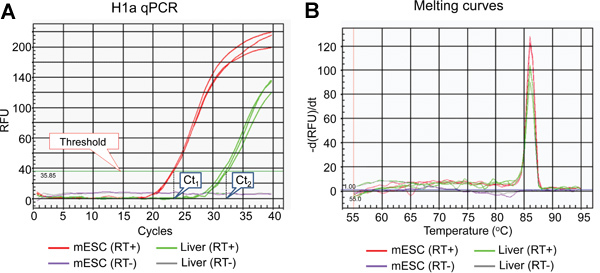 Figure 2. Representative results of H1a qPCR assay. (A) Amplification plot of H1a qPCR assay. The threshold line and Ct values set by the IQ5 Optical System Software are indicated. (B) Derivative melt-curves of qPCR products shown in (A).
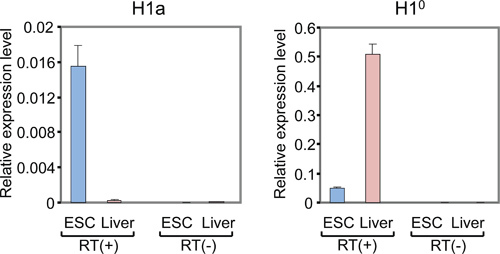 Figure 3. qRT-PCR analysis of mRNA levels of H1a and H1° in mESCs and adult mouse liver. Y axis represents relative expression levels of H1 genes to that of the reference gene GAPDH. qPCR with RT(-) samples (RNA without reverse transcription) shows minimal or no signals.
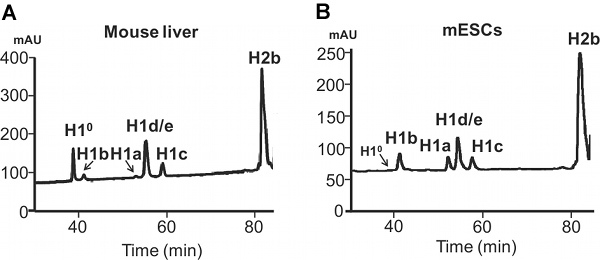 Figure 4. HPLC analysis of histones extracted from mammalian cells. Reverse-phase HPLC analysis of 100 μg total histones extracted from adult mouse liver (A) and mouse ESCs (B). X axis: elution time. Y axis: mAU, milli-absorbency units.
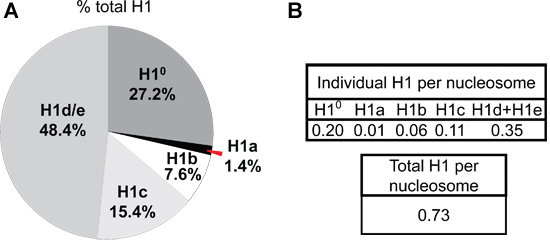 Figure 5. H1 subtype composition and H1 per nucleosome ratios in adult mouse liver. The A214 values of the peak area for each H1 isoform and H2B are calculated using UNICORN 5.11 software (GE Healthcare), and normalized by the number of peptide bonds present in the corresponding histone protein. The sum of normalized A214 values of all H1 subtypes is obtained as the value for total H1. The percentage of total H1 for each H1 subtype (A) as well as the ratio of H1 to nucleosome (represented by one-half of the normalized A214 values of H2B) (B) in adult mouse liver are calculated from the HPLC profile shown in Figure 4A.
Discussion
The set of assays presented here enable comprehensive analysis of the expression levels of mammalian linker histone subtypes. Properly designed qRT-PCR assays provide highly sensitive and accurate measurements of RNA messages from any mammalian histone H1 genes. The critical part of qRT-PCR assays for linker histone subtype genes is the preparation of cDNA using random primer based reverse transcription. mRNA of most histone genes, including most H1 genes, do not contain a long poly-A tail presented in other cellular mRNAs. Thus the traditional reverse transcription method with oligo-dT primers will not efficiently produce H1 cDNAs. Expression analysis of the few H1 genes with mRNA transcripts containing poly-A tails, such as H10, is equally effective with random hexamers based qRT-PCR (Figure 3), probably due to the high abundance of H1 RNAs. Nevertheless, a mixture of oligo-dT primers and the random hexamers for RT reaction can be adopted to improve RT efficiency of polyadenylated mRNAs that are of low copy numbers, allowing broader coverage of genes analyzed by qRT-PCR. qRT-PCR of internal reference genes, such as housekeeping gene GAPDH, is included so that the relative expression level of specific H1 genes across different tissues or cell types can be compared (Figure 3). By combining qRT-PCR with standard curve analysis, it is also possible to obtain absolute copy numbers of H1 cDNAs from various samples (data not shown).
Here we also describe the protocols for histone extraction and HPLC analysis of histone proteins. The advantage of this method is that one can determine the relative proportions of each H1 subtype within the pool of total H1 proteins as well as quantify the ratio of individual H1 subtype (and total H1) per nucleosome. In addition, compared with other protein analysis methods, such as Western blotting, the HPLC analysis provides more quantitative and reproducible measurements of all H1 subtypes. The different levels and composition of H1 subtypes in the cell modulate higher order chromatin structure. The ratio of H1 to nucleosome has been shown to correlate with chromatin compaction and is a determinant for nucleosome repeat length in chromatin 2. Thus, the methods we described here should have wide applications in chromatin research.
Disclosures
No conflicts of interest declared.
Acknowledgments
This work is supported by NIH grant GM085261 and a Georgia Cancer Coalition Distinguished Scholar Award (to Y.F.).
References
- Fan Y. H1 linker histones are essential for mouse development and affect nucleosome spacing in vivo. Mol. Cell Biol. 2003;23:4559–4572. doi: 10.1128/MCB.23.13.4559-4572.2003. [DOI] [PMC free article] [PubMed] [Google Scholar]
- Woodcock CL, Skoultchi AI, Fan Y. Role of linker histone in chromatin structure and function: H1 stoichiometry and nucleosome repeat length. Chromosome Res. 2006;14:17–25. doi: 10.1007/s10577-005-1024-3. [DOI] [PubMed] [Google Scholar]
- Shen X, Gorovsky MA. Linker histone H1 regulates specific gene expression but not global transcription in vivo. Cell. 1996;86:475–483. doi: 10.1016/s0092-8674(00)80120-8. [DOI] [PubMed] [Google Scholar]
- Alami R. Mammalian linker-histone subtypes differentially affect gene expression in vivo. Proc. Natl. Acad. Sci. U.S.A. 2003;100:5920–5925. doi: 10.1073/pnas.0736105100. [DOI] [PMC free article] [PubMed] [Google Scholar]
- Happel N, Doenecke D. Histone H1 and its isoforms: contribution to chromatin structure and function. Gene. 2009;431:1–12. doi: 10.1016/j.gene.2008.11.003. [DOI] [PubMed] [Google Scholar]
- Clausell J, Happel N, Hale TK, Doenecke D, Beato M. Histone H1 subtypes differentially modulate chromatin condensation without preventing ATP-dependent remodeling by SWI/SNF or NURF. PLoS One. 2009;4:0007243–0007243. doi: 10.1371/journal.pone.0007243. [DOI] [PMC free article] [PubMed] [Google Scholar]
- Khadake JR, Rao MR. DNA- chromatin-condensing properties of rat testes H1a and H1t compared to those of rat liver H1bdec; H1t is a poor condenser of chromatin. Biochemistry. 1995;34:15792–15801. doi: 10.1021/bi00048a025. [DOI] [PubMed] [Google Scholar]
- Orrego M. Differential affinity of mammalian histone H1 somatic subtypes for DNA and chromatin. BMC Biol. 2007;5:22–22. doi: 10.1186/1741-7007-5-22. [DOI] [PMC free article] [PubMed] [Google Scholar]
- Th'ng JP, Sung R, Ye M, Hendzel MJ. H1 family histones in the nucleus. Control of binding and localization by the C-terminal domain. J. Biol. Chem. 2005;280:27809–27814. doi: 10.1074/jbc.M501627200. [DOI] [PubMed] [Google Scholar]
- Wang ZF, Sirotkin AM, Buchold GM, Skoultchi AI, Marzluff WF. The mouse histone H1 genes: gene organization and differential regulation. J. Mol. Biol. 1997;271:124–138. doi: 10.1006/jmbi.1997.1166. [DOI] [PubMed] [Google Scholar]
- Brown DT, Sittman DB. Identification through overexpression and tagging of the variant type of the mouse H1e and H1c genes. J. Biol. Chem. 1993;268:713–718. [PubMed] [Google Scholar]
- Fan Y, Sirotkin A, Russell RG, Ayala J, Skoultchi AI. Individual somatic H1 subtypes are dispensable for mouse development even in mice lacking the H1(0) replacement subtype. Mol. Cell. Biol. 2001;21:7933–7943. doi: 10.1128/MCB.21.23.7933-7943.2001. [DOI] [PMC free article] [PubMed] [Google Scholar]
- Fan Y, Skoultchi AI. Genetic analysis of H1 linker histone subtypes and their functions in mice. Methods Enzymol. 2004;377:85–107. doi: 10.1016/S0076-6879(03)77005-0. [DOI] [PubMed] [Google Scholar]
- Heid CA, Stevens J, Livak KJ, Williams PM. Real time quantitative PCR. Genome Res. 1996;6:986–994. doi: 10.1101/gr.6.10.986. [DOI] [PubMed] [Google Scholar]


