Abstract
We utilize 198 and 204 nm excited UV resonance Raman spectroscopy (UVRR) and circular dichroism spectroscopy (CD) to monitor the backbone conformation and the GLN side chain hydrogen bonding (HB) of a short, mainly polyGLN peptide of sequence D2Q10K2 (Q10). We measured the UVRR spectra of valeramide to determine the dependence of the primary amide vibrations on amide HB. We observe that non-disaggregated Q10 (NDQ10) solution (prepared by directly dissolving the original synthesized peptide in pure water) occurs in a β-sheet conformation, where the GLN side chains form HB to either the backbone or other GLN side chains. At 60 °C, these solutions readily form amyloid fibrils. We used the polyGLN disaggregation protocol of Wetzel et al (Methods Enzymol, 2006, 413, 34–74) to dissolve the Q10 β-sheet aggregates. We observe that the disaggregated Q10 (DQ10) solutions adopt PPII-like and 2.51-helix conformations where the GLN side chains form HB to water. In contrast, these samples do not form fibrils. The NDQ10 β-sheet solution structure is essentially identical to that found in the NDQ10 solid formed upon solution evaporation. The DQ10 PPII and 2.51-helix solution structure is essentially identical to that in the DQ10 solid. Although the NDQ10 solution readily forms fibrils when heated, the DQ10 solution does not form fibrils unless seeded by NDQ10 solution. This result demonstrates very high activation barriers between these solution conformations. The NDQ10 fibril secondary structure is essentially identical to that of the NDQ10 solution, except that the NDQ10 fibril backbone conformational distribution is narrower than in the dissolved species. The NDQ10 fibril GLN side chain geometry is more constrained than when NDQ10 is in solution. The NDQ10 fibril structure is identical to that of the DQ10 fibril seeded by the NDQ10 solution.
Introduction
There are at least nine neurodegenerative diseases that are caused by long CAG DNA repeats that encode for proteins with long tracts of polyGLN residues. (1, 2) In these diseases, the extended polyGLN regions aggregate to form amyloid fibrils. (3–5) Previous studies suggest that polyGLN fibril structures are stabilized by both main chain and side chain HB.(6–9) However, there has been little work that investigates the role of HB in the aggregation mechanism(s) of polyGLN rich peptides and proteins. (10)
Given the central role that backbone and side chain HB can potentially play in stabilizing polyGLN aggregates, it is important to find spectral markers for tracking these HB. Backbone HB is sometimes monitored by measuring the frequencies of the backbone amide vibrations, such as the AmI vibration (mainly C=O s) and the AmIII vibration (mainly in-phase combination of CN s and NH b) and the N-H stretching vibration. (11–16) The frequency of the AmII vibration (mainly out of phase combination of CN s and NH b) also depends on backbone HB. (17)
However, a method for studying side chain HB is needed. The C=O stretching frequencies of ASN, GLN, protonated ASP and GLU side chains are sensitive to HB. (18–20) Unfortunately, the use of IR spectroscopy for monitoring side chain vibrations is challenging due to spectral congestion, and isotopic labeling is often required to unambiguously assign bands. Solid state NMR spectroscopy (ssNMR) has been used to characterize GLN side chain HB. (21, 22) However, ssNMR requires long measurement times, and often requires sophisticated isotope labeling.
In this work here, we show that UVRR can selectively enhance the GLN primary amide side chain vibrations, and that these vibrations can be used to track GLN side chain HB. Here, we utilize 198 and 204 nm excited UVRR and CD to monitor the backbone conformation and the GLN side chain HB of a short, mainly polyGLN peptide Q10, of sequence D2Q10K2. Previous studies of similar peptides have shown that these peptides can aggregate to form β-sheet rich amyloid fibrils. (8, 9, 23–29) We observe that non-disaggregated Q10 (NDQ10) in solution occurs as β-sheets in which the GLN side chains form HB to either the backbone or other GLN side chains. At 60 °C, these solutions readily form amyloid fibrils. We used the polyGLN disaggregation protocol of Wetzel et al (30) to disaggregate Q10. We observe that disaggregated Q10 (DQ10) solution adopts PPII-like and 2.51-helix conformations in which the GLN side chains form HB to water. These samples do not form fibrils. Addition of small quantities of NDQ10 readily nucleates fibrils. This directly demonstrates that high activation barrier occurs between the monomer extended DQ10 solution conformation and the β-sheet structures that fibrillize.
Experimental Details
Materials
The short mainly polyGLN peptide of sequence D2Q10K2 (Q10) (> 90% purity) was synthesized by AnaSpec Inc, by using a solid phase peptide synthesis method. Briefly, the first amino acid Fmoc-AA-OH was coupled onto the resin and the peptide was synthesized through sequential synthetic operations of Fmoc deprotection, washing, Fmoc amino acid coupling, and washing. The synthesized crude peptide was obtained after acid cleavage from the solid support resin using a Trifluoroacetic acid (TFA) cocktail (where TFA is the major component).
The resulting crude peptide was then purified with preparative HPLC (using large columns and high flow rates) by using a mobile phase gradient consisting of 0.1 % (v/v) TFA in water and pure acetonitrile. The purified sample was then lyophilized.
Valeramide (97% purity) was purchased from Alfa Aesar. L-Glutamine (99% purity) was purchased from Acros. TFA (99.5% purity) was purchased from Acros. 1,1,1,3,3,3-hexafluoro-2-propanol (HFIP, ≥ 99% purity) was purchased from Fluka.
Solutions of non-disaggregated Q10 (NDQ10) were prepared by directly dissolving the peptide in pure water at 1 mg/ml concentrations at pH 4.3. NDQ10 solid samples were prepared by evaporating the NDQ10 solution. The UVRR spectra were identical to that of the solid sample obtained from the manufacturer. We used the polyGLN disaggregation protocol of Wetzel et al (30) to dissolve the Q10 aggregates. Briefly, solutions of disaggregated Q10 (DQ10) were prepared by suspending 10 mg of Q10 in a 5 mL solution of 1:1 (v/v) TFA and HFIP [TFA alone dissolves Q10 aggregates (see Fig. S3 in supporting information); the primary function of HFIP is to facilitate the removal of TFA. (30)]. The samples were then sonicated for 20 min [Sonication is not essential (see Fig. S3 in supporting information)] and incubated at room temperature for ~ 2 hr. The solvents were evaporated with a gentle stream of dry N2 gas for ~ 20 min. The peptide film was resuspended in pure water at a final concentration of ~ 1 mg/mL and the pH was adjusted to 7. The peptide solution was centrifuged at 627,000 g for 30 min at 4 °C, and the top 66% of the solution was used. DQ10 solid samples were prepared by evaporating the DQ10 solution. NDQ10 fibrils were prepared by incubating 4 mg/ml NDQ10 solution at 60 °C for ~ 1 week (60 °C was chosen to speed up the reaction). DQ10 fibrils were prepared by incubating 4 mg/ml DQ10 solution after seeding with 2 % NDQ10 solution at 60 °C for ~ 4 days. Fibrils were harvested by centrifugation at 627,000 g for 15 min.
CD spectra between 190 – 250 nm were measured by using a Jasco-715 spectropolarimeter with a 0.02 cm path length cuvette. Five 1-min accumulations were averaged.
The UVRR spectrometer was described in detail by Bykov et al. (31) Briefly, 204 nm UV light was obtained by generating the fifth anti-Stokes Raman harmonic of the third harmonic of a Nd:YAG laser (Coherent, Infinity). 198 nm UV light was obtained by mixing the 3rd harmonic of the 792 nm fundamental of a 1 KHz repetition rate tunable Ti:Sapphire laser (DM20-527 TU-L-FHG) from Photonics Industries.
The liquid sample was circulated in a free surface, temperature-controlled stream. A spinning cell was used for the solid samples to minimize photodegradation; the solid samples were packed into a circular groove of the cylindrical spinning disc. The fibrils were resuspended in 100 μL pure water and transferred into a spinning Suprasil NMR tube. A 165° sampling backscattering geometry was used. The collected light was dispersed by a double monochromator onto a back thinned CCD camera with a Lumogen E coating (Princeton Instruments-Spec 10 System). We averaged four 5-min accumulations. The Raman spectral frequencies are accurate to ± 1 cm−1. The relative standard deviations in spectral intensities are ≤ 1%.
Electron micrographs were measured by using a Tecnai T12 microscope (FEI) operating at 120 KV. Samples were prepared on carbon coated grids and stained with 2% uranyl acetate. Samples were magnified 30,000 X.
X ray patterns were measured by using a Bruker Smart Apex CCD diffractometer.
Results
UVRR of valeramide
We examined the UVRR spectra of valeramide in order to model the GLN side chain primary amide UVRR spectra, to determine the dependence of the primary amide vibrations on their HB to water. 198 and 204 nm excitation both occur within the π→π* electronic transition of the primary amide group.(32) Thus, the side chain amide group vibrations are selectively enhanced.
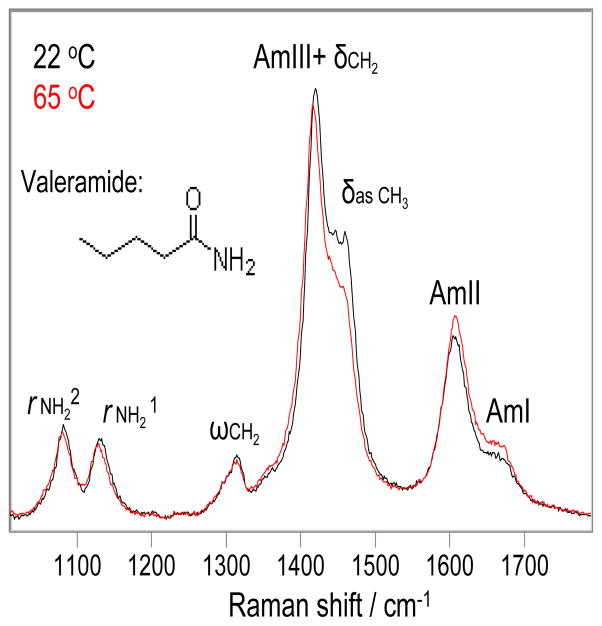
Fig. 1 shows the 204 nm excited UVRR spectra of valeramide in water at 22 °C and 65 °C. The 22 °C spectrum shows an AmI-like shoulder at ~ 1666 cm−1 (mainly CO s) and an AmII-like band at 1606 cm−1 (mainly NH2 b with a small contribution from CO s). It also shows a δasCH3 shoulder at 1458 cm−1 (asymmetric deformation of the CH3 group), and a strong peak at 1420 cm−1 where the δCH2 band (CH2 b) and an AmIII-like band (mainly CN s with minor contributions from CH2 b and NH2 r) overlap. The ωCH2 band occurs at 1312 cm−1 (CH2 w). The rNH21 and rNH22 bands (mainly NH2 r) occur at 1132 and 1082 cm−1, respectively. (32–34)
Figure 1.
Temperature dependence of the 204 nm excited UVRR spectra of valeramide in water at 22 °C (Black) and 65 °C (Red). Water contributions were removed. The intensities were normalized to the 932 cm−1 ClO4− peak height.
As the temperature increases to 65 °C, the AmI band frequency little changes. The AmII band upshifts 2 cm−1. The δasCH3 band downshifts 2 cm−1 and its intensity decreases. The AmIII+δCH2 peak downshifts 4 cm−1. The ωCH2 band does not change. The rNH21 and rNH22 bands both downshift 2 cm−1.
In acetonitrile
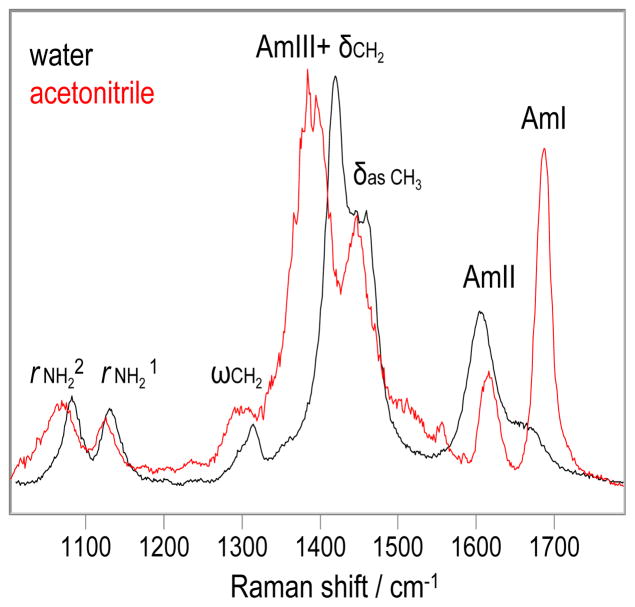
The UVRR spectrum of valeramide in pure acetonitrile (Fig. 2) changes dramatically compared to that in pure water. The AmI band upshifts 21 cm−1 due to the decreased HB in acetonitrile, (17) and its relative intensity dramatically increases. The AmII band upshifts 11 cm−1 due to the decreased HB of the -NH2. The frequency of the δasCH3 band shows little change. The AmIII+δCH2 peak and ωCH2 bands downshift 31 and 12 cm−1, respectively. The rNH21 and rNH22 bands downshift 6 and 16 cm−1, respectively.
Figure 2.
The 204 nm excited UVRR spectra of valeramide at 22 °C: Black in water; Red in pure acetonitrile. Solvent contributions were removed. The intensities were normalized to the AmIII+δCH2 peak height.
Solid state
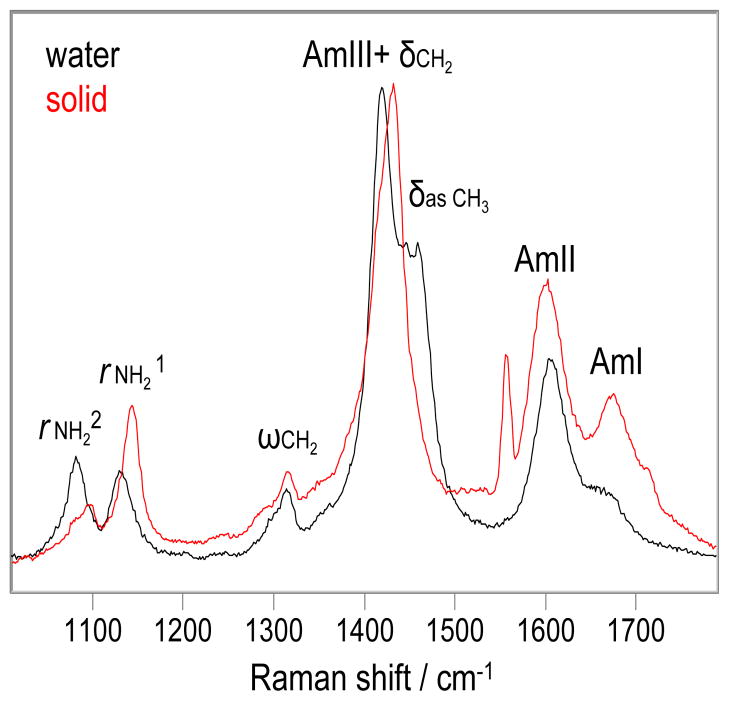
The UVRR spectrum of valeramide powder from the manufacturer (red, Fig. 3) differs significantly from that dissolved in water. The AmI band upshifts 10 cm−1, indicative of weakened carbonyl HB, (17) and the relative intensity of the AmI band significantly increases. The AmII band downshifts 5 cm−1. The AmIII+δCH2 peak becomes asymmetric and upshifts 12 cm−1. The δasCH3 band is not evident. The frequency of ωCH2 band changes little. The rNH21 and rNH22 bands upshift 10 and 8 cm−1, respectively.
Figure 3.
The 204 nm excited UVRR spectra of valeramide solid (Red) and in water (Black) at 22 °C. Water contributions were removed. The intensities were normalized to the AmIII+δCH2 peak height.
Raman cross sections for valeramide
We calculated the Raman cross sections for valeramide in water and in acetontrile by using eq 1:(35)
| eqn 1 |
where Ival and Ir are the relative intensities of the valeramide band and the internal standard band (which is the 932 cm−1 ClO4− band in aqueous solution or the 918 cm−1 C-C stretching band of acetonitrile in pure acetonitrile(36)). k(λr) and k(λval) are the spectrometer efficiencies at the wavelengths of the internal standard and valeramide Raman bands. Cr and Cval are the concentrations of the internal standard and valeramide, respectively. σr is the total differential Raman cross section of the internal standard band at the excitation frequency, νex. εex is the sample molar absorptivity at νex. εval and εr are the sample molar absorptivities at the valeramide Raman band frequency and the internal standard band frequency, respectively. The expression in the brackets approximately corrects the Raman intensities for self-absorption in a backscattering geometry.
Table 1 shows the measured total differential Raman cross sections for valeramide. The 204 nm Raman cross section values of the valeramide amide bands in pure water are approximately half of those of protein backbone secondary amide bands, (37) presumably because the primary amide group electronic transition is blueshifted from that of the peptide bond secondary amides. (32)
Table 1.
The measured total differential Raman cross sections for valeramide (mbarn·molecule−1·sr−1) at 22 °C.
| AmI | AmII | δasCH3 | AmIII+δCH2 | ωCH2 | rNH21 | rNH22 | ||
|---|---|---|---|---|---|---|---|---|
| νex = 204 nm | in water | 5.4 | 17 | 21 | 33 | 3.3 | 5.0 | 5.6 |
| in acetonitrile | 11 | 3.1 | 13 | 29 | 3.2 | 1.7 | 4.4 | |
| νex = 198 nm | in water | 14 | 52 | 58 | 94 | 11 | 14 | 15 |
| in acetonitrile | 41 | 50 | 35 | 91 | 10 | 12 | 16 | |
We did not calculate the Raman cross sections for valeramide powder because of the lack of an intensity internal standard.
The Raman cross sections of the valeramide bands in pure acetonitrile are decreased relative to those in pure water, except for the AmI band cross section, that doubles. A similar behavior was observed for the AmI band of N-methylacetamide. (38) The increased cross section was ascribed to a larger relative CO bond excited state displacement in acetonitrile. (38) The Raman cross sections of the valeramide bands generally triple as the excitation wavelength decreases from 204 to 198 nm, except for the AmII band cross section in acetonitrile, that increases by more than 10-fold. The 198 nm Raman cross section values of the valeramide primary amide bands are similar to those of the protein backbone secondary amide bands. (37)
Hydrogen bonding effects on frequencies of primary amide vibrations
These UVRR studies of valeramide indicate that the AmI, AmII, rNH21 and rNH22 frequencies of the primary amide depend on HB. Water HB to the carbonyls downshifts the AmI band by 21 cm−1 (see Table 2), while HB to the –NH2 upshifts the rNH21 and rNH22 bands by 6 and 16 cm−1, respectively; the AmII band downshifts 11 cm−1 upon HB to –NH2. The solid state AmI band upshifts 10 cm−1 relative to that in water, indicating weaker carbonyl HB in the valeramide solid than in water. The solid state AmII band downshifts 7 cm−1 compared to that in water, and the rNH21 and rNH22 bands upshift 12 and 10 cm−1, respectively. This indicates stronger –NH2 HB in the valeramide solid than in water.
Table 2.
The measured AmI, AmII, rNH21 and rNH22 frequencies of valeramide.
| AmI/cm−1 | AmII/cm−1 | rNH21/cm−1 | rNH22/cm−1 | |
|---|---|---|---|---|
| in water at 22 °C | 1666 | 1606 | 1132 | 1082 |
| in water at 65 °C | 1666 | 1608 | 1130 | 1080 |
| in acetonitrile at 22 °C | 1687 | 1617 | 1126 | 1066 |
| solid at 22 °C | 1676 | 1601 | 1142 | 1090 |
X ray studies of butyramide solid (39) (which has one less methylene than valeramide) indicate that each carbonyl forms two HBs to the two amine H atoms of two adjacent molecules, while each –NH2 forms two HBs to two carbonyls. This stronger –NH2 HB may result from the fact that while the valeramide carbonyl HB geometry is more optimized in water than in the solid state, the –NH2 HB is stronger in the solid state.
Q10 solution backbone conformation
We performed both CD and UVRR measurements to examine the Q10 solution backbone conformation. Previous studies of similar peptides indicate that non-disaggregated polyGLN peptides in aqueous solutions occur as β-sheets, (24) while freshly disaggregated polyGLN peptides adopt extended conformations.(40, 41)
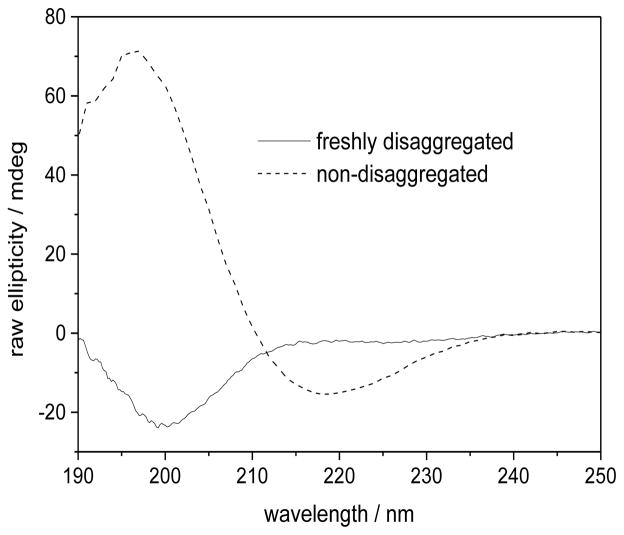
Fig. 4 shows the CD spectra of Q10 solutions. The CD spectrum of the NDQ10 in pure water (dashed line) shows a trough at ~ 218 nm and a strong positive band at 197 nm, both characteristic of β-sheet. (42) The spectrum of the DQ10 in pure water (solid line) shows a very slight negative ellipticity at ~ 220 nm and a strong negative band at 200 nm, indicative of extended conformations. (43–45)
Figure 4.
CD spectra of 1 mg/ml DQ10 (solid line) and NDQ10 (dashed line) in pure water at 22 °C. Measured by using a 0.02 cm path length cuvette.
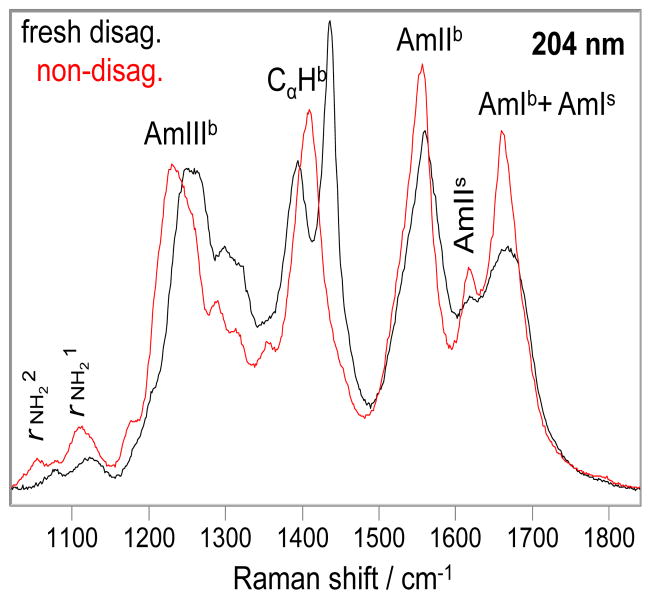
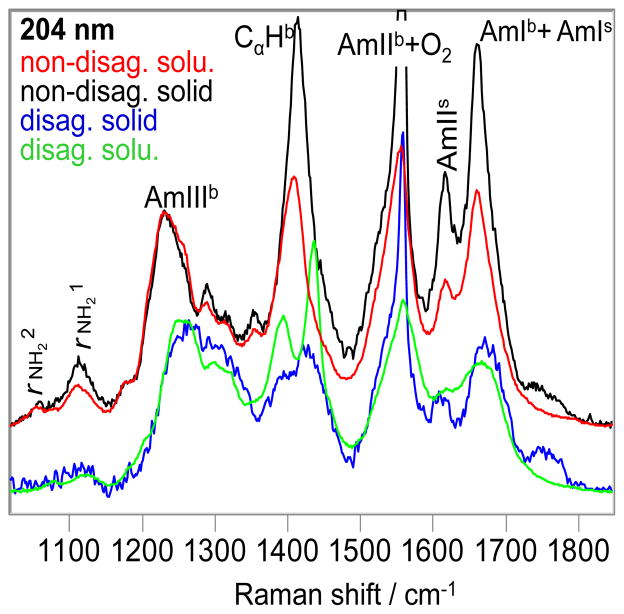
204 nm excitation occurs within the π→π* electronic transition of the backbone secondary amides (37) and to the long wavelength side of the side chain primary amide electronic transitions. (32) Fig. 5 shows that the 204 nm excited UVRR spectra of Q10 solutions are dominated by the backbone amide vibrations (indicated by b). The backbone amide vibrations are more enhanced by 204 nm excitation than are those of the side chain amide (indicated by s; the side chain amide bands were assigned based on the measured valeramide primary amide band frequencies). (32)
Figure 5.
The 204 nm excited UVRR spectra of the DQ10 (black) and NDQ10 (red) in pure water at 22 °C. b indicates backbone vibration; s indicates side chain vibration. The intensities were normalized to the AmIIIb peak height.
The UVRR spectrum of the NDQ10 (red) shows an AmIb band at ~ 1660 cm−1, an AmIIb band at ~ 1550 cm−1, the (C)Cα-Hb bending bands at ~ 1400 cm−1, and the AmIIIb region between 1180 and 1330 cm−1. The AmIb band overlaps with the GLN side chain AmIs band; the CαHb band overlaps with the side chain AmIIIs+δCH2 peak.
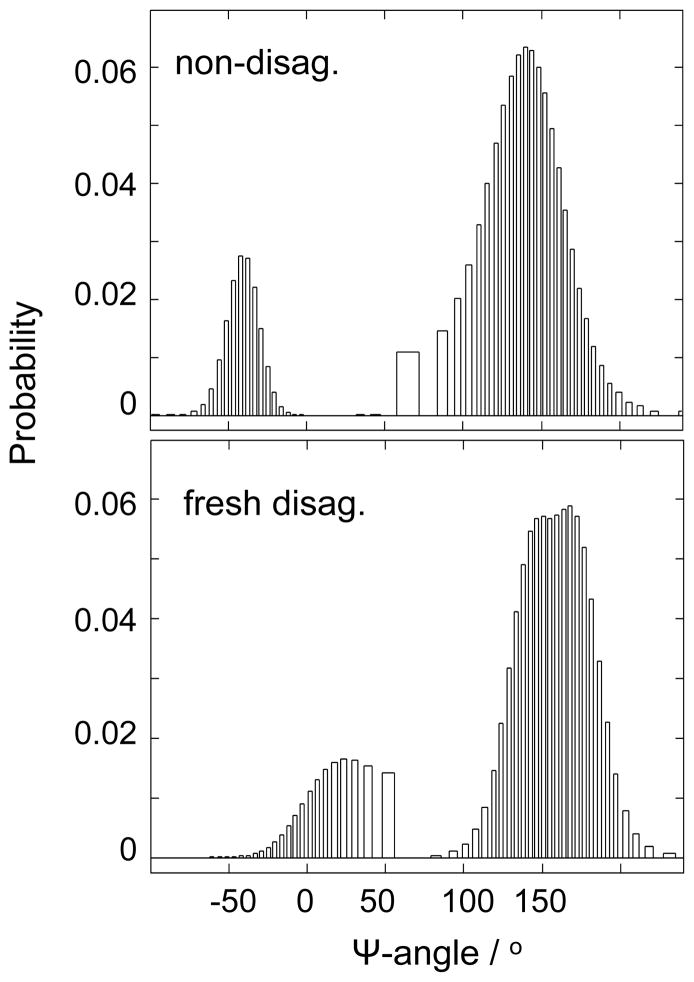
The AmIIIb region of Q10 contains no overlapping side chain contributions. We calculated the Ramachandran Ψ probability distributions for the Q10 backbone peptide bonds from the Fig. 5 UVRR spectra by using the methodology of Mikhonin et al (11, 46, 47). This method correlates different AmIII3 frequencies of the band envelope to different peptide bond Ψ angles. This deconvolutes the inhomogeneously broadened AmIII bandshape to a Ψ angle distribution (see supporting information for details). The estimated error of this Ramachandran Ψ angle determination was suggested to be ≤ ± 14°. (11)
The Fig. 6 Ψ-distribution for the NDQ10 shows a dominant β-sheet contribution (Ψ ~ 138°). It also contains contributions from Type I, Type III or Type VIII β-turn regions (Ψ ~ −40°). The Ψ-distribution for the DQ10 shows a dominant contribution of PPII-like (Ψ ~ 145°) and 2.51-helix conformations (Ψ ~ 170°). It also contains contributions of Type I′ or Type III′ β-turns (Ψ ~ 30°).
Figure 6.
Calculated Ψ-angle distributions for the NDQ10 and DQ10 in pure water at 22 °C.
Previous studies indicate that poly-L-lysine and poly-L-glutamate adopt 2.51-helix conformations that are stabilized by electrostatic repulsion between the charged side chains.(48–50) We surprisingly find that DQ10 adopts 2.51-helix conformations. The mechanism(s) by which these 2.51-helix conformations of Q10 are stabilized is unknown.
Q10 solution side chain hydrogen bonding
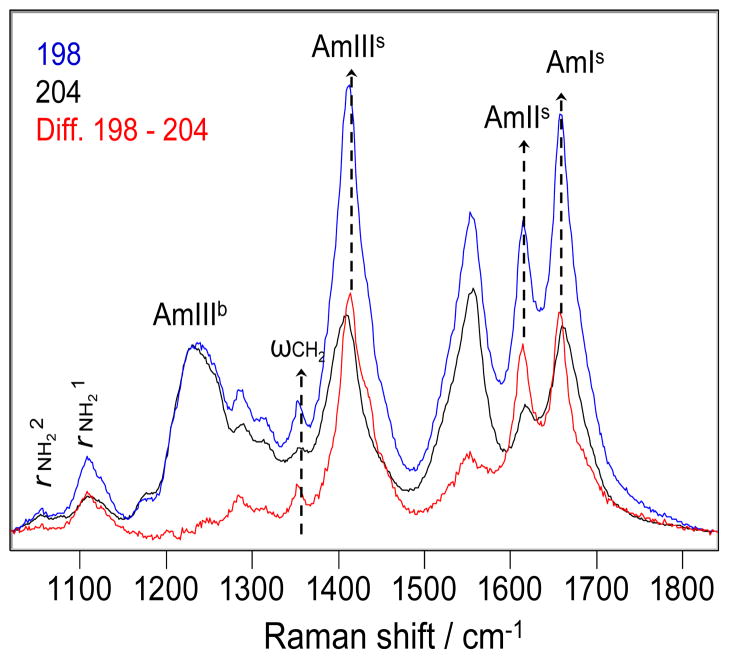
198 nm excitation (Fig. 7) enhances the primary amide UVRR bands significantly more than does 204 nm excitation. As a result, the difference spectrum between the 198 and 204 nm excited UVRR spectra of Q10 (Fig. 7) is dominated by the GLN side chain primary amide bands.
Figure 7.
The 198 (blue) and 204 nm (black) excited UVRR spectra of the NDQ10 in pure water at 22 °C, and the difference spectrum between them (red). The intensities were normalized to the AmIIIb peak height before spectral subtraction.
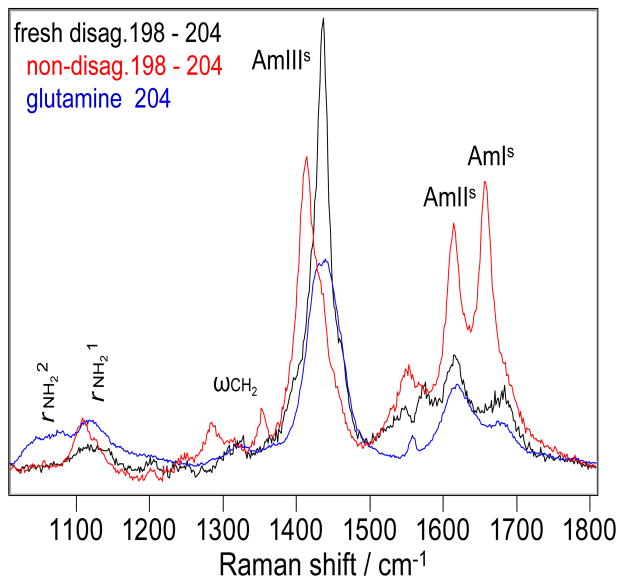
The 198 – 204 nm difference spectrum of NDQ10 in pure water (Fig. 8) shows an AmIs band at 1657 cm−1 and an AmIIs band at 1614 cm−1. It also shows an AmIIIs band at 1414 cm−1 and a ωCH2 band at 1353 cm−1. The rNH21 and rNH22 bands occur at 1110 and 1056 cm−1, respectively.
Figure 8.
The difference spectra between the 198 and 204 nm excited UVRR spectra of the NDQ10 (red) and DQ10 (black) in pure water at 22 °C. The 204 nm excited UVRR spectrum of glutamine in pure water at pH 1.6 at 22 °C (blue).
The 198 – 204 nm difference spectrum of DQ10 in pure water (Fig. 8, black) differs significantly from that of NDQ10. The DQ10 AmIs band upshifts 26 cm−1, indicating weaker HB of the GLN side chain carbonyls than that of NDQ10. The AmIIs frequency shows little change. The AmIIIs frequency upshifts 22 cm−1. The DQ10 rNH21 and rNH22 frequencies upshift 13 and 19 cm−1 respectively, indicating stronger HB of the GLN side chain –NH2 than in NDQ10.
The frequencies of the GLN primary amide vibrations of the DQ10 in pure water (Fig. 8, black) are very similar to those of glutamine in pure water (Fig. 8, blue); the 204 nm excited UVRR spectrum of glutamine only contains side chain amide vibrations, there are no secondary amides. This indicates that HB of the GLN side chains of DQ10 is similar to that of glutamine in pure water; i.e., the GLN side chains of DQ10 form HB to water.
The DQ10 AmIIIs band significantly narrows compared to glutamine in water. This may result from the fact that the glutamine side chain has conformations in solution where the primary amide side chain interacts with the –NH3+ groups.
Previous studies indicated that polyGLN aggregates adopt β-sheet conformations that are stabilized by both main chain and side chain HB. (6–9) We observe that the GLN side chain HB of NDQ10 differs significantly from that of DQ10. The NDQ10 AmIs frequency downshifts 26 cm−1 relative to that of DQ10, and its rNH21 and rNH22 frequencies downshift 13 and 19 cm−1 respectively. Table 2 shows that HB to the primary amide carbonyls significantly downshift the AmIs frequency, while HB to the –NH2 upshift the rNH21 and rNH22 frequencies. Thus, HB of the NDQ10 GLN side chain carbonyls is stronger than that of DQ10, while HB of its GLN side chain –NH2 is weaker than that of DQ10. These results indicate that the GLN side chain carbonyls of NDQ10 do not form HB to water. Instead, they form HB to the backbone –NH or to GLN side chain –NH2. Presumable, this conformation results in weaker –NH2 HB.
Q10 solids
We measured the 204 nm excited UVRR spectra of Q10 solids formed by evaporation of the NDQ10 and DQ10 solutions. The UVRR spectral frequencies of the NDQ10 solid (Fig. 9, black) are very similar to that of NDQ10 in solution (Fig. 9, red), indicating that the backbone conformations and the GLN side chain HB of NDQ10 solid and solution are essentially identical, and mainly β-sheet. The NDQ10 solid shows a powder X ray pattern (Fig. 10) very similar to that of Perutz et al.(23) The 4.75-Å reflection (Fig. 10) is characteristic of β-sheet structures.(23)
Figure 9.
The 204 nm excited UVRR spectra of the NDQ10 solid (black) and solution (red), DQ10 solid (blue) and solution (green) at 22 °C. b indicates backbone vibration; s indicates side chain vibration. The intensities were normalized to the AmIIIb peak height.
Figure 10.
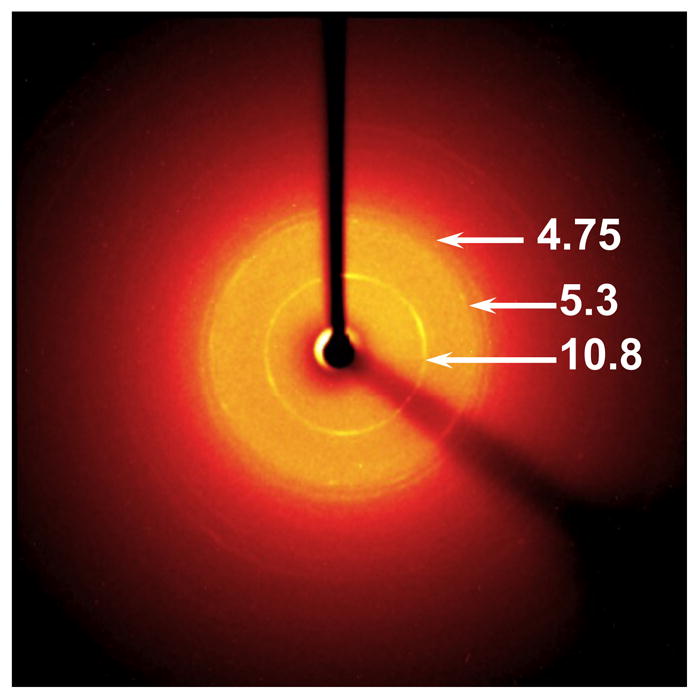
Powder x ray diffraction of NDQ10 solid. The sample was prepared by slowly evaporating NDQ10 solution on a glass slide over ~ 2 days.
The AmIIIb region of the solvent evaporated DQ10 solid (Fig. 9, blue) is similar to that of DQ10 solution (Fig. 9, green), indicating that their Q10 backbone conformations are similar. The solid state AmIIb band downshifts 7 cm−1 compared to that of solution, indicating weakened HB of the solid state backbone –NH(17); while the solid state AmIb and AmIs bands upshift 5 cm−1 relative to that of solution, indicating weakened HB to the solid backbone carbonyls and the GLN side chain carbonyls. (17)
These results indicate the Q10 solution and solid state conformations are essentially identical.
This suggests that the solution state activation barriers between extended PPII and 2.51-helix conformations and the β-sheet aggregate conformations are very high; these structures are not in a equilibrium in solution or during solution evaporation.
Q10 solution fibrillization
We observe that NDQ10 in pure water forms amyloid fibrils after incubation at 60 °C for ~ 2 days (confirmed by using TEM and the ThT binding essay (24); the short time TEM of NDQ10 does not show fibril structures, see Fig. S4 in supporting information). In contrast, DQ10 does not form fibrils even after incubation for > 2 weeks at 60 °C. However, upon seeding with a small aliquot of the NDQ10 solution, the DQ10 solution readily forms fibrils at 60 °C (confirmed by using TEM and the ThT binding assay). Thus, NDQ10 appears to contain small aggregates that seed fibrillation.
Thus, the activation barrier for DQ10 to form β-sheet aggregates that evolve to NDQ10 fibrils is quite high. The fact that DQ10 solutions do not self nucleate fibrils is consistent with previous studies of similar peptides. (24, 51, 52)
Q10 fibrils
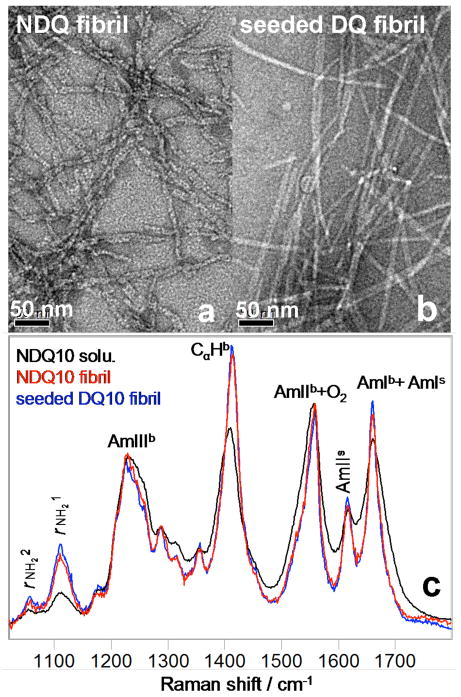
Fig. 11a and b show electron micrographs of the NDQ10 fibrils, and the DQ10 fibrils formed upon seeding with the NDQ10 solution. Fig. 11c shows the 204 nm excited UVRR spectra of the NDQ10 fibrils, the DQ10 fibrils and the UVRR spectrum of the NDQ10 solution. The NDQ10 fibril band frequencies (Fig. 11c, red) are very similar to those of the NDQ10 solution (Fig. 11c, black). Thus, the NDQ10 fibrils also occur in a β-sheet structure in which the GLN side chains form HB to the backbone or to other GLN side chains. However, the NDQ10 fibril bands are significantly narrowed compared to those in the NDQ10 solution, indicating a narrower backbone conformational distribution and more constrained GLN side chain geometries for the NDQ10 fibrils than for the NDQ10 solution.
Figure 11.
Electron micrographs of (a) NDQ10 fibrils in pure water after incubation at 60 °C for ~ 1 week and (b) DQ10 fibrils in pure water upon seeding with 2% NDQ10 solution after incubation at 60 °C for ~ 4 days. (c) 204 nm excited UVRR spectra of the NDQ10 fibrils, the DQ10 fibrils and the NDQ10 solution at 22 °C.
The UVRR spectrum of the DQ10 fibrils formed upon seeding with an aliquot of the NDQ10 solution (Figure 11c, blue) is identical to that of the NDQ10 fibrils spontaneously formed (Figure 11c, red), indicating identical Q10 backbone conformations and GLN side chain HB.
Discussion
Q10 Structure
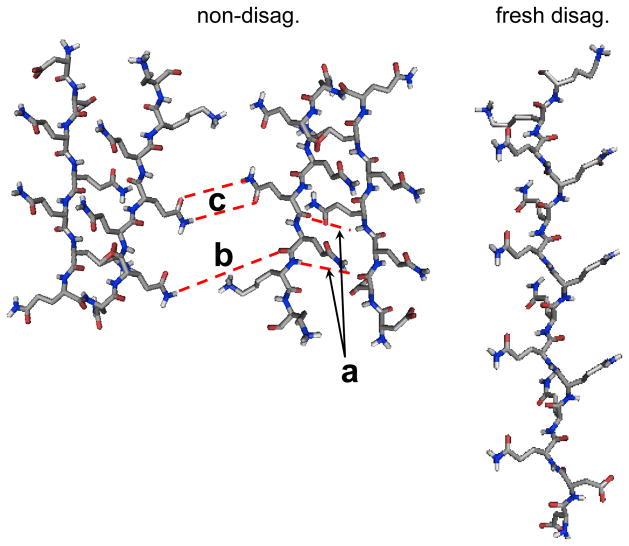
CD and UVRR studies indicate that NDQ10 in pure water adopts a predominantly β-sheet structure, consistent with previous studies indicating that polyGLN aggregates form β-sheet rich structures. (24, 53) UVRR also observes turn conformations in NDQ10. The fractions of β-sheet and turn conformations are 0.84 and 0.16, respectively. This ratio suggests that NDQ10 in pure water occurs as β-hairpins in which two residues are in the turn region and eleven residues form a β-sheet structure (Fig. 12).
Figure 12.
Proposed structures of NDQ10 and DQ10. NDQ10 occurs as β-sheets in which the GLN side chains form HB to the backbone or other GLN side chains. DQ10 adopts PPII and 2.51-helix conformations in which the GLN side chains form HB to water. Main chain – main chain HB a, main chain – side chain HB b, side chain – side chain HB c.
We observe that DQ10 in pure water adopts predominantly PPII-like and 2.51-helix conformations (Fig. 12). Previous studies indicate that glutamine residues in short polyGLN sequences have a high propensity to form PPII-like conformations,(40, 41) other studies, however, report disordered structures.(29, 51, 54–57)
198 and 204 nm excited UVRR indicate that the GLN side chains of NDQ10 form HB to the backbone or other GLN side chains, while the GLN side chains of DQ10 form HB to water.
We also observe that the NDQ10 fibril secondary structure is essentially identical to that in the NDQ10 solution, except that the NDQ10 fibril backbone conformational distribution is narrower. Thus, the fibril GLN side chain geometry is more constrained than that of the NDQ10 solution.
The UVRR determined NDQ10 fibril structure appears identical to that of the DQ10 fibrils seeded by an aliquot of the NDQ10 solution. These results suggest that the Q10 fibrils consist of stacks of β-hairpins. Previous studies of a similar peptide of sequence D2Q15K2 also indicated β-hairpin fibril structure. (8, 9, 25)
Conclusions
We utilize UVRR and CD to monitor the backbone conformation and the GLN side chain HB of a short mainly polyGLN peptide Q10, of sequence D2Q10K2. We measured UVRR spectra of valeramide to determine the dependence of primary amide vibrations on the primary amide HB. We observe that NDQ10 occurs in a β-sheet-like structure in which the GLN side chains form HB to the backbone or other GLN side chains.
These solutions readily form amyloid fibrils. In contrast, DQ10 solutions adopt PPII-like and 2.51-helix conformations in which the GLN side chains form HB to water. These samples do not form fibrils upon heating within two weeks. The NDQ10 and DQ10 solution structures are essentially identical to their solid state structures. Although the NDQ10 solution readily forms fibrils when heated, the DQ10 solution does not form fibrils unless seeds from the NDQ10 solution are added. This indicates very high activation barriers occur between these solution conformations.
The Q10 fibril secondary structure is essentially identical to that of the NDQ10 solution, except that the fibril backbone conformational distribution is narrower and its GLN side chain geometry is more constrained compared to that of the NDQ10 solution.
Supplementary Material
Acknowledgments
We thank Dr. Sergei V. Bykov for useful discussions. We also thank Lu Ma for help with instrumentation.
Footnotes
This work was supported by NIH grant 1RO1EB009089.
Methods for determination of Ψ-angle distributions from UVRR spectra; CD spectra of Q10 solutions by using different solvents for disaggregation. This information is available free of charge via the Internet at http://pubs.acs.org/.
References
- 1.Zoghbi HY, Cummings CJ. Fourteen and counting: unraveling trinucleotide repeat diseases. Hum Mol Genet. 2000;9:909–916. doi: 10.1093/hmg/9.6.909. [DOI] [PubMed] [Google Scholar]
- 2.Ross CA, Poirier MA. What is the role of protein aggregation in neurodegeneration? Nat Rev Mol Cell Biol. 2005;6:891–898. doi: 10.1038/nrm1742. [DOI] [PubMed] [Google Scholar]
- 3.Wetzel R, Bhattacharyya AM, Thakur AK. Polyglutamine aggregation nucleation: Thermodynamics of a highly unfavorable protein folding reaction. Proc Natl Acad Sci USA. 2005;102:15400–15405. doi: 10.1073/pnas.0501651102. [DOI] [PMC free article] [PubMed] [Google Scholar]
- 4.Wetzel R, Chen SM, Ferrone FA. Huntington’s disease age-of-onset linked to polyglutamine aggregation nucleation. Proc Natl Acad Sci USA. 2002;99:11884–11889. doi: 10.1073/pnas.182276099. [DOI] [PMC free article] [PubMed] [Google Scholar]
- 5.Wetzel R, Slepko N, Bhattacharyya AM, Jackson GR, Steffan JS, Marsh JL, Thompson LM. Normal-repeat-length polyglutamine peptides accelerate aggregation nucleation and cytotoxicity of expanded polyglutamine proteins. Proc Natl Acad Sci USA. 2006;103:14367–14372. doi: 10.1073/pnas.0602348103. [DOI] [PMC free article] [PubMed] [Google Scholar]
- 6.Rossetti G, Magistrato A, Pastore A, Persichetti F, Carloni P. Structural Properties of Polyglutamine Aggregates Investigated via Molecular Dynamics Simulations. J Phys Chem B. 2008;112:16843–16850. doi: 10.1021/jp806548p. [DOI] [PubMed] [Google Scholar]
- 7.Smith MH, Miles TF, Sheehan M, Alfieri KN, Kokona B, Fairman R. Polyglutamine fibrils are formed using a simple designed beta-hairpin model. Proteins-Struct, Func, Bioinform. 2010;78:1971–1979. doi: 10.1002/prot.22713. [DOI] [PubMed] [Google Scholar]
- 8.Perutz MF, Johnson T, Suzuki M, Finch JT. Glutamine repeats as polar zippers: their possible role in inherited neurodegenerative diseases. Proc Natl Acad Sic USA. 1994;91:5355–5358. doi: 10.1073/pnas.91.12.5355. [DOI] [PMC free article] [PubMed] [Google Scholar]
- 9.Sikorski P, Atkins E. New model for crystalline polyglutamine assemblies and their connection with amyloid fibrils. Biomacromolecules. 2005;6:425–432. doi: 10.1021/bm0494388. [DOI] [PubMed] [Google Scholar]
- 10.Nagai Y, Inui T, Popiel HA, Fujikake N, Hasegawa K, Urade Y, Goto Y, Naiki H, Toda T. A toxic monomeric conformer of the polyglutamine protein. Nat Struct Mol Biol. 2007;14:332–340. doi: 10.1038/nsmb1215. [DOI] [PubMed] [Google Scholar]
- 11.Mikhonin AV, Bykov SV, Myshakina NS, Asher SA. Peptide secondary structure folding reaction coordinate: Correlation between UV Raman amide III frequency, Psi Ramachandran angle, and hydrogen bonding. J Phys Chem B. 2006;110:1928–1943. doi: 10.1021/jp054593h. [DOI] [PubMed] [Google Scholar]
- 12.Manas ES, Getahun Z, Wright WW, DeGrado WF, Vanderkooi JM. Infrared spectra of amide groups in alpha-helical proteins: Evidence for hydrogen bonding between helices and water. J Am Chem Soc. 2000;122:9883–9890. [Google Scholar]
- 13.Wang Y, Purrello R, Jordan T, Spiro TG. UVRR spectroscopy of the peptide bond. 1. Amide S, a nonhelical structure marker, is a CαH bending mode. J Am Chem Soc. 1991;113:6359–6368. [Google Scholar]
- 14.Mirkin NG, Krimm S. Structural dependence of NH stretch mode frequency shifts in amide and peptide. J Phys Chem A. 2004;108:5438–5448. [Google Scholar]
- 15.Fu L, Liu J, Yan ECY. Chiral Sum Frequency Generation Spectroscopy for Characterizing Protein Secondary Structures at Interfaces. J Am Chem Soc. 2011;133:8094–8097. doi: 10.1021/ja201575e. [DOI] [PubMed] [Google Scholar]
- 16.Fu L, Wang Z, Yan EC. Chiral vibrational structures of proteins at interfaces probed by sum frequency generation spectroscopy. Int J Mol Sci. 2011;12:9404–9425. doi: 10.3390/ijms12129404. [DOI] [PMC free article] [PubMed] [Google Scholar]
- 17.Myshakina NS, Ahmed Z, Asher SA. Dependence of amide vibrations on hydrogen bonding. J Phys Chem B. 2008;112:11873–11877. doi: 10.1021/jp8057355. [DOI] [PMC free article] [PubMed] [Google Scholar]
- 18.Barth A. The infrared absorption of amino acid side chains. Prog Biophys Mol Biol. 2000;74:141–173. doi: 10.1016/s0079-6107(00)00021-3. [DOI] [PubMed] [Google Scholar]
- 19.Takei K, Takahashi R, Noguchi T. Correlation between the hydrogen-bond structures and the C=O stretching frequencies of carboxylic acids as studied by density functional theory calculations: Theoretical basis for interpretation of infrared bands of carboxylic groups in proteins. J Phys Chem B. 2008;112:6725–6731. doi: 10.1021/jp801151k. [DOI] [PubMed] [Google Scholar]
- 20.Natalello A, Frana AM, Relini A, Apicella A, Invernizzi G, Casari C, Gliozzi A, Doglia SM, Tortora P, Regonesi ME. A Major Role for Side-Chain Polyglutamine Hydrogen Bonding in Irreversible Ataxin-3 Aggregation. Plos One. 2011;6:e18789. doi: 10.1371/journal.pone.0018789. [DOI] [PMC free article] [PubMed] [Google Scholar]
- 21.Schneider R, Schumacher MC, Mueller H, Nand D, Klaukien V, Heise H, Riedel D, Wolf G, Behrmann E, Raunser S, Seidel R, Engelhard M, Baldus M. Structural characterization of polyglutamine fibrils by solid-state NMR spectroscopy. J Mol Biol. 2011;412:121–136. doi: 10.1016/j.jmb.2011.06.045. [DOI] [PubMed] [Google Scholar]
- 22.Sivanandam VN, Jayaraman M, Hoop CL, Kodali R, Wetzel R, van der Wel PC. The aggregation-enhancing huntingtin N-terminus is helical in amyloid fibrils. J Am Chem Soc. 2011;133:4558–4566. doi: 10.1021/ja110715f. [DOI] [PMC free article] [PubMed] [Google Scholar]
- 23.Perutz MF, Finch JT, Berriman J, Lesk A. Amyloid fibers are water-filled nanotubes. Proc Natl Acad Sic USA. 2002;99:5591–5595. doi: 10.1073/pnas.042681399. [DOI] [PMC free article] [PubMed] [Google Scholar]
- 24.Chen SM, Berthelier V, Hamilton JB, O’Nuallain B, Wetzel R. Amyloid-like features of polyglutamine aggregates and their assembly kinetics. Biochemistry. 2002;41:7391–7399. doi: 10.1021/bi011772q. [DOI] [PubMed] [Google Scholar]
- 25.Sharma D, Shinchuk LM, Inouye H, Wetzel R, Kirschner DA. Polyglutamine homopolymers having 8–45 residues form slablike beta-crystallite assemblies. Proteins-Struct, Func, Bioinform. 2005;61:398–411. doi: 10.1002/prot.20602. [DOI] [PubMed] [Google Scholar]
- 26.Lee CC, Walters RH, Murphy RM. Reconsidering the mechanism of polyglutamine peptide aggregation. Biochemistry. 2007;46:12810–12820. doi: 10.1021/bi700806c. [DOI] [PubMed] [Google Scholar]
- 27.Darnell G, Orgel JPRO, Pahl R, Meredith SC. Flanking polyproline sequences inhibit beta-sheet structure in polyglutamine segments by inducing PPII-like helix structure. J Mol Biol. 2007;374:688–704. doi: 10.1016/j.jmb.2007.09.023. [DOI] [PubMed] [Google Scholar]
- 28.Kar K, Jayaraman M, Sahoo B, Kodali R, Wetzel R. Critical nucleus size for disease-related polyglutamine aggregation is repeat-length dependent. Nat Struct Mol Biol. 2011;18:328–336. doi: 10.1038/nsmb.1992. [DOI] [PMC free article] [PubMed] [Google Scholar]
- 29.Walters RH, Murphy RM. Examining Polyglutamine Peptide Length: A Connection between Collapsed Conformations and Increased Aggregation. J Mol Biol. 2009;393:978–992. doi: 10.1016/j.jmb.2009.08.034. [DOI] [PMC free article] [PubMed] [Google Scholar]
- 30.O’Nuallain B, Thakur AK, Williams AD, Bhattacharyya AM, Chen SM, Thiagarajan G, Wetzel R. Kinetics and thermodynamics of amyloid assembly using a high-performance liquid chromatography-based sedimentation assay. Methods Enzymol. 2006;413:34–74. doi: 10.1016/S0076-6879(06)13003-7. [DOI] [PubMed] [Google Scholar]
- 31.Bykov S, Lednev I, Ianoul A, Mikhonin A, Munro C, Asher SA. Steady-state and transient ultraviolet resonance Raman spectrometer for the 193–270 nm spectral region. Appl Spectrosc. 2005;59:1541–1552. doi: 10.1366/000370205775142511. [DOI] [PubMed] [Google Scholar]
- 32.Dudik JM, Johnson CR, Asher SA. Uv Resonance Raman Studies of Acetone, Acetamide, and N-Methylacetamide - Models for the Peptide-Bond. J Phys Chem. 1985;89:3805–3814. [Google Scholar]
- 33.Kuroda Y, Saito Y, Uno T, Machida K. Vibrational-Spectra of Propionamide and Its C-Deuterated and N-Deuterated Compounds. Bull Chem Soc Jap. 1972;45:2371–2383. [Google Scholar]
- 34.Nandini G, Sathyanarayana DN. Ab initio studies on molecular conformation and vibrational spectra of propionamide. J Mol Struct-Theochem. 2002;586:125–135. doi: 10.1016/j.saa.2003.07.008. [DOI] [PubMed] [Google Scholar]
- 35.Xiong K, Asher SA. Lowest Energy Electronic Transition in Aqueous Cl− Salts: Cl− -> (H2O)6 Charge Transfer Transition. J Phys Chem A. 2011;115:9345–9348. doi: 10.1021/jp1085729. [DOI] [PMC free article] [PubMed] [Google Scholar]
- 36.Dudik JM, Johnson CR, Asher SA. Wavelength Dependence of the Preresonance Raman Cross-Sections of CH3CN, SO42−, ClO4−, and NO3−. J Chem Phys. 1985;82:1732–1740. [Google Scholar]
- 37.Sharma B, Bykov SV, Asher SA. UV resonance Raman investigation of electronic transitions in alpha-helical and polyproline II-like conformations. J Phys Chem B. 2008;112:11762–11769. doi: 10.1021/jp801110q. [DOI] [PMC free article] [PubMed] [Google Scholar]
- 38.Chen XG, Asher SA, Schweitzerstenner R, Mirkin NG, Krimm S. UV Raman Determination of the π – π* Excited-State Geometry of N-Methylacetamide - Vibrational Enhancement Pattern. J Am Chem Soc. 1995;117:2884–2895. [Google Scholar]
- 39.Lewis TC, Tocher DA. A low-temperature determination of butyramide. Acta Crystal Sec E-Struct Reports Online. 2005;61:O1985–O1986. [Google Scholar]
- 40.Chellgren BW, Miller AF, Creamer TP. Evidence for polyproline II helical structure in short polyglutamine tracts. J Mol Biol. 2006;361:362–371. doi: 10.1016/j.jmb.2006.06.044. [DOI] [PubMed] [Google Scholar]
- 41.Wang XL, Vitalis A, Wyczalkowski MA, Pappu RV. Characterizing the conformational ensemble of monomeric polyglutamine. Proteins-Struct, Func, Bioinform. 2006;63:297–311. doi: 10.1002/prot.20761. [DOI] [PubMed] [Google Scholar]
- 42.Woody RW. Theory of Circular Dichroism of Proteins. Plenum Press; New York: 1996. [Google Scholar]
- 43.Sreerama N, Woody RW. Poly(Pro)II Helices in Globular-Proteins - Identification and Circular Dichroic Analysis. Biochemistry. 1994;33:10022–10025. doi: 10.1021/bi00199a028. [DOI] [PubMed] [Google Scholar]
- 44.Shi Z, Olson C, Rose G, Baldwin R, Kallenbach N. Polyproline II structure in a sequence of seven alanine residues. Proc Natl Acad Sci USA. 2002;99:9190–9195. doi: 10.1073/pnas.112193999. [DOI] [PMC free article] [PubMed] [Google Scholar]
- 45.Shi Z, Chen K, Liu Z, Kallenbach N. Conformation of the backbone in unfolded proteins. Chem Rev. 2006;106:1877–1897. doi: 10.1021/cr040433a. [DOI] [PubMed] [Google Scholar]
- 46.Mikhonin AV, Asher SA. Direct UV Raman monitoring of 310-helix and π-bulge premelting during alpha-helix unfolding. J Am Chem Soc. 2006;128:13789–13795. doi: 10.1021/ja062269+. [DOI] [PubMed] [Google Scholar]
- 47.Asher SA, Mikhonin AV, Bykov S. UV Raman demonstrates that alpha-helical polyalanine peptides melt to polyproline II conformations. J Am Chem Soc. 2004;126:8433–8440. doi: 10.1021/ja049518j. [DOI] [PubMed] [Google Scholar]
- 48.Mikhonin AV, Myshakina NS, Bykov SV, Asher SA. UV resonance Raman determination of polyproline II, extended 2.51-helix, and beta-sheet psi angle energy landscape in poly-L-lysine and poly-L-glutamic acid. J Am Chem Soc. 2005;127:7712–7720. doi: 10.1021/ja044636s. [DOI] [PubMed] [Google Scholar]
- 49.Ma L, Ahmed Z, Asher SA. Ultraviolet Resonance Raman Study of Side Chain Electrostatic Control of Poly-L-Lysine Conformation. J Phys Chem B. 2011;115:4251–4258. doi: 10.1021/jp2005343. [DOI] [PMC free article] [PubMed] [Google Scholar]
- 50.Xiong K, Ma L, Asher SA. Conformation of poly-L-glutamate is independent of ionic strength. Biophys Chem. 2012;162:1–5. doi: 10.1016/j.bpc.2011.11.002. [DOI] [PMC free article] [PubMed] [Google Scholar]
- 51.Chen S, Berthelier V, Yang W, Wetzel R. Polyglutamine aggregation behavior in vitro supports a recruitment mechanism of cytotoxicity. J Mol Biol. 2001;311:173–182. doi: 10.1006/jmbi.2001.4850. [DOI] [PubMed] [Google Scholar]
- 52.Chen S, Wetzel R. Solubilization and disaggregation of polyglutamine peptides. Protein Sci. 2001;10:887–891. doi: 10.1110/ps.42301. [DOI] [PMC free article] [PubMed] [Google Scholar]
- 53.Sharma D, Sharma S, Pasha S, Brahmachari SK. Peptide models for inherited neurodegenerative disorders: conformation and aggregation properties of long polyglutamine peptides with and without interruptions. FEBS Lett. 1999;456:181–185. doi: 10.1016/s0014-5793(99)00933-3. [DOI] [PubMed] [Google Scholar]
- 54.Chen SM, Ferrone FA, Wetzel R. Huntington’s disease age-of-onset linked to polyglutamine aggregation nucleation. Proc Natl Acad Sci USA. 2002;99:11884–11889. doi: 10.1073/pnas.182276099. [DOI] [PMC free article] [PubMed] [Google Scholar]
- 55.Crick SL, Jayaraman M, Frieden C, Wetzel R, Pappu RV. Fluorescence correlation spectroscopy shows that monomeric polyglutamine molecules form collapsed structures in aqueous solutions. Proc Natl Acad Sci USA. 2006;103:16764–16769. doi: 10.1073/pnas.0608175103. [DOI] [PMC free article] [PubMed] [Google Scholar]
- 56.Masino L, Kelly G, Leonard K, Trottier Y, Pastore A. Solution structure of polyglutamine tracts in GST-polyglutamine fusion proteins. Febs Letters. 2002;513:267–272. doi: 10.1016/s0014-5793(02)02335-9. [DOI] [PubMed] [Google Scholar]
- 57.Walters RH, Murphy RM. Examing polyglutamine peptide length: a connection between collapsed conformations and increased aggregation. J Mol Biol. 2009;393:978–992. doi: 10.1016/j.jmb.2009.08.034. [DOI] [PMC free article] [PubMed] [Google Scholar]
Associated Data
This section collects any data citations, data availability statements, or supplementary materials included in this article.


