Abstract
Recent advances in the understanding of castrate-resistant prostate cancer (CRPC) have lead to a growing number of experimental therapies, many of which are directed against the androgen-receptor (AR) signaling axis. These advances generate the need for reliable molecular imaging biomarkers to non-invasively determine efficacy, and to better guide treatment selection of these promising AR-targeted drugs.
Methods
We draw on our own experience, supplemented by review of the current literature, to discuss the systematic development of imaging biomarkers for use in the context of CRPC, with a focus on bone scintigraphy, F-18 fluorodeoxyglucose (FDG)-positron emission tomography (PET) and PET imaging of the AR signaling axis.
Results
The roadmap to biomarker development mandates rigorous standardization and analytic validation of an assay before it can be qualified successfully for use in an appropriate clinical context. The Prostate Cancer Working Group 2 (PCWG2) criteria for “radiographic” progression by bone scintigraphy serve as a paradigm of this process. Implemented by the Prostate Cancer Clinical Trials Consortium (PCCTC), these consensus criteria may ultimately enable the co-development of more potent and versatile molecular imaging biomarkers. Purported to be superior to single-photon bone scanning, the added value of Na18F-PET for imaging of bone metastases is still uncertain. FDG-PET already plays an integral role in the management of many diseases, but requires further evaluation before being qualified in the context of CRPC. PET tracers that probe the AR signaling axis, such as 18F-FDHT and 89Zr-591, are now under development as pharmacodynamic markers, and as markers of efficacy, in tandem with FDG-PET. Semi-automated analysis programs for facilitating PET interpretation may serve as a valuable tool to help navigate the biomarker roadmap.
Conclusions
Molecular imaging strategies, particularly those that probe the AR signaling axis, have the potential to accelerate drug development in CRPC. The development and use of analytically valid imaging biomarkers will increase the likelihood of clinical qualification, and ultimately lead to improved patient outcomes.
About 32,050 men will die of prostate cancer in the United States in 2010 [1], the majority after the transition to a castration resistant state, the invariably lethal form of the disease [2]. The hallmark of castration resistant prostate cancer (CRPC) is evidence of tumor growth despite castrate levels of serum androgens [3]. Several important insights into the molecular pathogenesis of CRPC, including mechanisms of androgen receptor (AR) signaling, have now been elucidated, leading to the development of new and more potent therapies targeting the AR pathway [4]. These novel agents include inhibitors of CYP17, an enzyme required for androgen synthesis; direct AR-antagonists that prevent nuclear translocation; inhibitors of HSP90 which protects AR from degradation; inhibitors of histone deacetylases which is required for optimal AR mediated transcription, and tyrosine kinase inhibitors. A number of these drugs appear to durably repress disease growth, even after numerous prior hormonal treatments and chemotherapy [5–7]. Despite these advances there remains a pressing need for continued drug development in this arena. The difficulty in introducing new prostate cancer drugs to the market is well documented. Among the challenges confronted is the disease's heterogeneous clinical course, which complicates eligibility and response criteria for clinical trials. This problem has been addressed in part through the use of the “clinical-states” framework for organizing the natural history of the disease [8], but substantial impediments persist. Notably, the chief manifestation of metastatic disease (i.e., bone metastases) is notoriously difficult to monitor. Furthermore, multiple mechanisms have been implicated in AR signaling reactivation, which in part accounts for the non-uniform response to AR directed therapy [9]. These obstacles highlight the need for biomarker development in CRPC. Molecular imaging with PET has the potential to address this need through its versatility, non-invasiveness and quantitative capabilities.
The Biomarker Roadmap
A biomarker is “a factor that is objectively measured and evaluated as an indicator of normal biological processes, pathogenic processes, or pharmacologic responses to a therapeutic intervention” [10]. Biomarkers can be sub-classified into various categories, including: (1) predictive/risk markers, (2) pharmacodynamic markers, and (3) biologic response/progression markers. The roadmap for biomarker qualification requires rigorous standards for trial design, data capture, reporting, and analysis [11]. Imaging biomarkers, like any assay, should be measured in an analytic test system with well-established performance characteristics. The validated imaging test must then undergo qualification, which is the evidentiary process of linking a biomarker with a biological process or clinical endpoint, in other words, establishing “fitness for purpose” [12]. A validated imaging test qualified for use in one disease entity, or cancer-type, may not qualify for use in other settings. Similarly, an assay that is validated for predicting risk may not be useful as a marker of progression.
Imaging biomarkers of response/progression are often used as endpoints in oncologic trials. Overall survival (OS) is regarded as the gold standard of clinical endpoints, defined as the time from the start of study treatment to the date of death of any cause. Because survival endpoints can take years to reach, regulatory authorities, such as the Federal Drug Administration (FDA) in the United States, allow for accelerated approval in certain life-threatening diseases. Accelerated approval is usually based on an endpoint “reasonably likely to predict” clinical benefit. It is distinct from a surrogate endpoint which, as defined by Prentice, must meet the following criteria: 1) treatment has a statistically significant impact on the true endpoint; 2) treatment has a statistically significant impact on the surrogate endpoint; 3) the surrogate endpoint has a statistically significant impact on the true endpoint; and 4) the full effect of the treatment on the true endpoint should be captured by surrogate endpoint [13]. Surrogate endpoints commonly incorporated in oncologic clinical trials include objective response rate (ORR), time to progression (TTP) and progression free survival (PFS) [14]. ORR is defined as the proportion of subjects with a predefined amount of reduction in tumor burden, often assessed on the basis of radiologic criteria, as in Response Evaluation Criteria in Solid Tumors (RECIST) [15]. Unfortunately, RECIST has a limited role in CRPC drug development, and is only applicable to the assessment of soft-tissue disease [16]. TTP is often a composite endpoint defined as the time from the start of study treatment to the date of the first documentation of objective tumor progression/relapse, initiation of other cancer therapy, or death as a result of the tumor, whichever comes first. PFS is similar to TTP, but also includes death from any cause. These composite endpoints face difficulties in terms of data collection and analysis, and are susceptible to subjective bias. The precise definition of TTP and PFS, specifically, the measurement of progression or relapse, continues to evolve as new biomarkers for progression are established.
The broader oncology community in the United States is attempting to address the need for qualified biomarkers through collaborative efforts between the FDA, the National Cancer Institute (NCI) and other regulatory bodies, with the formulation of consortia such as the Oncology Biomarkers Qualification Initiative (OBQI) and the AACR-FDA-NCI Cancer Biomarkers Collaborative [17]. Meanwhile, tangible measures to improve patient outcomes have been undertaken by the prostate cancer clinical trials community. Specifically, the Prostate Cancer Clinical Trials Consortium (PCCTC) was created in 2006, supported by the Prostate Cancer Foundation and the US Department of Defense, for the purpose of carefully designing and conducting phase 1 and 2 multicenter clinical trials. Memorial Sloan-Kettering Cancer Center (MSKCC) is the coordinating center for the consortium, which is currently comprised of 13 prostate cancer research centers [18]. The PCCTC has already successfully conducted studies controlling for patient population and prior treatment, as well as for scanning algorithm, imaging endpoints and interpretation. The consortium’s effort to redefine endpoints in prostate cancer clinical trials resulted in the internationally adopted Prostate Cancer Working Group 2 (PCWG2) Consensus Criteria for phase I/II clinical trials [19]. A major focus of the PCWG2 is to substantiate “radiographic” progression on the nuclear medicine bone scan as a clinically meaningful biomarker and endpoint for CRPC.
Bone Scintigraphy
The PCWG2 recognized that trial eligibility and end points based solely on the presence and regression/progression of measurable lesions (target lesions as defined by RECIST) would shift the emphasis from bone metastases (considered unmeasurable) to lymph nodes, which occur in only 20–25% of prostate cancer patients. Bone metastases, on the other hand, are the primary cause of morbidity and mortality in the CRPC population, developing in 80–90% of patients [20]. Typical sequelae include pain, hematologic disorders, fracture, and neurologic compromise [21]. Given the predominance of bone involvement, the uncertainty surrounding the clinical significance of PSA as a marker of ”response” or progression [22], and the increased availability of cytostatic agents, reliable methods to ascertain progression in bone are of increasing importance.
The X-ray has been used for the detection of metastatic prostate cancer in bone since the early days of “skiagraphy” [23]. The plain radiograph still plays an important role in the assessment of skeletal metastases, but has largely been supplanted by bone scintigraphy [24]. 99mTc-methylene diphosphonate (MDP) and similar radiolabeled phosphate analogues, introduced for bone scanning in the early 1970's, are incorporated into the hydroxyapatite crystalline lattice and collagen matrix [25]. Uptake is a function of blood supply, rate of bone turnover or osteoblastic activity, quantity of mineralized bone, capillary permeability, fluid pressure and local acid/base balance. Bone scanning is highly sensitive for blastic metastases and allows for quick appraisal of the entire skeleton. It is widely available, relatively inexpensive and reimbursable, making it the preferred modality for assessing bone metastases. The main shortcoming of the bone scan is that it depicts secondary changes rather than directly imaging the tumor. As such, early metastases may be missed and sensitivity for detection of osteolytic disease is lacking. Regression of disease is nearly impossible to verify on account of lingering uptake in healing bone, despite eradication of tumor. Moreover, response assessment is confounded by the flare phenomenon, a major obstacle that can occur up to 12 weeks post effective treatment [26]. Thus, the declaration of scintigraphic progression during this period should be restrained in comparison to later time points. Changes in intensity or minor changes in extent of existing lesions are nonspecific features and should not be considered determinants of progression at any time point.
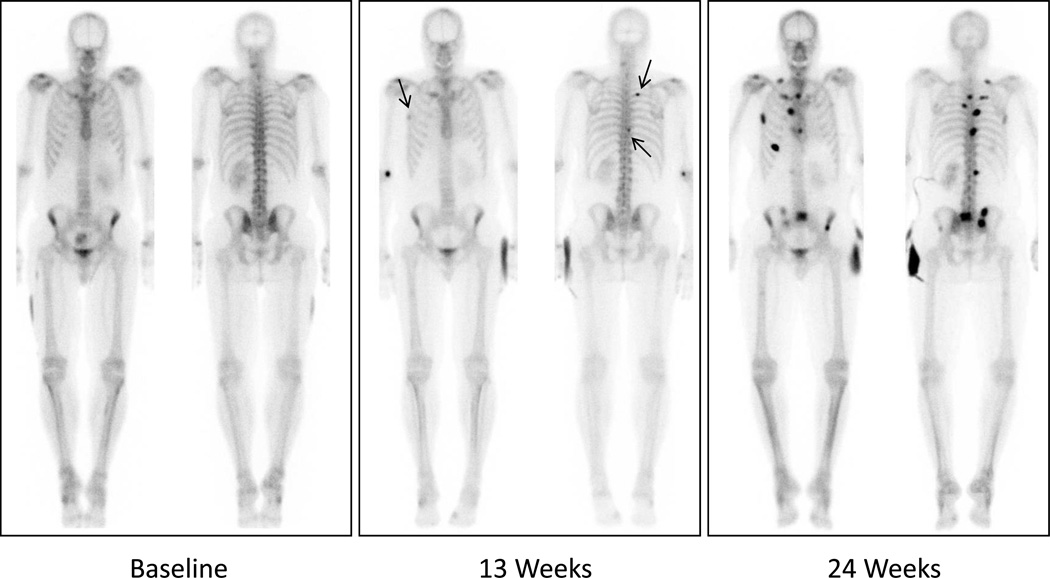
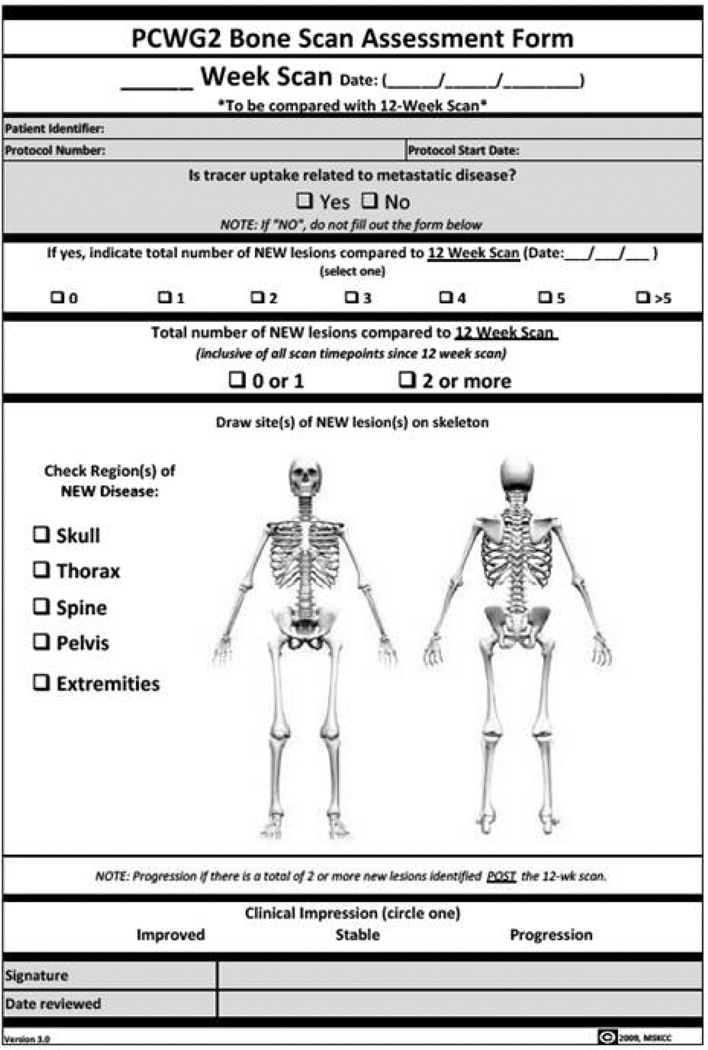
Recognizing the variability in bone scan interpretation between observers, the PCWG2 emphasized the need for standardization of reporting, as a requirement to begin studies designed to generate the evidence toward qualification. The simplified approach recommended by the PCWG2 requires the emergence of two or more unequivocal metastatic lesions, beyond the flare period, in order to declare progression. New lesions seen at the first post-flare window reassessment require a confirmatory scan performed 6 or more weeks later demonstrating at least two additional new lesions (Figure 1). PCWG2 discourages the performance of follow-up bone scanning prior to 12 weeks after start of therapy, unless clinically indicated. These criteria have been operationalized through standardized data collection forms that are now incorporated into PCCTC clinical trials (Figure 2). These forms enabled the analytical validation of the PCWG2 progression endpoint so that the clinical qualification process in the context of phase III clinical trials for the novel antiandrogens, abiraterone and MDV3100 could begin.
Figure 1.
Example of scintigraphic progression per PCWG2: Two or more new lesions appear on first post-12 week assessment (arrows), followed by at least 2 additional new lesions on confirmation scan more than 6 weeks later.
Figure 2.
The analytically validated PCWG2 bone scan assessment form currently undergoing clinical qualification in phase 3 registration trials.
We hypothesized that the utility of the bone scan could be strengthened by employing a quantitative measure of disease burden to integrate into statistical analyses. An example of such a metric is the Bone Scan Index (BSI) [27], which measures the total skeletal tumor burden in ordinal terms. Developed by Larson and colleagues in the 1990's, the BSI was shown to be prognostic for survival, and the role in the assessment of “response” and “progression” is under investigation [28,29]. The manual BSI measurement while time consuming and tedious, was shown to be highly reproducible. Automated methods for interpreting bone scans that can produce results within seconds and with 100% reproducibility are under development and may prove useful for calculating the BSI [30–32]. Though promising, the automated platform itself must first be validated against the manual technique before its prognostic value can be determined.
Additional efforts to standardize the assessment of bone disease include the proposed criteria from MD Anderson (MDA), the PET Response Criteria in Solid Tumors (PERCIST) by Wahl and colleagues, and the updated RECIST 1.1 publication [33–35]. The latter only addresses osteolytic lesions with soft tissue components that are infrequent in prostate cancer. The MDA report proposes a multimodality approach that incorporates bone scan, X-ray, CT and MRI. The recently proposed PERCIST is presumed to apply equally to bone and soft tissue lesions alike, given that the functional information derived from PET is largely independent of tissue type. As was the case with the proposed PCWG2 bone scan progression criteria, both the MDA and PERCIST proposed criteria will require analytical validation before they can begin qualification testing. Until PET and other molecular imaging biomarkers are qualified in the context of CRPC, rigorously standardized bone scanning may for now serve as the groundwork by which these other modalities are tested.
Positron Emission Tomography (PET)
Several PET tracers have shown promise as potential biomarkers in CRPC [36]. 18F-Sodium Fluoride (NaF) is a high affinity bone seeking agent that if employed in lieu of the single photon 99mTc agents could enhance traditional bone scanning. 18F-FDG-PET is a marker of tumor glycolytic rate (Warburg effect [37]) with established benefits in several contexts [38–40], while the role in prostate cancer management is still considered “investigational”. Additional metabolic agents such as 18F-FACBC, 18F-Choline, and 11C-methionine have been studied extensively in prostate cancer, but are beyond the scope of this review. Finally, 18F-FDHT and novel tracers such as 89Zr-J591 are under development for probing the AR signaling axis.
18F-Sodium Flouride (NaF) PET
Ironically, NaF was developed for bone scanning as a single photon agent prior to the advent of the 99mTc phosphonates [41], but is being reinvestigated as a PET tracer. Possible advantages of NaF over 99mTc-agents are attributable to the higher affinity for osteoblastic activity, and the superior imaging characteristics of PET. Several studies have suggested that NaF performs better than 99mTc-agents for the detection of metastases, particularly when combined with the anatomic information derived from CT. Even-Sapir et al. compared planar bone scintigraphy, bone SPECT, NaF PET, and NaF PET/CT in patients with localized high-risk or metastatic prostate cancer. The reported sensitivity and specificity for detection of bone lesions was higher for NaF PET/CT (100% and 100%, respectively) than for planar bone scanning (70% and 57%), bone SPECT (92% and 82%) or NaF PET (100% and 62%) [42]. These results seem to favor NaF PET/CT over traditional bone scanning; however, the study included a mixed population and did not include a standard comparator. Further investigation of NaF in the context of rigorously controlled prospective trials is needed before it can be recommended to replace the single photon bone scan, which is less expensive and more widely available.
18F-FDG: Imaging Tumor Glycolysis
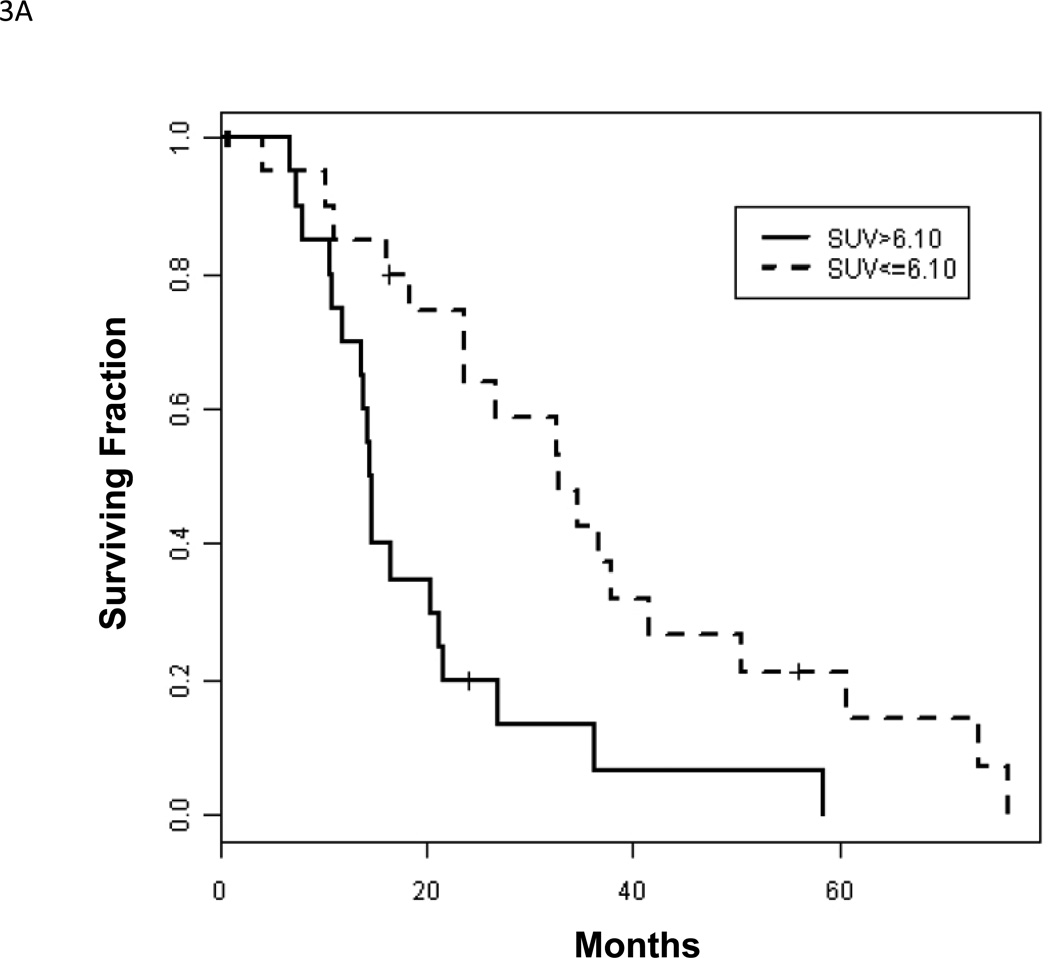
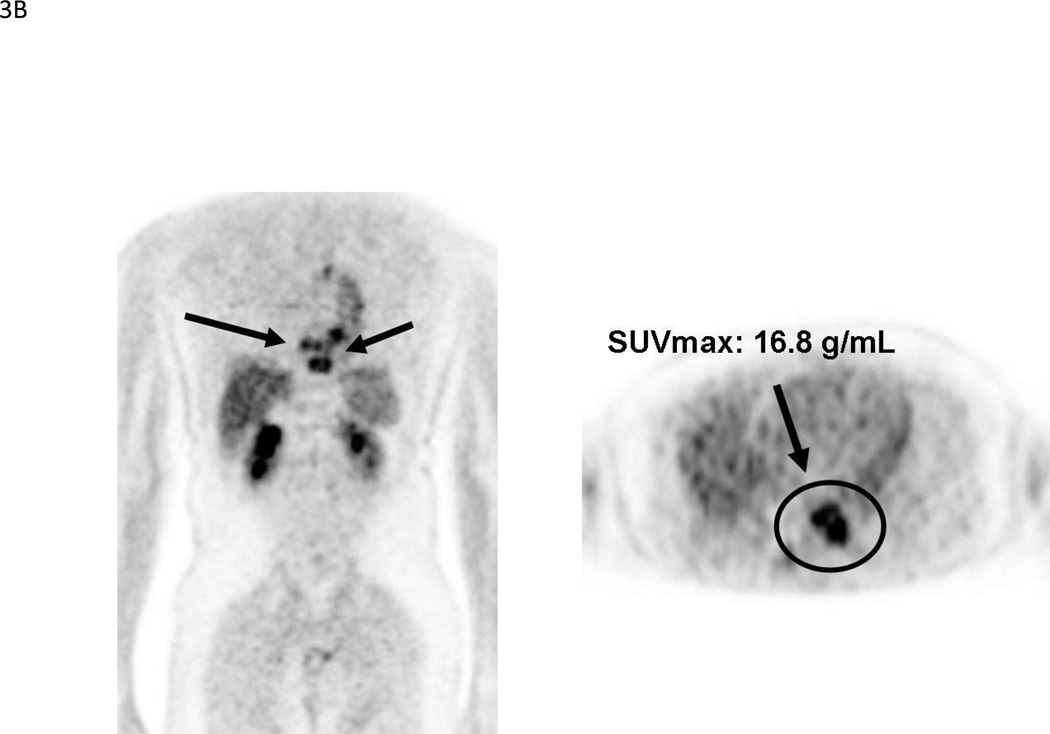
Despite the apparent advantage of NaF-PET over single photon bone scanning, it remains an indirect method of imaging bone metastases. FDG, on the other hand, has the benefit of directly assessing tumor metabolism, and is useful for both bone lesions and soft tissue lesions. These characteristics raise the possibility of developing a “response” biomarker that occurs earlier than TTP or OS, without sacrificing the emphasis on bone metastases. This in turn could lead to shorter approval times for novel CRPC therapies. Initial studies of FDG-PET in prostate cancer examined heterogeneous patient populations [43, 44]. The less-than-favorable results highlighted the need to study patient populations controlled for clinical state, disease progression, therapy, scanning algorithm and clinical endpoints. Subsequent studies adhering to this approach have suggested a role for FDG-PET as an outcome measure in CRPC [45, 46]. With respect to the context of prognosis, one study [29] found an inverse relationship between FDG-PET SUVmax and survival of CRPC patients (median survival 14.4 vs. 32.8 months if SUVmax >6.10 vs. ≤6.10, p = 0.002) (Figure 3). A combination of SUVmax and a nomogram for progressive prostate cancer dichotomized patients into a high versus low risk group (median survival 14.4 vs. 34.6 months, p = .015) that was more prognostic than either alone. In this same study, of 105 FDG-positive bone lesions that were negative on bone scan, 84 (80%) lesions eventually turned positive on follow-up bone scan, indicating that FDG-PET bone findings are clinically relevant. A similar inverse relationship with survival was also shown for BSI (14.7 vs. 28.2 months if BSI >1.27 vs. <1.27; p = 0.004); however, only SUVmax was an independent factor in multivariate analysis.
Figure 3.
(A). Kaplan-Meier survival curves for 22 patients with low (≤6.10) and 21 patients with high (>6.10) SUVmax, p = 0.002. Reprinted with permission from Meirelles et al. [29]. (B). 69-year-old male with CRPC. MIP and axial images shows markedly FDG-avid bone lesions in the thoracic spine, SUVmax 16.8. The patient died within 18 months after the scan.
Paralleling the approach to develop the BSI, our group evaluated a single quantitative measure of tumor burden on PET, termed the SUVmax-avg, which is an average of the 5 lesions (bone, lymph node or soft tissue) with the highest SUVmax. We showed the value of SUVmax-avg as a prognostic factor for survival and treatment response [46, 47]. Nevertheless, while a RECIST-like target lesion analysis has merit, it is feasible and perhaps desirable to perform a total lesion analysis that better estimates the true tumor burden and has potential for capturing inter-lesional heterogeneity. This daunting task could be mitigated by semi-automated applications of acquisitions and for interpretation that are now in clinical testing. PET VCAR (Volume Computer Assisted Reading) is one such program that was co-developed by Larson and colleagues in collaboration with GE Healthcare Systems. PET-VCAR is based on the fiduciary marker of the skeleton [48], a count-based edge recognition program [49], and introduction of novel parameters to associate with clinical outcomes (total lesion glycolysis or gross metabolic volume) [50]. The application bookmarks regions of interest and propagates them from one time point to another, improving analysis and workflow. These features, in addition to accelerating the interpretation process, may also increase inter and intra observer agreement in assessment of lesions. The ability to compare two separate PET tracers with high precision and accuracy is particularly relevant to drug development in CRPC, where probing of the AR signaling axis is likely to require a multi-tracer strategy.
Imaging the Androgen Receptor Signaling Axis
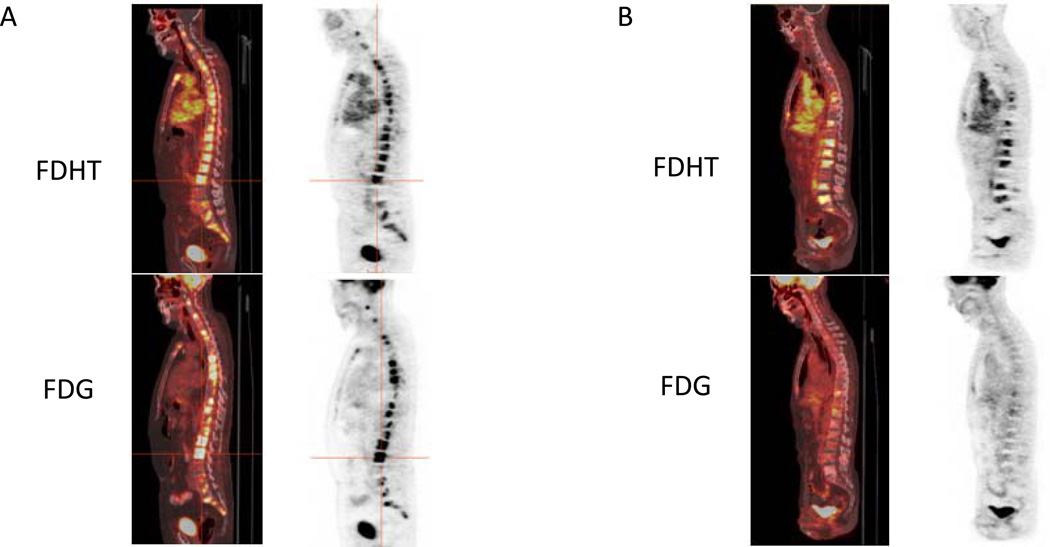
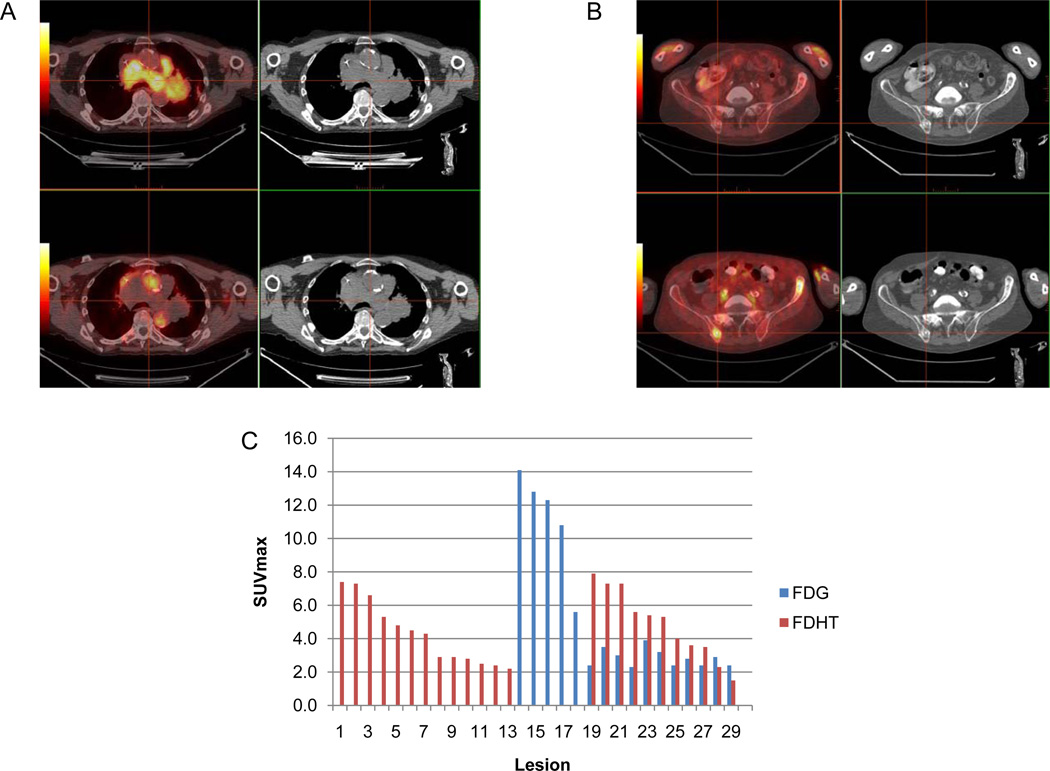
FDHT is an analog of the primary ligand of AR, dihydrotestosterone (DHT), and is thus a rational candidate for imaging of the AR [51]. The feasibility of FDHT-PET imaging in CRPC patients and displacement of FDHT by antiandrogens are already established [52,53]. Quantitative kinetic models of FDHT uptake as a measure of AR expression in human tumors, in vivo, were recently elucidated [54]. These studies were the foundation for FDHT-PET as a vital component of broader AR imaging strategies in CRPC; however, continued investigation is needed to further determine its optimal context of use. As a step towards this goal, we have studied more than 100 CRPC patients with baseline FDHT-PET and FDG-PET assessments prior to entry into clinical trials, and the majority of these patients have undergone early and late post-treatment scans. Facilitated by the PET-VCAR software, this imaging strategy has suggested diverse metabolic phenotypes of CRPC on both a patient and lesional basis, which we prefer to classify as either “AR Predominant”, “Glycolysis Predominant” or “AR/Glycolysis Concordant” [55] (Figures 4 and 5). This classification scheme may have prognostic and treatment predictive implications, as associations with specific molecular determinants in the tumor itself are being explored.
Figure 4.
(A). CRPC patient with multiple osteoblastic metastases. Sagittal fused PET/CT and PET images (FDG top row, FDHT bottom row) demonstrate prominent FDG and FDHT uptake, consistent with a “Glycolysis/AR Concordant” phenotype. (B). Second CRPC patient with multiple osteoblastic metastases. Sagittal fused PET/CT and PET images (FDG top row, FDHT bottom row) demonstrate intense FDHT uptake and relatively low level FDG uptake, consistent with an “AR Predominant” phenotype.
Figure 5.
(A) Axial fused PET/CT and CT images show an example of a discordantly positive nodal mass on 18F-FDG (top, crosshairs), negative on 18F-FDHT (bottom). (B) In the same patient, axial images show an example of a discordantly positive bone lesion on 18F-FDHT (bottom, crosshairs), negative on 18F-FDG (top). (C) VCAR derived bar graph of total lesional SUVmax for the same patient demonstrating substantial heterogeneity in lesion avidity.
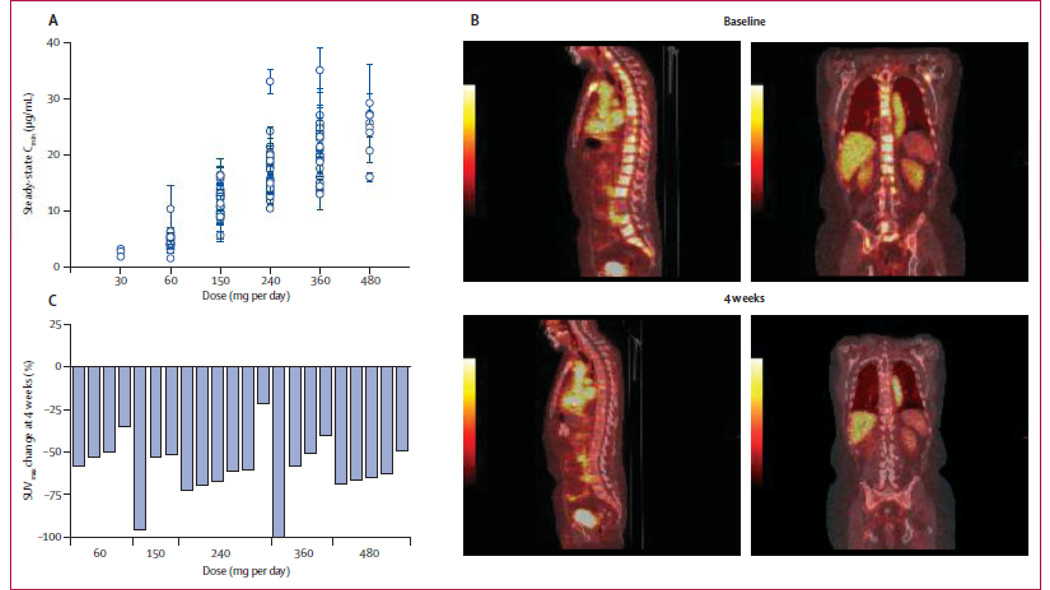
One specific context for FDHT-PET was its use as a pharmacodynamic response indicator in the phase 1 trial of the next generation anti-androgen MDV3100 [5]. The study demonstrated antitumor effects in patients with CRPC, with PSA declines by ≥50% in 56%, soft tissue regression in 22%, bone disease stabilization in 56%, and conversion from unfavorable to favorable circulating tumor cell counts in 49% of patients. The pharmacodynamics of MDV3100 was evaluated by measuring the change in FDHT uptake after start of treatment (displacement) in a subset (n = 22) of patients receiving dosages ranging from 60 mg to 480 mg per day. A clear reduction in FDHT uptake was seen in all patients (20–100%), with some indication that those receiving lower dosages had a smaller reduction (mean decrease <50%) than those receiving dosages in the higher range (mean decrease ≥50%). No appreciable difference in FDHT uptake was seen in the higher dose range, despite substantial differences in serum levels of MDV3100. This suggests that the maximal effect of the drug may be reached before reaching the maximum tolerated dose (Figure 6). Based on the findings of this pilot study, FDHT-PET appears useful as a pharmacodynamic marker in discrete contexts. Further optimization of the imaging with a form of background correction is ongoing. Interestingly, these same 22 patients also underwent FDG-PET scans to assess tumor glycolysis. Modulation of tumor glycolytic rate was evidenced by reductions in FDG metabolism with declines of SUVmax-avg of 25% or more in 45% of cases. The fact that the across-the-board reduction of FDHT uptake did not parallel the FDG-PET response seems consistent with FDHT-PET as a pharmacodynamic marker, as opposed to a response indicator. Nevertheless, it is possible that FDHT-PET may prove to be a response-indicator in other settings. For instance, with drugs that decrease androgen synthesis (e.g. CYP17 inhibitors), but do not directly target the AR, a reduction of FDHT uptake may signal a true cytostatic or cytotoxic response.
Figure 6.
Pharmacodynamics of MDV3100. (A) Sagittal fused PET/CT and PET images 1 h after administration of FDHT at baseline and 4 weeks after start of MDV3100 therapy show a reduction in FDHT accumulation in tumor within the vertebrae, compared with the cardiac and aortic blood pool, in which FDHT metabolites circulate bound to serum proteins. (B) Percentage change in FDHT average maximum standard uptake value (SUVmax) from baseline to 4 weeks by dose. At baseline, all 22 patients had at least one FDHT-avid lesion that could serve as index lesions: 17 patients had five index lesions, three had three index lesions, and two had one index lesion. At baseline, the median FDHT SUVmax average was 7.81 (IQR 4.9–9.6). Reprinted with permission and modification from Scher et al. [5].
While changes in FDHT uptake do reflect AR ligand-receptor interaction, there remains a disconnect between the detection of AR occupancy and the effects of the drug on downstream AR signaling. An investigational agent, 89Zr-J591 [56], is hypothesized to distinguish between these two entities. J591 is an antibody that binds to an external epitope on prostate specific membrane antigen (PSMA) that has been studied extensively for both imaging and radioimmunotherapy purposes [57]. Androgen deprivation has been shown to upregulate PSMA expression. As such, changes in PSMA expression detected by 89Zr-J591 are proposed to reflect the downstream effects of AR inhibition [58,59]. 89Zr-J591 and similar downstream imaging agents will hopefully improve our understanding of the biology of CRPC and its escape mechanisms. If successful, these non-invasive AR probes, in tandem, will give us the capacity to discern four key aspects of targeted therapy: the presence of the target, the ability of the drug to localize to the target, the ability of the drug to inhibit downstream target effects, and the ability of the drug to modulate tumor viability.
CONCLUSION
Recent advances in the understanding of prostate cancer biology have lead to the development of much needed experimental therapies for CRPC with proven efficacy, several of which target the AR signaling axis. Qualified imaging biomarkers are sorely needed to facilitate the continued development and approval of these drugs. The bone-tropic nature of metastatic CRPC justifies the emphasis on rigorously standardized bone scanning as the gatekeeper through which more potent and versatile imaging biomarkers are co-developed. In concert with the metabolic information derived from FDG, molecular imaging of the AR signaling axis promises to reveal important insights into CRPC that will, hopefully, result in improved patient outcomes.
Acknowledgements
Support for this work came from: Department of Defense grant PC071610, ICMIC grant P50 CA086438-08, and the Memorial Sloan-Kettering Cancer Center Specialized Program of Research Excellence (SPORE) Grant in Prostate Cancer (P50 CA92629).
Footnotes
Declaration of interest: The authors report no conflicts of interest. The authors alone are responsible for the content and writing of the paper.
References
- 1.Cancer. org [internet]. American Cancer Society. 2011 Available from: http://www.cancer.org/Cancer/ProstateCancer/DetailedGuide/prostate-cancer-key-statistics.
- 2.Scher H. Prostate carcinoma: Defining therapeutic objectives and improving overall outcomes. Cancer Suppl. 2003;97:758–771. doi: 10.1002/cncr.11151. [DOI] [PubMed] [Google Scholar]
- 3.Chen CD, Welsbie DS, Tran C, Baek SH, Chen R, Vessella R, et al. Molecular determinants of resistance to antiandrogen therapy. Nat Med. 2004;10:33–39. doi: 10.1038/nm972. [DOI] [PubMed] [Google Scholar]
- 4.Chen Y, Sawyers CL, Scher HI. Targeting the androgen receptor pathway in prostate cancer. Curr Opin Pharmacol. 2008;8:440–448. doi: 10.1016/j.coph.2008.07.005. [DOI] [PMC free article] [PubMed] [Google Scholar]
- 5.Scher HI, Beer TM, Higano CS, Anand A, Taplin ME, Efstathiou E, et al. Antitumour activity of MDV3100 in castration-resistant prostate cancer: A phase 1–2 study. Lancet. 2010;375:1437–1446. doi: 10.1016/S0140-6736(10)60172-9. [DOI] [PMC free article] [PubMed] [Google Scholar]
- 6.Danila DC, Morris MJ, de Bono JS, Ryan CJ, Denmeade SR, Smith MR, et al. Phase II multicenter study of abiraterone acetate plus prednisone therapy in patients with docetaxel-treated castration-resistant prostate cancer. J Clin Oncol. 2010;28:1496–1501. doi: 10.1200/JCO.2009.25.9259. [DOI] [PMC free article] [PubMed] [Google Scholar]
- 7.Reid AH, Attard G, Danila DC, Oommen NB, Olmos D, Fong PC, et al. Significant and sustained antitumor activity in post-docetaxel, castration-resistant prostate cancer with the CYP17 inhibitor abiraterone acetate. J Clin Oncol. 2010;28:1489–1495. doi: 10.1200/JCO.2009.24.6819. [DOI] [PMC free article] [PubMed] [Google Scholar]
- 8.Scher HI, Heller G. Clinical states in prostate cancer: Toward a dynamic model of disease progression. Urology. 2000;55:323–327. doi: 10.1016/s0090-4295(99)00471-9. [DOI] [PubMed] [Google Scholar]
- 9.Feldman BJ, Feldman D. The development of androgen-independent prostate cancer. Nat Rev Cancer. 2001;1:34–45. doi: 10.1038/35094009. [DOI] [PubMed] [Google Scholar]
- 10.Atkinson AJ, Jr, Colburn WA, DeGruttola VG, DeMets DL, Downing GJ, Hoth DF, et al. Biomarkers Definitions Working Group. Biomarkers and surrogate endpoints: Preferred definitions and conceptual framework. Clin Pharmacol Ther. 2001;69:89–95. doi: 10.1067/mcp.2001.113989. [DOI] [PubMed] [Google Scholar]
- 11.Goodsaid FM, Frueh FW, Mattes W. Strategic paths for biomarker qualification. Toxicology. 2008;245:219–223. doi: 10.1016/j.tox.2007.12.023. [DOI] [PubMed] [Google Scholar]
- 12.Wagner JA, Williams SA, Webster CJ. Biomarkers and surrogate end points for fit-for-purpose development and regulatory evaluation of new drugs. Clin Pharmacol Ther. 2007;81:104–107. doi: 10.1038/sj.clpt.6100017. [DOI] [PubMed] [Google Scholar]
- 13.Prentice RL. Surrogate and mediating endpoints: Current status and future directions. J Natl Cancer Inst. 2009;101:216–217. doi: 10.1093/jnci/djn515. [DOI] [PubMed] [Google Scholar]
- 14.WHO handbook for reporting results of cancer treatment. Geneva: World Health Organization Offset Publication; 1979. [Google Scholar]
- 15.Therasse P, Arbuck SG, Eisenhauer EA, Wanders J, Kaplan RS, Rubinstein L, et al. New guidelines to evaluate the response to treatment in solid tumors. J Nat Cancer Inst. 2000;92:205–216. doi: 10.1093/jnci/92.3.205. [DOI] [PubMed] [Google Scholar]
- 16.Scher HI, Morris MJ, Kelly WK, Schwartz LH, Heller G. Prostate cancer clinical trial end points:“RECIST”ing a step backwards. Clin Cancer Res. 2005;11(14):5223–5232. doi: 10.1158/1078-0432.CCR-05-0109. [DOI] [PMC free article] [PubMed] [Google Scholar]
- 17.Khleif SN, Doroshow JH, Hait WN. AACR-FDA-NCI Cancer Biomarkers Collaborative consensus report: Advancing the use of biomarkers in cancer drug development. Clin Cancer Res. 2010;16:3299–3318. doi: 10.1158/1078-0432.CCR-10-0880. [DOI] [PubMed] [Google Scholar]
- 18.Morris MJ, Basch EM, Wilding G, Hussain M, Carducci MA, Higano C, et al. Department of Defense prostate cancer clinical trials consortium: A new instrument for prostate cancer clinical research. Clin Genitourin Cancer. 2009;7:51–57. doi: 10.3816/CGC.2009.n.009. [DOI] [PMC free article] [PubMed] [Google Scholar]
- 19.Scher HI, Halabi S, Tannock I, Morris M, Sternberg CN, Carducci MA, et al. Design and end points of clinical trials for patients with progressive prostate cancer and castrate levels of testosterone: Recommendations of the Prostate Cancer Clinical Trials Working Group. J Clin Oncol. 2008;26:1148–1159. doi: 10.1200/JCO.2007.12.4487. [DOI] [PMC free article] [PubMed] [Google Scholar]
- 20.Bubendorf L, Schopfer A, Wagner U, Sauter G, Moch H, Wili N, et al. Metastatic patterns of prostate cancer: An autopsy study of 1589 patients. Hum Path. 2000;31:578–583. doi: 10.1053/hp.2000.6698. [DOI] [PubMed] [Google Scholar]
- 21.Carlin BI, Andriole GL. The natural history, skeletal complications and management of bone metastases in patients with prostate carcinoma. Cancer. 2000;88:2989–2994. doi: 10.1002/1097-0142(20000615)88:12+<2989::aid-cncr14>3.3.co;2-h. [DOI] [PubMed] [Google Scholar]
- 22.Mulders PF, Schalken JA. Measuring therapeutic efficacy in the changing paradigm of castrate-resistant prostate cancer. Prostate Cancer Prostatic Dis. 2009;12:241–246. doi: 10.1038/pcan.2009.25. [DOI] [PubMed] [Google Scholar]
- 23.Evans TC. Two cases of cancer of prostate with bony metastases. Proc R Soc Med. 1929;22:1383–1386. [PMC free article] [PubMed] [Google Scholar]
- 24.Levenson RM, Sauerbrunn BJ, Bates HR, Newman RD, Eddy JL, Ihde DC. Comparative value of bone scintigraphy and radiography in monitoring tumour response in systemically treated prostatic carcinoma. Radiology. 1983;146:513–518. doi: 10.1148/radiology.146.2.6294738. [DOI] [PubMed] [Google Scholar]
- 25.Subramanian G, McAfee JG. A new complex of 99mTc for skeletal imaging. Radiology. 1971;99:192–196. doi: 10.1148/99.1.192. [DOI] [PubMed] [Google Scholar]
- 26.Pollen JJ, Witztum KF, Ashburn WL. The flare phenomenon on radionuclide bone scan in metastatic prostate cancer. Am J Roentgenol. 1984;142:773–776. doi: 10.2214/ajr.142.4.773. [DOI] [PubMed] [Google Scholar]
- 27.Imbriaco M, Larson SM, Yeung HW, Mawlawi OR, Erdi Y, Venkatraman ES, et al. A new parameter for measuring metastatic bone involvement by prostate cancer: The bone scan index. Clin Cancer Res. 1998;4:1765–1772. [PubMed] [Google Scholar]
- 28.Sabbatini P, Larson SM, Kremer A, Zhang ZF, Sun M, Yeung H. Prognostic significance of extent of disease in bone in patients with androgen-independent prostate cancer. J Clin Oncol. 1999;17:948–957. doi: 10.1200/JCO.1999.17.3.948. [DOI] [PubMed] [Google Scholar]
- 29.Meirelles GS, Schoder H, Ravizzini GC, Gonen M, Fox JJ, Humm J, et al. Prognostic value of baseline [18F] fluorodeoxyglucose positron emission tomography and 99mTc-MDP bone scan in progressing metastatic prostate cancer. Clin Cancer Res. 2010;16(24):6039–6039. doi: 10.1158/1078-0432.CCR-10-1357. [DOI] [PMC free article] [PubMed] [Google Scholar]
- 30.Erdi YE, Humm JL, Imbriaco M, Yeung H, Larson SM. Quantitative bone metastases analysis based on image segmentation. J Nucl Med. 1997;38:1401–1406. [PubMed] [Google Scholar]
- 31.Sadik M, Hamadeh I, Nordblom P, Suurkula M, Hoglund P, Ohlsson M, Edenbrandt L. Computer-assisted interpretation of planar whole-body bone scans. J Nucl Med. 2008;49:1958–1965. doi: 10.2967/jnumed.108.055061. [DOI] [PubMed] [Google Scholar]
- 32.Sadik M, Suurkula M, Höglund P, Järund A, Edenbrandt L. Improved classifications of planar whole-body bone scans using a computer-assisted diagnosis system: A multicenter, multiple-reader, multiple-case study. J Nucl Med. 2009;50:368–375. doi: 10.2967/jnumed.108.058883. [DOI] [PubMed] [Google Scholar]
- 33.Costelloe CM, Chuang HH, Madewell JE, Ueno NT. Cancer response criteria and bone metastases: RECIST 1. 1, MDA and PERCIST. J Cancer. 2010;1:80–92. doi: 10.7150/jca.1.80. [DOI] [PMC free article] [PubMed] [Google Scholar]
- 34.Wahl RL, Jacene H, Kasamon Y, Lodge MA. From RECIST to PERCIST: Evolving considerations for PET response criteria in solid tumors. J Nucl Med. 2009;50(Suppl 1):S122–S150. doi: 10.2967/jnumed.108.057307. [DOI] [PMC free article] [PubMed] [Google Scholar]
- 35.Eisenhauer EA, Therasse P, Bogaerts J, Schwartz LH, Sargent D, Ford R, et al. New response evaluation criteria in solid tumours: Revised RECIST guideline (version 1.1) Eur J Cancer. 2009;45:228–247. doi: 10.1016/j.ejca.2008.10.026. [DOI] [PubMed] [Google Scholar]
- 36.Apolo A, Pandit-Taskar N, Morris MJ. Novel tracers and their development for the imaging of metastatic prostate cancer. J Nucl Med. 2008;49:2031–2041. doi: 10.2967/jnumed.108.050658. [DOI] [PMC free article] [PubMed] [Google Scholar]
- 37.Vander Heiden MG, Cantley LC, Thompson CB. Understanding the Warburg effect: The metabolic requirements of cell proliferation. Science. 2009;324:1029–1033. doi: 10.1126/science.1160809. [DOI] [PMC free article] [PubMed] [Google Scholar]
- 38.Kelloff GJ, Hoffman JM, Johnson B, Scher HI, Siegel BA, Cheng EY, et al. Progress and promise of FDG-PET imaging for cancer patient management and oncologic drug development. Clin Cancer Res. 2005;11:2785–2808. doi: 10.1158/1078-0432.CCR-04-2626. [DOI] [PubMed] [Google Scholar]
- 39.Shankar LK, Hoffman JM, Bacharach S, et al. Guidelines for the use of 18F-FDG PET as an indicator of therapeutic response in patients in National Cancer Institute trials. J Nucl Med. 2006;47:1059–1066. [PubMed] [Google Scholar]
- 40.Larson SM, Schwartz LH. 18F-FDG PET as a candidate for “qualified biomarker”: Functional assessment of treatment response in oncology. J Nucl Med. 2006;47:901–903. [PubMed] [Google Scholar]
- 41.Blau M, Nagler W, Bender MA. Fluorine-18: A new isotope for bone scanning. J Nucl Med. 1962;3:332–334. [PubMed] [Google Scholar]
- 42.Even-Sapir E, Metser U, Mishani E, Mishani E, Lievshitz G, Lerman H, et al. The detection of bone metastases in patients with high risk prostate cancer: 99mTc-MDP planar bone scintigraphy, single, and multifield of view SPECT 18F-fluoride PET and 18F-fluoride PET/CT. J Nuc Med. 2006;47:287–297. [PubMed] [Google Scholar]
- 43.Yeh SD, Imbriaco M, Larson SM, Garza D, Zhang JJ, Kalaigian H, et al. Detection of bony metastases of androgen-independent prostate cancer by PET-FDG. Nucl Med Biol. 1996;23:693–697. doi: 10.1016/0969-8051(96)00044-3. [DOI] [PubMed] [Google Scholar]
- 44.Shreve PD, Grossman HB, Gross MD, Wahl RL. Metastatic prostate cancer: Initial findings of PET with 2-deoxy-2-[F-18]fluoro-D-glucose. Radiology. 1996;199:751–756. doi: 10.1148/radiology.199.3.8638000. [DOI] [PubMed] [Google Scholar]
- 45.Morris MJ, Akhurst T, Osman I, Nunez R, Macapinlac H, Siedlecki K, et al. Fluorinated deoxyglucose positron emission tomography imaging in progressive metastatic prostate cancer. Urology. 2002;59:913–918. doi: 10.1016/s0090-4295(02)01509-1. [DOI] [PubMed] [Google Scholar]
- 46.Morris MJ, Akhurst T, Larson SM, Ditullio M, Chu E, Siedlecki K, et al. Fluorodeoxyglucose positron emission tomography as an outcome measure for castrate metastatic prostate cancer treated with antimicrotubule chemotherapy. Clin Cancer Res. 2005;11:3210–3216. doi: 10.1158/1078-0432.CCR-04-2034. [DOI] [PMC free article] [PubMed] [Google Scholar]
- 47.Morris MJ, Fox JJ, Dennis ER, Tse K, Stephenson RD, Flatts E, et al. Pretreatment fluorodeoxyglucose (FDG) PET and survival for castration-resistant metastatic prostate cancer (CRMPC). 2010 Genitourinary Cancers Symposium; March 5–7, 2010. San Francisco, CA. Abstract 108. [Google Scholar]
- 48.Erdi YE, Srivastava NC, Humm JL, Larson SM. A coordinate system for tumor identification in positron emission tomography (PET) imaging. Clin Positron Imaging. 2000;3:131–136. doi: 10.1016/s1095-0397(00)00054-6. [DOI] [PubMed] [Google Scholar]
- 49.Erdi YE, Mawlawi O, Larson SM, Imbriaco M, Yeung H, Finn R, et al. Segmentation of lung lesion volume by adaptive positron emission tomography image thresholding. Cancer. 1997;80:2505–2509. doi: 10.1002/(sici)1097-0142(19971215)80:12+<2505::aid-cncr24>3.3.co;2-b. [DOI] [PubMed] [Google Scholar]
- 50.Larson SM, Erdi Y, Akhurst T, Mazumdar M, Macapinlac HA, Finn RD, Casilla C, et al. Tumor treatment response based on visual and quantitative changes in global tumor glycolysis using PET-FDG imaging: The visual response score and the change in the total lesion glycolysis. Clin Positron Imaging. 1999;3:159–171. doi: 10.1016/s1095-0397(99)00016-3. [DOI] [PubMed] [Google Scholar]
- 51.Liu A, Dence CS, Welch MJ, Katzenellenbogen JA. Fluorine-18-labeled androgens: Radiochemical synthesis and tissue distribution studies on six fluorine-substituted androgens, potential imaging agents for prostatic cancer. J Nucl Med. 1992;33:724–734. [PubMed] [Google Scholar]
- 52.Larson SM, Morris M, Gunther I, Beattie B, Humm JL, Akhurst TA, et al. Tumor localization of 16beta-18F-fluoro-5alpha-dihydrotestosterone versus 18F-FDG in patients with progressive, metastatic prostate cancer. J Nucl Med. 2004;45:366–373. [PubMed] [Google Scholar]
- 53.Dehdashti F, Picus J, Michalski JM, Dence CS, Siegel BA, Katzenellenbogen JA, et al. Positron tomographic assessment of androgen receptors in prostatic carcinoma. Eur J Nucl Med Mol Imaging. 2005;32:344–350. doi: 10.1007/s00259-005-1764-5. [DOI] [PubMed] [Google Scholar]
- 54.Beattie BJ, Smith-Jones PM, Jhanwar YS, Schoder H, Schmidtlein CR, Morris MJ, et al. Pharmacokinetic assessment of the uptake of 16beta-18F-fluoro-5alpha-dihydrotestosterone (FDHT) in prostate tumors as measured by PET. J Nucl Med. 2010;51:183–192. doi: 10.2967/jnumed.109.066159. [DOI] [PMC free article] [PubMed] [Google Scholar]
- 55.Fox J, Blanc E, Schoder H, Morris M, Scher H, Larson S, Humm J, Cai S. Diversity of biology in castrate resistant prostate cancer. J Nucl Med. 2009;50(Suppl 2):523. [Google Scholar]
- 56.Holland JP, Divilov V, Bander NH, Smith-Jones PM, Larson SM, Lewis JS. 89Zr-DFO-J591 for immunoPET of prostate-specific membrane antigen expression in vivo. J Nucl Med. 2010;51(8):1293–1300. doi: 10.2967/jnumed.110.076174. [DOI] [PMC free article] [PubMed] [Google Scholar]
- 57.Pandit-Taskar N, O’Donoghue JA, Morris MJ, Wills EA, Schwartz LH, Gonen M, et al. Antibody mass escalation study in patients with castration-resistant prostate cancer using 111In-J591: Lesion detectability and dosimetric projections for 90Y radioimmunotherapy. J Nucl Med. 2008;49:1066–1074. doi: 10.2967/jnumed.107.049502. [DOI] [PMC free article] [PubMed] [Google Scholar]
- 58.Wright GL, Jr, Grob BM, Haley C, Grossman K, Newhall K, Petrylak D, et al. Upregulation of prostate-specific membrane antigen after androgen-deprivation therapy. Urology. 1996;48:326–334. doi: 10.1016/s0090-4295(96)00184-7. [DOI] [PubMed] [Google Scholar]
- 59.Kuroda K, Liu H, Kim S, Guo M, Navarro V, Bander NH. Docetaxel down-regulates the expression of androgen receptor and prostate-specific antigen but not prostate-specific membrane antigen in prostate cancer cell lines: Implications for PSA surrogacy. Prostate. 2009;69:1579–1585. doi: 10.1002/pros.21004. [DOI] [PubMed] [Google Scholar]


