Abstract
Purpose.
Diabetic retinopathy fails to halt after cessation of hyperglycemic insult, and a vicious cycle of mitochondria damage continues. The aim of our study was to investigate the effect of termination of hyperglycemia on retinal mtDNA replication, and elucidate the mechanism responsible for the continued mtDNA damage.
Methods.
Polymerase gamma 1 (POLG1), the catalytic subunit of the mitochondrial DNA replication enzyme, and the damage to the displacement loop region of mtDNA (D-loop) were analyzed in the retina from streptozotocin-diabetic rats maintained in poor glycemic control (PC, glycated hemoglobin ∼11%) or in good glycemic control (GC, glycated hemoglobin ∼6%) for 6 months, or in PC for three months followed by GC for three months (Rev). To understand the mechanism DNA methylation status of POLG1 promoter was investigated by methylation-specific PCR. The key parameters were confirmed in the isolated retinal endothelial cells exposed to high glucose, followed by normal glucose.
Results.
POLG1 continued to be down-regulated, the D-loop region damaged, and the CpG islands at the regulatory region of POLG hyper-methylated even after three months of GC that had followed three months of PC (Rev group). Similar results were observed in the retinal endothelial cells exposed to normal glucose after being exposed to high glucose.
Conclusions.
Continued hypermethylation of the CpG sites at the regulatory region of POLG affects its binding to the mtDNA, compromising the transcriptional activity. Modulation of DNA methylation using pharmaceutic or molecular means could help maintain mitochondria homeostasis, and prevent further progression of diabetic retinopathy.
Diabetes-induced damage to the retinal mtDNA replication system compromises the transcriptional activity and the mitochondria remains dysfunctional even after hyperglycemic insult is terminated, resulting in the continued progression of diabetic retinopathy.
In diabetes, hypermethylation of the CpG sites at the regulatory region of DNA polymerase impairs its binding to the mtDNA, and this results in impaired DNA replication. Termination of hyperglycemic insult fails to provide any benefit to these abnormalities, suggesting their role in the development and in metabolic memory phenomenon associated with the continued progression of diabetic retinopathy.
Introduction
Clinical and experimental studies have demonstrated that hyperglycemia has long-lasting effects on the retina and the damage continues even after termination of the hyperglycemic insult, suggesting a “metabolic memory” phenomenon.1–5 In the early stages of the development of diabetic retinopathy, retinal cells, including endothelial cell and pericytes, undergo accelerated apoptosis, and the apoptosis of capillary cells is considered to serve as a surrogate marker for the appearance of pathology characteristic of diabetic retinopathy.6 Mitochondrial dysfunction has an important role in the apoptosis of retinal capillary cells, and superoxide-induced mitochondrial DNA (mtDNA) damage initiates a vicious cycle of continuous mitochondrial dysfunction.7–10 In addition, the damage to the displacement loop (D-loop) region of the mtDNA, the region that contains essential transcription and replication elements, is more extensive compared to the cytochrome B (CytB) region, and the replication machinery to overcome this damage also becomes subnormal.11 Our studies have documented that the damage to the mitochondria, including their dysfunction, DNA damage, and decrease in copy number, persists after hyperglycemic insult is reversed.8,9,12 However, the role of mtDNA replication machinery in the continued progression of diabetic retinopathy is not explored.
In the pathogenesis of diabetic retinopathy, the gene encoding manganese superoxide dismutase, sod2, undergoes epigenetic-regulation and these modifications fail to reverse after termination of hyperglycemic insult. Methylation of histone-4-lysine-20 (H4K20), and acetylation of histone-3-lysine-9 (H3K9) and p65 subunit of the nuclear transcriptional factor-kB (NF-kB) at the promoter/enhancer of sod2 remain elevated.13 In addition to histone modifications, DNA methylation also is one of the mechanisms for the epigenetic control of gene expression, and aberrant DNA methylation patterns of CpG islands can influence normal transcriptional regulation.14 The enzyme responsible to transfer the methyl group to nuclear DNA, DNA methyl transferase (DNMT), is altered in leukocytes of diabetic patients, and tissue-specific DNA methylation is observed in streptozotocin-induced diabetic rats with hypomethylation in the liver but not the kidney.15,16 Altered DNA methylation at key gene promoters is reported in patients with diabetic nephropathy relative to those without nephropathy, and increased DNA methylation at the promoter of the peroxisome proliferator-activated receptor co-activator 1 gene in the pancreatic islets is considered to have a key role in regulating mitochondrial genes.17 How DNA methylation contributes to the metabolic memory associated with diabetic retinopathy remains to be explored.
DNA replication machinery consists of the catalytic unit, DNA polymerase gamma (POLG1), and a single-stranded DNA binding protein, Twinkle. These enzymes form replisome to bind/unwind and extend mtDNA.18 The aim of our study was to investigate the effect of reinstitution of good glycemic control in rats on the retinal replication enzymes, and on the selective damage at the D-loop region in the metabolic memory phenomenon. To understand the mechanism responsible for continued damage to the replication machinery, DNA methylation status of POLG1 promoter also was investigated. The key parameters were confirmed in the isolated retinal endothelial cells exposed to high glucose, followed by normal glucose, the in vitro model commonly used in our laboratory.9,12
Methods
Rats
Diabetes was induced in the Wistar rats (male 200 g) by streptozotocin (55 mg/kg body weight). Diabetic rats either were allowed to remain in poor glycemic control (PC) or in good glycemic control (GC) for six months, or were maintained in PC for three months, followed by GC for three additional months (Rev). The age-matched normal rats were used as control. The rats in PC received 1 to 2 IU insulin 4 to 5 times a week to avoid weight loss and ketonuria, and those in GC received insulin twice daily (5–7 IU total). These methods are used routinely in our laboratory.8,19 Treatment of rats was performed as per the guidelines of National Institute of Health principals of laboratory animal care, the Association for Research in Vision and Ophthalmology (ARVO) Statement for the Use of Animals in Ophthalmic and Vision Research, and the institutional guidelines.
Retinal Endothelial Cells
Retinal endothelial cells were isolated from bovine retina (BRECs) and were cultured to 80% confluence on polystyrene dishes coated with 0.1% gelatin.10–12 Cells from the passages 5 to 6 were incubated in Dulbecco's modified Eagle medium (DMEM) containing 2% heat inactivated fetal bovine serum (FBS), 10% Nu-serum, 50 μg/mL heparin, 1 μg/mL endothelial growth factor, and antibiotic/anti-mycotic supplemented with 5 or 20 mM glucose. To investigate the effect of termination of high glucose insult, the cells were incubated in 20 mM glucose for four days followed by 5 mM glucose for four additional days (20-5 mM). Cells incubated in continuous 5 or 20 mM glucose served as controls, and those incubated in 20 mM mannitol instead of 20 mM glucose served as osmotic controls.9,12 At the end of the eight days, the cells were trypsinized and used for analysis.
Isolation of Mitochondria
Mitochondria were isolated using the mitochondria isolation kit from Invitrogen (Carlsbad, CA). The pellet containing mitochondrial-rich fraction was washed in PBS and resuspended in the Western lysis buffer. The mitochondria fraction prepared by this method is largely free of nuclear contaminants.8,9,11 Protein concentration was determined by the bicinchoninic acid protein assay (Sigma-Aldrich, St. Louis, MO).
Protein Expression
Mitochondrial protein (30 μg) was separated on a 4% to 16% SDS-PAGE, transferred to a nitrocellulose membrane, and blocked with 5% nonfat milk for 1 hour. The protein expressions of POLG1 and Twinkle were determined using antibodies from Santa Cruz Biotechnology (Santa Cruz, CA). Cytochrome oxidase IV (Cox IV; Molecular Probe, Carlsbad, CA) was used as the loading control. The band intensity of the Western blots was quantified using Un-Scan-It Gel digitizing software (Silk Scientific Inc., Orem, UT). The expression of the protein of interest was normalized to that of Cox IV, and the value for control group in a blot was considered as 100%.
Gene Expression
Total RNA was extracted from the retina or BRECs with Trizol reagent (Invitrogen). RNA (1–2 μg) was used to synthesize cDNA using the high capacity cDNA reverse transcription kit (Applied Biosystem, Foster City, CA). Gene expressions for POLG1 and Twinkle were measured by Sybr green-based real time PCR (qPCR, with melting curve analysis) on ABI 7500 (Applied Biosystems) using their gene-specific primers (see Table), and β-actin served as a housekeeping gene. Quantification of the transcripts was done by ddCt method.11,13,21
DNA Isolation and D-Loop Damage PCR
Total DNA was isolated using blood tissue DNA kit (Qiagen, Valencia, CA), and quantified by the Quant-iT dsDNA assay (Invitrogen). The primers were designed using primer express-3 software and synthesized by Integrated DNA Technologies (Coralville, IA). To evaluate mtDNA damage at the D-loop, conventional PCR was performed and the ratio of semi-long to short PCR amplicons at the D-loop region of mtDNA was calculated (819 base pairs [bp]:148 bp) as we reported recently.11 The PCR products were separated on 2% agarose gel and quantitative analysis was done by measuring the intensity of PCR products in gel photographs using Un-Scan-It Gel digitizing software.8,9,20
Binding of POLG1 with the Replication Site at the D-Loop Region
The binding affinity of POLG1 to its replication start site was assessed by chromatin immunoprecipitation (ChIP) of POLG1 at D-loop of mtDNA. BRECs were cross linked with 1% formaldehyde solution for 10 minutes and ChIP with POLG1 as reported previously.11,13 Briefly, protein extract was pre-cleared with protein A agarose/salmon sperm DNA slurry and pre-cleared protein was incubated with 2 μg of POLG1 antibody (Santa Cruz Biotechnology) overnight at 4°C. The antibody-protein-DNA complex was pulled down by protein A agarose, and washed with low salt, high salt buffer and LiCl buffer, and this was followed by washing twice with TE buffer. After reverse cross linking, DNA was purified by phenol:chloroform:isoamyl alcohol (25:24:1) extraction and ethanol precipitation, and PCR of D-loop region was performed using 1 μL of DNA. The input DNA was used as internal control to calculate the fold changes by ddCt in qPCR method. Normal rabbit IgG was used as negative control, and the yield was less than 10% of the ChIP antibody, as reported previously.11,13
Bisulfite Conversion of DNA and Methylation Specific PCR (MS-PCR)
Since methylation at CpG sites on the promoter of a gene down regulates its transcription, we quantified DNA methylation at the promoter region of POLG1 by bisulfite conversion of the DNA. Bisulfite reaction was performed using EpiTect Plus Lyse All Bisulfite Kit (Qiagen), and after sodium bisulfite conversion, the DNA was applied to an EpiTect spin column and washed to remove traces of sodium bisulfite. The converted DNA was eluted with nuclease-free water. PCR reaction was performed for methylated (M) and un-methylated (U) regions using 2 μL of 5× PCR reaction buffer, 0.2 mM of dNTPs (Promega, Madison, WI), 0.2 μM of each forward and reverse primers, GoTaq DNA polymerase, and 1 μL converted DNA. Thermal cycling conditions included 94°C for 5 minutes, 35 cycles of 94°C for 1 minute, 55°C for 30 seconds, 72°C for 1 minute, and final extension at 72°C for 10 minutes. The PCR products were analyzed on 2% agarose gel, digitized Un-Scan-It Gel digitalizing software, and the intensity of methylated bands to unmethylated bands was quantified.
DNMT Activity
The total DNMT activity was determined in the nuclear fraction using EpiQuik DNMT Activity/Inhibition Assay Ultra Kit (Epigentek, Farmingdale, NY). The nuclear fraction (4 μg), isolated using Nuclear Extract kit (Active Motif, Carlsbad, CA), was incubated with the cytosine-rich DNA substrate stably coated on the plate, and using anti-5-methylcytosine antibody the methylated DNA was quantified spectrophotometrically at 455 nm. The assay was linear from 1 to 10 μg nuclear protein.
Functional Assay of POLG
To evaluate the activity of POLG, the synthesis of new mtDNA strands was quantified using bromodeoxyuridine (BrDU, labels newly synthesized DNA), as reported previously.11 Since mtDNA replication is dependent on POLG1 activity, the method takes advantage of inhibiting the synthesis of nuclear DNA synthesis by a POLG alpha inhibitor (aphidicolin), and then quantifying the incorporation of BrDU (a thymidine analogue that labels newly synthesized DNA), into the mtDNA. BRECs grown on cover slips were incubated with 7 μM aphidicolin (nuclear DNA polymerase inhibitor, Sigma-Aldrich) for 4 hours. At the end of the reaction, fresh medium containing 15 μM BrDU with aphidicolin was added, and the cells were incubated for an additional 6 hours. After washing with PBS, the cells were fixed with 2% paraformaldehyde, permeabilized with 0.1% TritonX-100, and incubated with 2 N HCl for 30 minutes at 37°C to recover the BrDU epitope. The cells were washed 3 times and blocked with PBS containing 5% goat serum and 0.1% Triton X-100, and then incubated overnight at 4°C with mouse anti-BrDU antibody (Sigma-Aldrich). The samples were incubated with Texas Red-conjugated anti-mouse IgG for 1 hour. The cover slips were mounted in mounting media containing 4′6-diamidino-2-phenylindole (DAPI). The fluorescence images were visualized and captured using ZEISS ApoTome fluorescence microscope at 40× objective.
Statistical Analysis
Data are expressed as mean ± SD. Statistical analyses were done using SigmaStat software (12.1; Systat Software, Inc., Chicago, IL). Shapiro-Wilk test were used to test for normal distribution of the data. The data presenting normal distribution were analyzed by ANOVA followed by Bonferroni's test, and for the data that did not present normal distribution (gene expressions of POLG and Twinkle), Kruskal-Wallis test was followed by Dunn's test. P < 0.05 was considered statistically significant.
Results
Rats
Severity of Hyperglycemia.
The average body weight of rats maintained in PC (310 ± 35 g) was significantly lower compared to the rats that were maintained in GC or remained normal for the entire duration of the experiment (510 ± 36 and 523 ± 48 g, respectively). The rats in the Rev group weighed ∼285 ± 18 g during their three months of PC, but their body weight averaged ∼476 ± 21 g after three months of the GC that had followed. Glycated hemoglobin (GHb) values throughout the experiment for the rats in the PC, GC, and normal groups were ∼11%, ∼6%, and ∼5%, respectively. For the rats in the Rev group, GHb value before initiation of GC was similar to that in the PC group (∼11%), but decreased to ∼6% three months after initiation of GC.
Effect of PC on Retinal Replication Machinery.
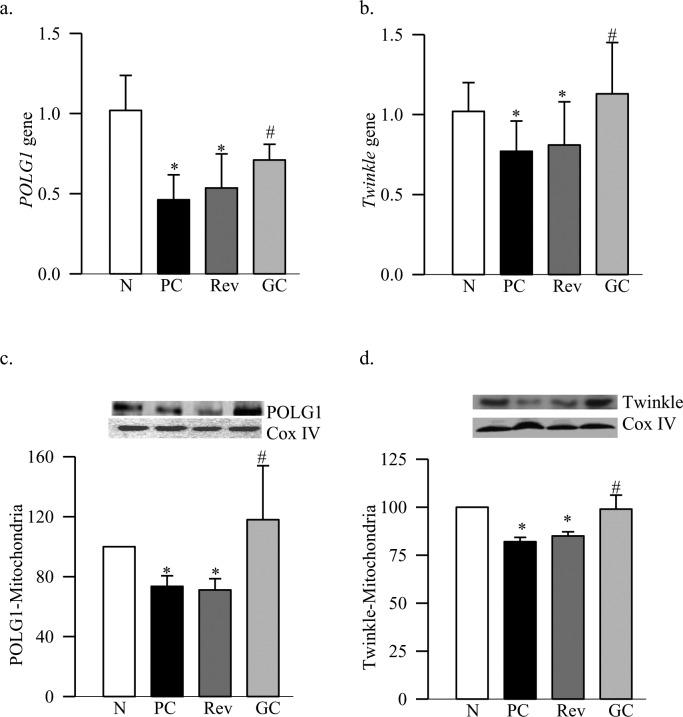
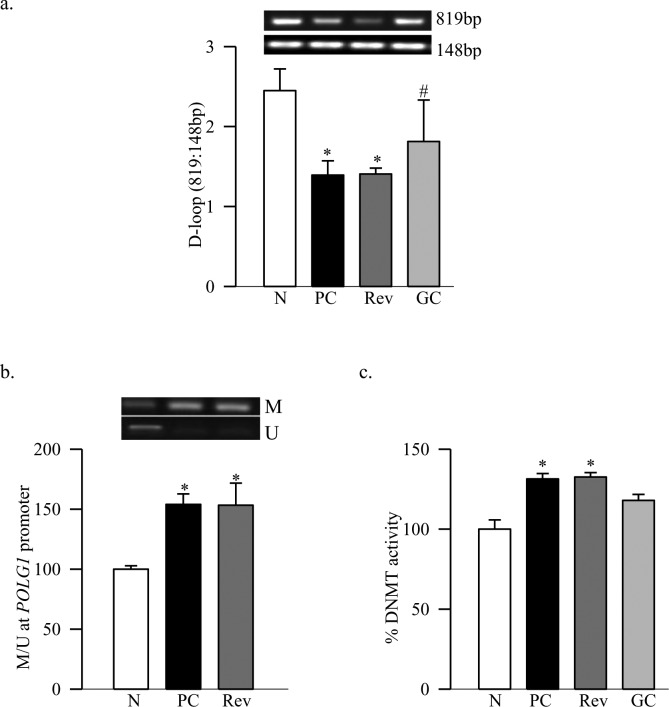
Diabetes decreased the gene transcripts of retinal POLG1 and Twinkle by 35% to 45% respectively, and decreased their mitochondrial accumulation by >20% (Figs. 1a–d). These data are consistent with our results from streptozotocin-induced diabetic mice.11 The amplification ratio of the semi-long PCR amplicon (819 bp) to the short PCR amplicon (148 bp) at the D-loop region of mtDNA was significantly lower in diabetic rats compared to the age-matched normal rats (Fig. 2a), indicating more damage at the D-loop region. To understand the mechanism responsible for decreased POLG1 transcription, DNA methylation at the promoter region of POLG1 was quantified, and our MS-PCR data show that diabetes increased methylation at POLG1 promoter by 45% compared to the values obtained from age-matched normal rats (Fig. 2b). Consistent with the DNA methylation, the enzyme activity of DNMT also was increased significantly (Fig. 2c).
Figure 1. .
Reversal of hyperglycemia and the retinal DNA replication enzymes. The gene transcripts of (a) POLG1 and (b) Twinkle were quantified in the retina by real time PCR using β-actin as the housekeeping gene. Levels of (c) POLG1 and (d) Twinkle were quantified in the retinal mitochondria by Western blot technique, and Cox IV was used as a loading control. The results are mean ± SD of the measurements made in duplicate in 6 to 8 rats in each group. N, normal control. *P < 0.05 compared to normal. #P < 0.05 compared to PC.
Figure 2. .
Termination of hyperglycemia, and D-loop damage and methylation. (a) PCR was performed in retinal DNA using primers designed to amplify one long fragment (819 bp) and one small fragment (148 bp) of the D-loop region. The PCR products were analyzed on an agarose gel and the ratio of the intensity of long band to the short bands plotted in the accompanying histogram. (b) Retinal DNA was subjected to bisulfite modification and purification, and PCR reaction was performed using specific primers for methylated and unmethylated regions. The histogram represents the ratio of the intensities of the methylated (M) and unmethylated (U) bands. (c) The activity of DNMT was measured in the retinal nuclear fraction (4 μg) using EpiQuik DNMT Activity/inhibition Assay Ultra Kit. The assay was linear from 1 to 10 μg of retinal nuclear fraction. The activity obtained in the normal group was considered as 100%. *P < 0.05 compared to normal. #P < 0.05 compared to PC.
Effect of Reversal of Hyperglycemia on Retinal Replication Machinery.
Reinstitution of GC for three months after three months of PC (Rev group) failed to provide any benefit to the replication system; the gene transcripts of POLG1 and Twinkle, and their accumulation in the mitochondria continued to be subnormal (Fig. 1). The D-loop region of the mtDNA remained damaged, the POLG1 promoter significantly hyper-methylated, and DNMT activated (Fig. 2). The values obtained from the rats in the Rev group were significantly different from those obtained from rats in the normal group (P < 0.05), but were not different from those in the PC group (P > 0.05).
However, maintenance of GC immediately after induction of diabetes (GC group) showed significant protection in the mtDNA replication machinery. Gene transcripts, and mitochondrial accumulation of POLG1 and Twinkle remained normal (Fig. 1), and retinal D-loop was protected from the damage (Fig. 2a). DNA methylation at POLG1 promoter region and DNMT activity also were significantly lower compared to the values from the PC or Rev groups (Figs. 2b, 2c).
Retinal Endothelial Cells
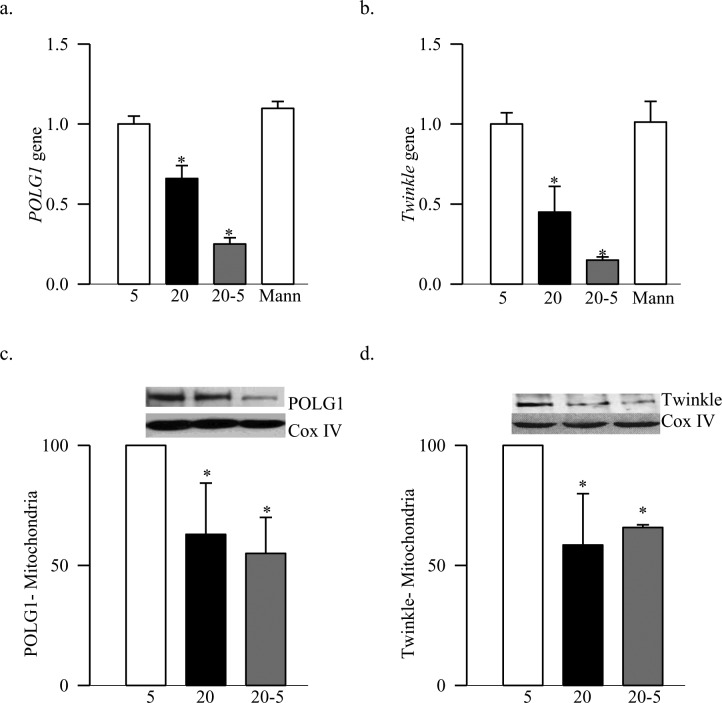
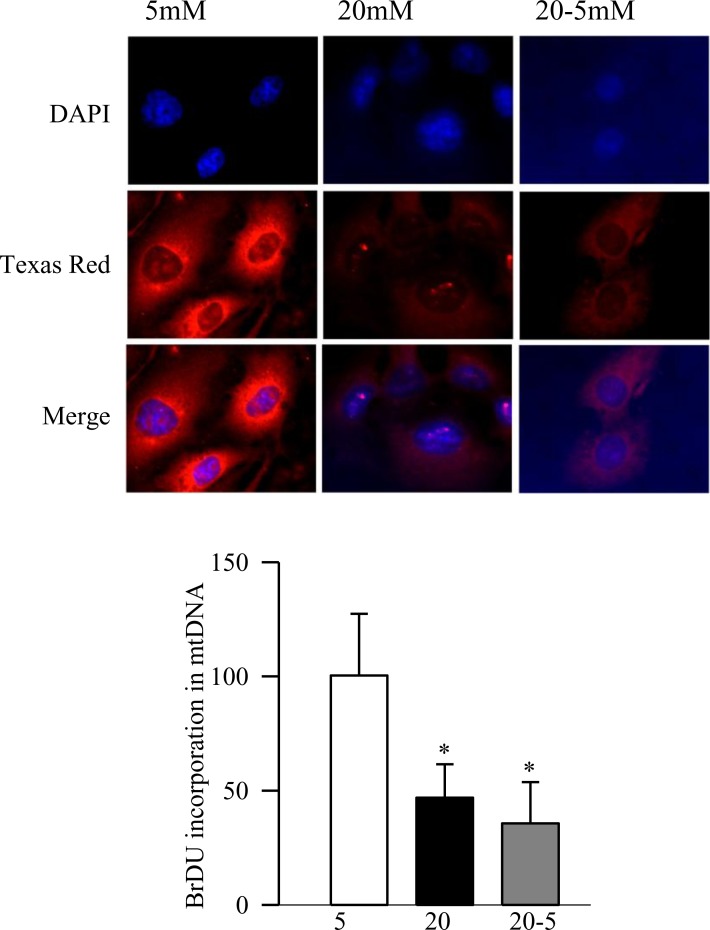
Abnormalities in mtDNA replication machinery, observed in the retina, were confirmed in the retinal endothelial cells, the site of histopathology of retinopathy. As expected, high glucose exposure (20 mM) for 8 days decreased the transcripts of DNA replication enzymes by 35% to 75%, and their mitochondrial accumulation by ∼40% compared to the cells incubated in normal glucose (Figs. 3a–d). Furthermore, the damage at the D-loop region was significantly high and the POLG1 binding to the D-loop was compromised (Figs. 4a, 4b). Consistent with our in vivo results, methylation at POLG1 promoter was increased significantly (Fig. 5) and the activity of POLG was decreased (Fig. 6). Reversal of high glucose insult by normal glucose exposure (20-5 group) did not reverse impairments in the replication machinery; the D-loop damage continued to be elevated and the binding of POLG1 to the D-loop decreased compared to the values obtained from the cells incubated in continuous normal (5 mM) glucose group. Furthermore, POLG1 promoter remained hyper-methylated (Fig. 5), and POLG activity compromised (Fig. 6). However, the values obtained from the cells in the 20-5 group were not statistically different from those obtained from the cells incubated in the continuous high glucose group (P > 0.05).
Figure 3. .
Termination of high glucose insult and DNA replication enzymes in retinal endothelial cells. The gene transcripts of (a) POLG1 and (b) Twinkle were quantified in BRECs by real-time PCR using gene specific primers. β-actin served as the housekeeping gene. Mitochondrial levels of (c) POLG1 and (d) Twinkle were measured by Western blot technique using Cox IV as a loading control. The results represent mean ± SD from 3–5 different cell preparations. 5, cells incubated in continuous 5 mM glucose; 20, cells incubated in continuous 20 mM glucose for 8 days; 20-5, cells incubated in 20 mM for four days followed by 5 mM for four additional days; Mann, cells incubated in 20 mM mannitol for 8 days. *P < 0.05 compared to normal.
Figure 4. .
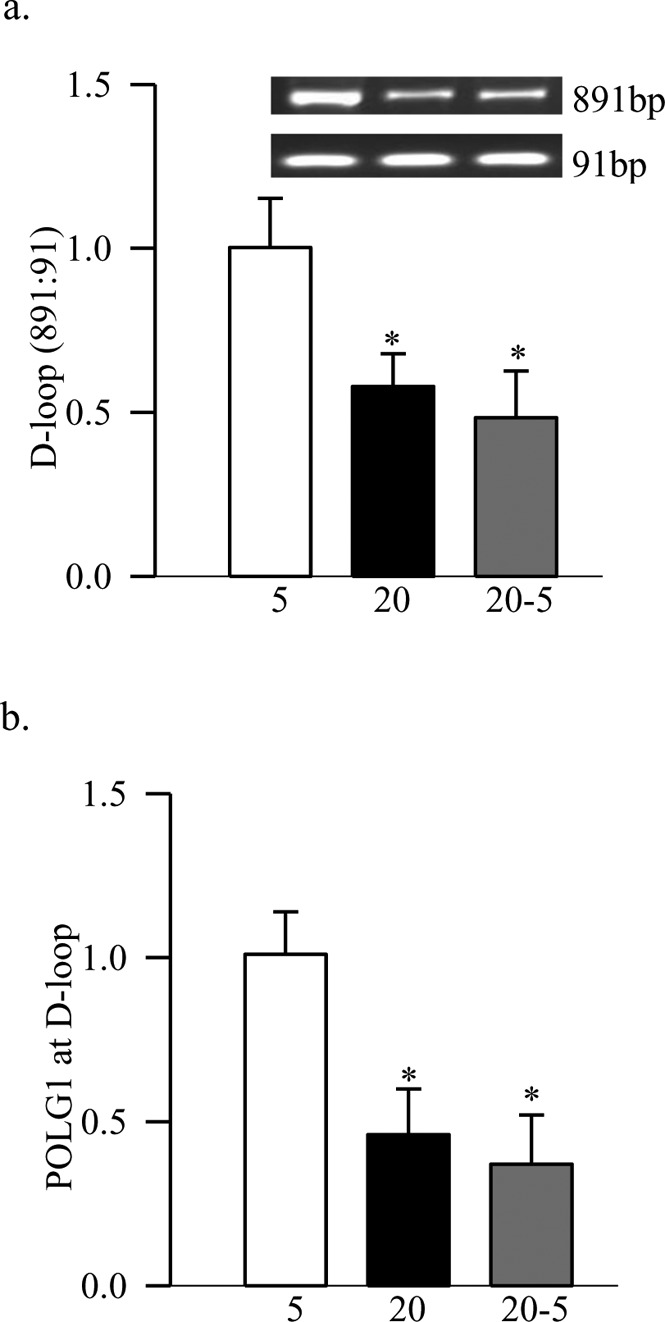
Reversal of high glucose on D-loop damage. (a) The damage to the D-loop region of the mtDNA in BRECs was quantified by relative PCR amplification of the semi-long (891 bp) and short (91 bp) amplicons. (b) Binding of POLG at the D-loop region was assayed by ChIP technique using POLG1 antibody and PCR for D-loop fragment. Normal rabbit IgG was used as negative control and the yield was less than 10% of the ChIP antibody. The values represent mean ± SD of the measurements made in 4 to 5 different cell preparations. *P < 0.05 compared to continuous 5 mM.
Figure 5. .
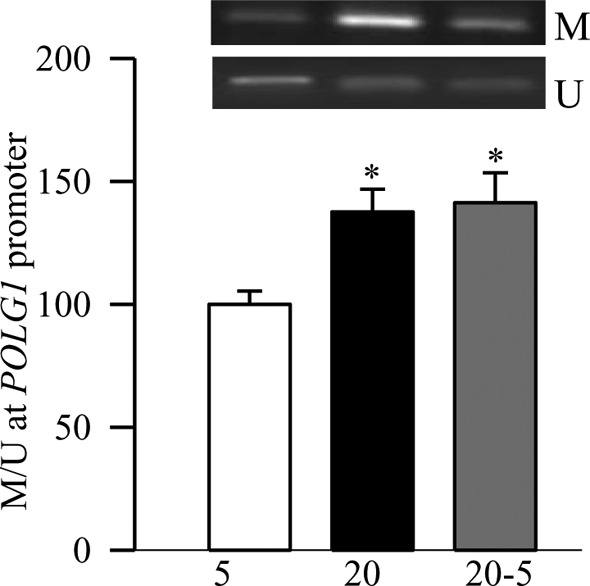
Promoter methylation of POLG1. DNA isolated from the BRECs was subjected to bisulfite modification, and PCR was performed using specific primers for methylated and unmethylated promoter regions. The ratio of the methylated band (M) to the unmethylated band (U), obtained from the cells incubated in continuous 5 mM glucose was considered as 100%. Measurements were made in duplicate in 4 to 6 different cell preparations. *P < 0.05 compared to 5 mM glucose.
Figure 6. .
Reversal of high glucose and functional activity of POLG1. Functional assay for POLG1 was performed immunohistochemically, and the incorporation of BrDU into the mtDNA was quantified using Texas Red-conjugated anti-mouse IgG. The cover slips were mounted in mounting media containing DAPI (blue), and the cells were visualized using ZEISS ApoTome fluorescence microscope at 40× objective. The histogram shows the average intensity from 5 to 7 replicates from the cells incubated with 7 μM aphidicolin. 5 mM or 20 mM, cells incubated in 5 mM or 20 mM glucose, respectively, for eight days; 20-5, cells incubated in 20 mM glucose for four days followed by 5 mM glucose for four additional days. *P < 0.05 compared to 5 mM glucose.
Discussion
The progression of diabetic retinopathy does not halt in diabetic patients and animal models when normal glycemic control is reinstituted after a period of hyperglycemic insult.1–5 The retina continues to experience oxidative stress and mtDNA damage, and biogenesis remains compromised.8,9 Our study showed that three months of GC that has followed three months of PC fails to reverse the damage to the mtDNA replication system caused by the prior PC. The replication enzymes continue to be down-regulated, and the D-loop region of the mtDNA remains damaged. Our exciting data suggested that the possible reason for this damage could be continued hypermethylation of the CpG sites at the regulatory region of POLG, affecting its binding to the mtDNA, and compromising the transcriptional activity. A similar phenomenon also is observed in the retinal endothelial cells exposed to normal glucose after being exposed to high glucose. These results imply strongly that, due to continued hypermethylation of POLG, the mtDNA replication system is impaired, and this continues even after the hyperglycemic insult is terminated, and suggests a role of DNA methylation in the metabolic memory phenomenon associated with the continued progression of diabetic retinopathy.
In the pathogenesis of diabetic retinopathy, mitochondria homeostasis is disrupted, mitochondria copy numbers are decreased and mtDNA is damaged, contributing to the accelerated apoptosis of retinal capillary cells. Our previous work has suggested that continued mtDNA damage and impaired mitochondrial biogenesis are important in the continued progression of diabetic retinopathy.8,9 Diabetes compromises the retinal mtDNA replication system, and the D-loop region of the mtDNA, which has the binding sites for the major factors for mtDNA transcription, and experiences more damage than the CytB region.11 We demonstrated that the mitochondria replication machinery does not benefit from the three months of GC that has followed three months of PC, and POLG1 and Twinkle remain subnormal in the mitochondria. Consistent with this, we have shown that the mitochondrial transcription factor, TFAM, and copy number also continue to be subnormal after the termination of hyperglycemic insult,9 and the genes encoded by mtDNA, ND1, and ND6 of complex I and cytochrome b of complex III remain subnormal.8,22 This raises the possibility that mtDNA fails to replicate efficiently after reversal of hyperglycemia, further exacerbating the recovery of the mtDNA biogenesis, and the retinopathy continues to progress.
The D-loop region of mtDNA contains the leading-strand for origin of replication, and major promoters for transcription and mutation in the D-loop are considered to serve as a marker for DNA damage in many chronic diseases, including optic neuropathy and breast cancer.22–24 In the development of diabetic retinopathy, the retinal mtDNA has preferential damage at the D-loop region compared to the CytB region, which can be protected by regulating mitochondrial superoxide levels.11 We showed that the damage to the D-loop region also fails to correct for at least three months after the hyperglycemic insult is removed. In addition to the binding of POLG1 to the D-loop region to mediate the replication process, POLG also helps in the repair of mtDNA damage, and as mentioned above, mtDNA damage also continues to progress and mtDNA repair enzymes remain compromised.8,9 To worsen the situation further, the binding of POLG1 to the D-loop region also remains subnormal. The reason for this failure could be the continued accumulation of superoxide and epigenetic modifications of sod2,8,13 thus resulting in continuous damage of the replication machinery.
Epigenetic modifications in specific target tissues have been implicated in the metabolic memory associated with diabetic complications. For example, histone modifications are linked with persistent activation of NF-kB after transient hyperglycemia in aortic endothelial cells, and with the continued reduction of promoter H3K9me3 in the vascular cells.25–27 We have shown that retinal sod2 remains epigenetically modified after the hyperglycemic insult is removed, and H4K20me3, p65, and acetyl H3K9 at the sod2 promoter continue to be elevated.13 This is accompanied by continuous subnormal global acetylation of histone H3.20 Gene expression also is controlled by DNA methylation, and this occurs almost exclusively on cytosine in a CG dinucleotide by the addition of a methyl group to the 5′ position of a cytosine ring. Aberrant DNA methylation patterns of CpG islands in the promoter region often are associated with transcriptional suppression.14 We showed that the promoter of POLG1 continues to be hyper-methylated after hyperglycemia is reversed, and the enzyme responsible for DNA methylation remains active. These results imply that the epigenetic modifications of the POLG1 promoter, induced by the previous hyperglycemic environment, persist even after normal glycemia is reinstituted, suggesting their role in the continued progression of diabetic retinopathy.
However, when good glycemic control is instituted soon after the induction of diabetes in rats, the replication machinery remained intact with no increase in epigenetic modifications, and the D-loop region did not show any additional damage. These data suggested that the abnormalities observed during good control of the reversal phase were not influenced by the high dose of insulin used to maintain the control, and supported that the diabetic patients should try to implement good glycemic control during the very early stages of the diagnosis of the disease.
Capillary cells of the retina are the major target of the pathology associated with diabetic retinopathy, and endothelial cells are considered as a good model for metabolic memory phenomenon. Glucose-induced increase in fibronectin expression is shown not to be readily reversible after the cells are brought back to normal glucose,28 and we have shown that the mitochondria biogenesis remains compromised and sod2 modified epigenetically after cessation of high glucose insult.9,12,13 Our results demonstrated that, in addition to impaired mtDNA replication system, the POLG1 promoter also continues to be hyper-methylated, and the activity of POLG remains subnormal to initiate proper replication process. These results are in agreement with our in vivo results obtained from the retina, and further support the role of epigenetic modification of POLG1 in the continued progression of diabetic retinopathy.
In summary, our study suggested that the retinal mtDNA replication machinery has an important role in continued mitochondrial dysfunction and DNA damage, and elucidated DNA hypermethylation as one of the possible mechanisms responsible for the failure of mtDNA damage to reverse after reinstitution of good glycemic control. Maintaining mitochondria homeostasis via modulating epigenetic changes using pharmaceutical or molecular means could help retard further progression of diabetic retinopathy, and help save vision loss for many diabetic patients.
Table. .
Primer Sequence
|
Gene |
Sequence |
Product Size (bp) |
| Rat | ||
| POLG1 | 158 | |
| Forward | 5′-TGGGATGCATGGCTGCACGG-3′ | |
| Reverse | 5′-AGGACTGCCCAGCCCCGTAG-3′ | |
| Twinkle | 208 | |
| Forward | 5′-AGGGCGAGCTGACGGTCTTT-3′ | |
| Reverse | 5′-AGTCAGCATGACCCGGGCTAGTC-3′ | |
| β-actin | 220 | |
| Forward | 5′-CCTCTATGCCAACACAGTGC-3′ | |
| Reverse | 5′-CATCGTACTCCTGCTTGCTG-3′ | |
| D-loop (short) | 148 | |
| Forward | 5′-CCTCCGTGAAATCAACAACC-3′ | |
| Reverse | 5′-TAAGGGGAACGTATGGACGA-3′ | |
| D-loop (long) | 819 | |
| Forward | 5′-TTGTGCTGACCTTCATGCCTTGACG-3′ | |
| Reverse | 5′-TGGGGATTGAGCGTAGAATGGCGT-3′ | |
| POLG1 promoter (methylated) | 133 | |
| Forward | 5′-TAGTATCGAGTATTTGCGGAAGTAC-3′ | |
| Reverse | 5′-CTCTACTTCTAAACCAAAAAACGAA-3′ | |
| POLG1 promoter (un-methyl) | 135 | |
| Forward | 5′-GTATTGAGTATTTGTGGAAGTATGG-3′ | |
| Reverse | 5′-CTCTACTTCTAAACCAAAAAACAAA-3′ | |
| Bovine | ||
| POLG1 | 151 | |
| Forward | 5′-AGCCCCGCGAGCTGTTTGTC-3′ | |
| Reverse | 5′-CACCGGGTGGGGACACCTCT-3′ | |
| Twinkle | 156 | |
| Forward | 5′-CAGAGGCGAGGGACCACGGA-3′ | |
| Reverse | 5′-GGCCGGTCCCTCCACAGCTA-3′ | |
| β-actin | 85 | |
| Forward | 5′-CCTCTATGCCAACACAGTGC-3′ | |
| Reverse | 5′-CATCGTACTCCTGCTTGCTG-3′ | |
| D-loop (short) | 91 | |
| Forward | 5′-TGCTTGGACTCAGCTATGGCCG-3′ | |
| Reverse | 5′-TCATTATGCTGGTGCTCAAGATGCA-3′ | |
| D-loop (long) | 891 | |
| Forward | 5′-AACAGACGCAATCCCAGGCCG-3′ | |
| Reverse | 5′-AGCTGTTAACCGCACGGCGA-3′ | |
| POLG1 promoter (methylated) | 152 | |
| Forward | 5′-TTGAGTATTTGTCGAGGGTC-3′ | |
| Reverse | 5′-TTCCGAAACGTCTAACCTTA-3′ | |
| POLG1 promoter (un-methyl) | 152 | |
| Forward | 5′-TGTTGAGTATTTGTTGAGGGTT-3′ | |
| Reverse | 5′-CTTCCAAAACATCTAACCTTAA-3′ | |
Acknowledgments
The authors thank Doug Putt and Yakov Shamailov for technical assistance.
Footnotes
Supported by National Institutes of Health NEI Grants R01 EY017313 and R01 EY014370, Juvenile Diabetes Research Foundation, The Thomas Foundation, and Research to Prevent Blindness.
Disclosure: S. Tewari, None; Q. Zhong, None; J.M. Santos, None; R.A. Kowluru, None
References
- 1.Engerman RL, Kern TS. Progression of incipient diabetic retinopathy during good glycemic control. Diabetes. 1987;36:808–812 [DOI] [PubMed] [Google Scholar]
- 2.Diabetes Control and Complications Trial Research Group The effect of intensive treatment of diabetes on the development of long-term complications in insulin-dependent diabetes mellitus. N Engl J Med. 1993;329:977–986 [DOI] [PubMed] [Google Scholar]
- 3.Diabetes Control and Complications Trial/Epidemiology of Diabetes Interventions and Complications Research Group Retinopathy and nephropathy in patients with type 1 diabetes four years after a trial of intensive therapy. N Engl J Med. 2000;342:381–389 [DOI] [PMC free article] [PubMed] [Google Scholar]
- 4.Kowluru RA. Effect of re-institution of good glycemic control on retinal oxidative stress and nitrative stress in diabetic rats. Diabetes. 2003;52:818–823 [DOI] [PubMed] [Google Scholar]
- 5.Kowluru RA, Kanwar M, Kennedy A. Metabolic memory phenomenon and accumulation of peroxynitrite in retinal capillaries. Exp Diabetes Res. 2007;2007:2196. [DOI] [PMC free article] [PubMed] [Google Scholar]
- 6.Durham JT, Herman IM. Microvascular modifications in diabetic retinopathy. Curr Diab Rep. 2011;4:253–264 [DOI] [PubMed] [Google Scholar]
- 7.Kowluru RA, Abbas SN. Diabetes-induced mitochondrial dysfunction in the retina. Invest Ophthalmol Vis Sci. 2003;44:5327–5334 [DOI] [PubMed] [Google Scholar]
- 8.Madsen-Bouterse SA, Mohammad G, Kanwar M, Kowluru RA. Role of mitochondrial DNA damage in the development of diabetic retinopathy, and the metabolic memory phenomenon associated with its progression. Antioxid Redox Signal. 2010;13:797–805 [DOI] [PMC free article] [PubMed] [Google Scholar]
- 9.Santos JM, Kowluru RA. Role of mitochondria biogenesis in the metabolic memory associated with the continued progression of diabetic retinopathy. Invest Ophthalmol Vis Sci. 2011;52:8791–8798 [DOI] [PMC free article] [PubMed] [Google Scholar]
- 10.Mohammad G, Kowluru RA. Novel role of mitochondrial matrix metalloproteinase-2 in the development of diabetic retinopathy. Invest Ophthalmol Vis Sci. 2011;52:3832–3841 [DOI] [PMC free article] [PubMed] [Google Scholar]
- 11.Tewari S, Santos JM, Kowluru RA. Damaged mitochondrial DNA replication system and the development of diabetic retinopathy. Antioxid Redox Signal. 2012;17: 492–504 [DOI] [PMC free article] [PubMed] [Google Scholar]
- 12.Madsen-Bouterse S, Zhong Q, Mohammad G, Ho YS, Kowluru RA. Oxidative damage of mitochondrial DNA in diabetes, and its protection by manganese superoxide dismutase. Free Rad Research. 2010;44:313–321 [DOI] [PMC free article] [PubMed] [Google Scholar]
- 13.Zhong Q, Kowluru RA. Epigenetic changes in mitochondrial superoxide dismutase in the retina and the development of diabetic retinopathy. Diabetes. 2011;60:1304–1313 [DOI] [PMC free article] [PubMed] [Google Scholar]
- 14.Schinke C, Mo Y, Yu Y, et al. Aberrant DNA methylation in malignant melanoma. Melanoma Res. 2010;20:253–265 [DOI] [PMC free article] [PubMed] [Google Scholar]
- 15.Akçay T, Dinçer Y, Celebi N, Ilkova H. O(6)-methylguanine DNA methyltransferase activity in diabetic patients. Diabetes Res Clin Pract. 2003;61:1–6 [DOI] [PubMed] [Google Scholar]
- 16.Williams KT, Garrow TA, Schalinske KL. Type I diabetes leads to tissue-specific DNA hypomethylation in male rats. J Nutr. 2008;138:2064–2069 [DOI] [PubMed] [Google Scholar]
- 17.Ling C, Del GS, Lupi R, et al. Epigenetic regulation of PPARGC1A in human type 2 diabetic islets and effect on insulin secretion. Diabetologia. 2008;51:1992–2000 [DOI] [PMC free article] [PubMed] [Google Scholar]
- 18.Korhonen JA, Pham XH, Pellegrini M, Falkenberg M. Reconstitution of a minimal mtDNA replisome in vitro. EMBO J. 2004;23:2423–2429 [DOI] [PMC free article] [PubMed] [Google Scholar]
- 19.Kowluru RA. Effect of re-institution of good glycemic control on retinal oxidative stress and nitrative stress in diabetic rats. Diabetes. 2003;52:818–823 [DOI] [PubMed] [Google Scholar]
- 20.Zhong Q, Kowluru RA. Role of histone acetylation in the development of diabetic retinopathy and the metabolic memory phenomenon. J Cell Biochem. 2010;110:1306–1313 [DOI] [PMC free article] [PubMed] [Google Scholar]
- 21.Santos JM, Tewari S, Goldberg AFX, Kowluru RA. Mitochondria biogenesis and the development of diabetic retinopathy. Free Rad Biol Med. 2011;51:1849–1860 [DOI] [PMC free article] [PubMed] [Google Scholar]
- 22.Kumar M, Tanwar M, Saxena R, Sharma P, Dada R. Identification of novel mitochondrial mutations in Leber's hereditary optic neuropathy. Mol Vis. 2010;16:782–792 [PMC free article] [PubMed] [Google Scholar]
- 23.Cai FF, Kohler C, Zhang B, et al. Mutations of mitochondrial DNA as potential biomarkers in breast cancer. Anticancer Res. 2011;31:4267–4271 [PubMed] [Google Scholar]
- 24.Rakyan VK, Down TA, Balding DJ, Beck S. Epigenome-wide association studies for common human diseases. Nat Rev Genet. 2011;12:529–41 [DOI] [PMC free article] [PubMed] [Google Scholar]
- 25.El-Osta A, Brasacchio D, Yao D, et al. Transient high glucose causes persistent epigenetic changes and altered gene expression during subsequent normoglycemia. J Exp Med. 2008;205:2409–2417 [DOI] [PMC free article] [PubMed] [Google Scholar]
- 26.Villeneuve LM, Reddy MA, Lanting LL, Wang M, Meng L, Natarajan R. Epigenetic histone H3 lysine 9 methylation in metabolic memory and inflammatory phenotype of vascular smooth muscle cells in diabetes. Proc Natl Acad Sci U S A. 2008;105:9047–9052 [DOI] [PMC free article] [PubMed] [Google Scholar]
- 27.Villeneuve LM, Reddy MA, Natarajan R. Epigenetics: deciphering its role in diabetes and its chronic complications. Clin Exp Pharmacol Physiol. 2011;38:401–409 [DOI] [PMC free article] [PubMed] [Google Scholar]
- 28.Roy S, Sala R, Cagliero E, Lorenzi M. Overexpression of fibronectin induced by diabetes or high glucose: phenomenon with a memory. Proc Natl Acad Sci U.S.A. 1990;87:404–408 [DOI] [PMC free article] [PubMed] [Google Scholar]


