

Abstract
Objectives
To investigate the hemostatic status of critically ill, nonbleeding trauma patients. We hypothesized that a hypercoagulable state exists in patients early after severe injury and that the pattern of clotting and fibrinolysis are similar between burned and nonburn trauma patients.
Materials and Methods
Patients admitted to the surgical or burn intensive care unit within 24 hours after injury were enrolled. Blood samples were drawn on days 0 through 7. Laboratory tests included prothrombin time (PT), activated partial thromboplastin time (aPTT), levels of activated factor XI (FXIa), D-dimer, protein C percent activity, and antithrombin III (AT III) percent activity, and thromboelastography (TEG).
Results
Study subjects were enrolled from April 1, 2004, through May 31, 2005, and included nonburn trauma patients (n=33), burned patients (n=25), and healthy (control) subjects (n=20). Despite aggressive thromboprophylaxis, 3 subjects (2 burned and 1 nonburn trauma patients [6%]) had pulmonary embolism during hospitalization. Compared with controls, all patients had prolonged PT and aPTT (P<.05). The rate of clot formation (α angle) and maximal clot strength were higher for patients compared with controls (P<.05), indicating a hypercoagulable state. Injured patients also had lower protein C and AT III percent activities and higher fibrinogen levels (P<.05 for all). FXIa was elevated in 38% of patients (control subjects had undetectable levels).
Discussion
TEG analysis of whole blood showed patients were in a hypercoagulable state; this was not detected by plasma PT or aPTT. The high incidence of pulmonary embolism indicated that our current prophylaxis regimen could be improved.
Keywords: deep vein thrombosis, pulmonary embolism, thromboelastograph
Introduction
Coagulopathy detected early after injury is indicative of injury severity and is a prognostic factor for blood transfusions and death (1,2). The ability to form a fibrin clot at the site of injury is integral to limiting hemorrhage and to subsequent survival. However, the resulting hemorrhage control comes with a price—it can lead to venothromboembolic (VTE) complications (3). Therefore, it is important to accurately evaluate an injured patient’s hemostatic status to assess the need for and efficacy of deep vein thrombosis (DVT) prophylaxis. Standard coagulation tests include the prothrombin time (PT) and activated partial thromboplastin time (aPTT) assays; these are general measures of extrinsic and intrinsic clotting pathway integrity, respectively. However, these tests are performed on platelet-poor plasma and thus cannot assess the true rate of clot formation, overall clot strength, or degree of clot dissolution (fibrinolysis) (4).
Thromboelastography (TEG) provides a comprehensive overview of the clotting process, from initial thrombin generation to formation of fibrin strands to fibrinolysis (2,5). TEG has been used during the past 2 decades to guide transfusion strategy for patients undergoing procedures with considerable potential for bleeding such as orthotopic liver transplantation and cardiopulmonary bypass (6–8). Furthermore, assessment of a patient’s coagulation status by TEG can reduce the need for transfusions in cardiac surgery (9). In the field of trauma, Plotkin et al (10) showed that TEG can accurately predict the need for transfusion during the first 24 hours after a penetrating injury. TEG also can sensitively identify patients with postinjury hypercoagulability (2,11,12). However, use of TEG to compare the degree of hypercoagulability and fibrinolysis after different types of trauma has not been described.
The hypercoagulable state resulting from tissue injury has been attributed mainly to increased tissue factor (TF)–dependent thrombin generation (13–19). Activation of the contact pathway (TF-independent) can also lead to thrombin generation in vitro (20), but the physiologic significance of this pathway has not been understood well until recently (21). Activated coagulation factor XI (FXIa) is considerably higher in patients with acute coronary syndrome than in those with stable angina pectoris (22–24). Finally, key anticoagulant factors such as protein C, antithrombin III (AT III), and the tissue factor pathway inhibitor are important for maintaining hemostatic balance (25–32).
The objective of this study was to determine coagulation changes during the first 7 days in critically injured, nonbleeding, burned and nonburn trauma patients. We stratified patients by burn status and compared findings from plasma-clotting assays (PT and aPTT) and a whole-blood clotting test (TEG). Additionally, we measured FXIa levels and protein C and AT III percent activities. We hypothesized that all nonbleeding injured patients were in a hypercoagulable state early after injury and that the pattern of fibrinolysis was similar after any traumatic injury, with or without burns. We further hypothesized that the resulting postinjury hypercoagulable state was due to an imbalance in procoagulant and anticoagulant activity and that these processes would be similar for both injury groups.
Materials and Methods
This study was reviewed and approved by the Institutional Review Board at the Brooke Army Medical Center.
Study Subjects
Trauma patients admitted to the intensive care unit (ICU) were considered for study enrollment; patients could be with or without burns or inhalation injury. Patients and their families were given an information sheet describing the less-than-minimal risk study before enrollment. Inclusion criteria were as follows: 1) age 18 years or older; 2) admission occurred within 24 hours after injury; and 3) an anticipated stay of at least 72 hours at the US Army Institute of Surgical Research Burn Center or Trauma ICU at the Brooke Army Medical Center (Fort Sam Houston, Texas). Prisoners, patients admitted to non-ICU wards, patients receiving anticoagulation therapy with warfarin or antiplatelet agents, and patients with known underlying coagulopathies were excluded. In addition, 20 healthy volunteers were recruited; informed consent was obtained, and their laboratory data were used as a reference.
Blood Sample
Baseline blood specimens were collected from each subject within 24 hours of admission (day 0). The day-1 sample was drawn 12 to 24 hours after the first blood draw. Subsequent blood samples were drawn each morning on days 2, 3, 5, and 7 after admission; 20 mL were drawn each day, and all samples were taken only from an arterial or central venous line inserted for standard clinical care. If the central line was used for sampling, the first 5 mL of blood withdrawn was discarded before an additional 20 mL was drawn. Blood sampling ceased when a patient was transferred out of the ICU. A single blood sample also was obtained from the 20 healthy volunteers (control subjects).
Sample Processing
Blood was collected and processed by research nurses or trained laboratory technicians at the US Army Institute of Surgical Research. The blood sample was divided between three 4.5-mL, citrate-containing tubes, one 3.5-mL tube with ethylenediamine tetraacetic acid (EDTA), and one 3-mL tube (native whole blood) for TEG analysis. The citrate-containing tubes were centrifuged at 3,000×g for 15 minutes in a small clinical centrifuge. The plasma was placed in a 4.6-mL cryogenic vial and frozen at −70°C until assayed. All coagulation analyses were performed in the laboratory section of the US Army Institute of Surgical Research. The sample mixed with EDTA was used for blood cell counts (Cell-Dyn Sapphire hematology analyzer; Abbott Diagnostics, Chicago, Illinois).
Plasma-Based Assays
Frozen samples were rapidly thawed in a 37°C water bath for 10 minutes. PT, aPTT, fibrinogen levels, D-dimer levels, AT III ercent activity (Berichrom kit; Dade Behring, Deerfield, Illinois), and protein C percent activity (Berichrom kit) were measured (BCS Coagulation Analyzer; Dade Behring) following the manufacturer protocols. The protein C assay that we used measured the activated and inactivated form of protein C in plasma (hence the term “protein C percent activity”). The FXIa assay was performed as described elsewhere (24) and was considered quantifiable if the amount present was greater than 10 picomole.
Thromboelastography
A computerized coagulation analyzer (model 5000; Haemoscope, Niles, Illinois) was used for TEG studies. Quality control checks were completed within 8 hours of blood collection and were performed following manufacturer instructions. TEG analysis was conducted at the patient’s body temperature and occurred within 4 minutes after the blood sample was drawn. Whole, native blood (0.35 mL) was added to each sample cup, and the temperature setting checked for accuracy. Ten µL of tissue factor solution was added to each blood sample before analysis. Tissue factor solution was prepared daily by diluting reconstituted recombinant human tissue factor (Dade Behring) 1:1000 with saline. The TEG analyzer was stopped 60 minutes after reaching maximal clot strength. For patients who were prescribed heparin for DVT prophylaxis, TEG was performed with heparinase cups (otherwise, assays were performed with plain cups). Analysis was conducted in duplicate and mean values were calculated.
TEG parameters that represent different aspects of hemostasis were measured. R is the time elapsed until the onset of clotting; this is the point at which all other plasma clotting assays (eg, PT and aPTT) are stopped. Its value increases with coagulation factor deficiency. The α angle is the angle between the tangent line (drawn from the split point to the curve) and the horizontal line of the trace. It is affected primarily by the rate of thrombin generation, which is vital for the conversion of fibrinogen to fibrin. The greater the α angle, the faster the rate of clot formation via this interaction. The maximal amplitude (MA) of the trace indicates the greatest strength of the clot. This end product of maximal platelet-fibrin interaction is the key product of coagulation that prevents injured tissue from continued hemorrhage. Total thrombus generation (TTG) is calculated by measuring the area under the thrombus velocity curve. TTG findings (dynes/cm2) correlate with results from thrombin-antithrombin complex assays (33). After MA is reached, fibrinolysis ensues. The percent reduction of area under the TEG tracing from MA to 30 minutes after MA is reached indicates the state of fibrinolysis (clot lysis after 30 minutes [LY30]). The definition that we used for hypercoagulable state was previously defined by Kaufmann and colleagues (2) as the presence of at least 2 of the following: shortened R time, increased α angle, and increased MA.
Clinical Database
Clinical data were collected from subjects during their ICU stay for up to 30 days or until the patient was transferred out of the ICU. All laboratory test results and basic patient characteristics were imported into a clinical database. Data gathered included sex, age, injury severity score, percent of the total body surface area (%TBSA) burned, presence of inhalation injury, surgical procedures performed, list of all injuries, total number of days in the ICU, total number of hospital days, and daily multiple organ dysfunction syndrome score (34). DVT and pulmonary embolism diagnoses were made on the basis of a duplex scan of the legs and a computed tomographic scan of the chest if clinically indicated. The DVT prophylaxis of burned and nonburn trauma patients, per our clinical pathway guidelines, is enoxaparin (30 mg, administered subcutaneously, twice a day) and mechanical lower extremity compression.
Statistics
Statistical analysis was performed using SAS, version 8.1 (SAS Institute Inc, Cary, North Carolina) and SPSS 10.1 (SPSS Inc, Chicago, Illinois). Categorical data were analyzed using the χ2 or Fisher exact test. A comparison of continuous variables between patients and controls was performed using the 2-sample t test. Comparisons among the burned, nonburn trauma, and control groups were performed by 1-way analysis of variance followed by the Tukey correction for post-hoc comparisons. The Welch analysis of variance followed by the Dunnett T3 method for post-hoc comparisons was used when appropriate. Control data (based on findings from a one-time blood draw from 20 healthy volunteers) were compared with patient data through day 7 after injury. Pearson correlation coefficients were calculated between continuous variables. P values less than .05 were considered statistically significant for all comparisons. Data are reported as mean (SEM).
Results
Patient Characteristics
In total, 479 burned and 1,366 nonburn trauma patients presented to the emergency department from April 1, 2004, through May 31, 2005. Of these, 212 burned and 367 nonburn trauma patients were admitted to the ICU. Sixty-one patients were enrolled in the study. Three patients were excluded because of death within 48 hours after injury. Patient groups consisted of 25 burned patients (8 with inhalation injury) and 33 nonburn trauma patients (blunt injury, n=20; penetrating injury, n=13). Patient characteristics are shown in Table 1. All were screened for evidence of hemorrhage at the time of the blood draw, and none were actively bleeding. Three trauma patients had isolated injuries to the head (blunt, n=2; penetrating, n=1). Body temperature at time of the blood sampling was 37.4 (0.1)°C (range, 34.3–40.1°C). One patient had a temperature of 34.3°C at admission but otherwise was at least 35.0°C at all other times. Fifteen patients died during hospitalization (burned patients, n=11; nonburn trauma patients, n=4). For these 15 patients, the mean survival after admission was 38.2 (12.3) days (range, 3–153 days).
Table 1.
Patient Characteristicsa
| Injury | Age, y | Men, % | Injury Severity Score |
Blunt Mechanism, % |
TBSA Burned, % |
TBSA With Third-Degree Burns, % |
Hospitalization, d |
ICU Stay, d |
|---|---|---|---|---|---|---|---|---|
| Burned (n=25) | 56.0 (4.3)b | 72 | 18.1 (2.3) | NA | 30 (4) | 9.5 (3.0) | 36.8 (7.7) | 26.3 (6.2) |
| Nonburn trauma (n=33) | 43.0 (3.1) | 78 | 21.7 (1.7) | 61 | NA | NA | 25.8 (4.5) | 13.0 (2.5) |
| None (control) (n=20) | 37.3 (2.5) | 55 | NA | NA | NA | NA | NA | NA |
Abbreviations: ICU, intensive care unit; NA, not applicable; TBSA, total body surface area.
Data are shown as mean (SEM).
P<.05 compared with nonburn trauma and control groups.
Nearly all subjects in our study received DVT prophylaxis within 24 hours after admission, per our institution’s clinical pathway guidelines. The only exception was a burned patient who did not receive prophylaxis for the first 3 days after admission. Another burned patient received DVT prophylaxis within 24 hours of admission but did not receive it on day 5 of hospitalization. Neither patient had complications of VTE.
PT, aPTT, and TEG Parameters
Coagulation parameters for all patients and healthy controls are shown in Table 2. At baseline and continuing through day 2, patients had elevated PT compared with controls (P<.05). Also, aPTT was elevated through day 5 compared with controls (P<.05). However, TEG measurements indicated that patients were in a hypercoagulable state: the rate of clot formation (indicated by the α angle) and overall clot strength (indicated by the MA) were higher in patients than in controls. However, R time (representing the initiation phase of coagulation) was not significantly different between patients and controls, indicating that the patients were not deficient in coagulation factors. D-dimer and LY30 values, both reflective of fibrinolysis, were elevated in the injured group. Compared with controls, total fibrinogen levels were significantly elevated on all days except admission. Platelet counts for patients were significantly lower than that of controls for the first 5 days after injury but returned to baseline by day 7.
Table 2.
Coagulation Parametersa
| Parameter | Control Patients (n=20) |
Burned and Nonburn Trauma Patients (n=58) |
|||||
|---|---|---|---|---|---|---|---|
| Day 0 | Day 1 | Day 2 | Day 3 | Day 5 | Day 7 | ||
| PT, sec | 10.9 (0.2) | 13.0 (0.4b) | 12.1 (0.2b) | 11.9 (0.6b) | 10.4 (0.1) | 10.8 (0.2) | 11.0 (0.2) |
| aPTT, sec | 28.4 (0.5) | 34.4 (0.5b) | 35.8 (1.4b) | 35.5 (1.6b) | 33.0 (0.9b) | 32.0 (0.8b) | 30.5 (1.0) |
| Fibrinogen, mg/dL | 301 (18) | 274 (13) | 466 (22b) | 638 (38b) | 730 (34b) | 752 (37b) | 738 (37b) |
| D-dimer, µg/mL | 2.2 (0.3) | 9.6 (2.8b) | 5.8 (1.2b) | 5.3 (1.1b) | 5.8 (1.0b) | 10.6 (2.0b) | 10.1 (2.2b) |
| Platelets, ×109/L | 239 (12) | 215 (20) | 149 (20b) | 119 (10b) | 137 (15b) | 179 (13b) | 231 (20) |
| R time, min | 6.0 (0.3) | 5.2 (0.4) | 6.2 (0.4) | 6.5 (0.5) | 6.2 (0.3) | 7.3 (0.5b) | 6.9 (0.5) |
| α angle, degrees | 43.5 (1.4) | 53.2 (1.8b) | 51.4 (1.8b) | 50.9 (1.9b) | 53.1 (1.7b) | 52.6 (2.0b) | 55.3 (2.0b) |
| MA, mm | 56.2 (1.2) | 59.9 (1.2b) | 61.2 (1.1b) | 64.1 (1.1b) | 67.1 (1.1b) | 68.3 (1.4b) | 69.0 (1.1b) |
| LY30, % | 0.5 (0.2) | 1.8 (0.3b) | 2.7 (0.5b) | 2.8 (0.7b) | 3.8 (1.1b) | 2.3 (1.1b) | 3.3 (0.9b) |
Abbreviations: aPTT, activated partial prothrombin time; LY30, clot lysis at 30 minutes; MA, maximal amplitude; PT, prothrombin time.
Data are shown as mean (SEM).
P<.05 compared with control.
Additional comparisons were made between the burned patients, nonburned trauma patients, and healthy controls. PT and aPTT were elevated in the burned group compared with the other 2 groups. This effect was more pronounced during days 0 through 2 (Figure 1 A and B). However, both burned and nonburn trauma patients were in a hypercoagulable state, as shown by TEG; the α angle, MA, and TTG were elevated for most of the first 7 days after injury (Figure 1 C–E). This was associated with increased fibrinogen levels in the patient groups (Figure 1 F). R values were not significantly different among the 3 groups at any time (P>.05). In nonburn trauma patients, fibrinolysis (as measured by D-dimer and LY30) was increased significantly compared with controls beginning at day 0. However, increased fibrinolysis was not apparent in burned patients until days 5 and 7 compared with controls (Figure 2 A and B).
Figure 1.
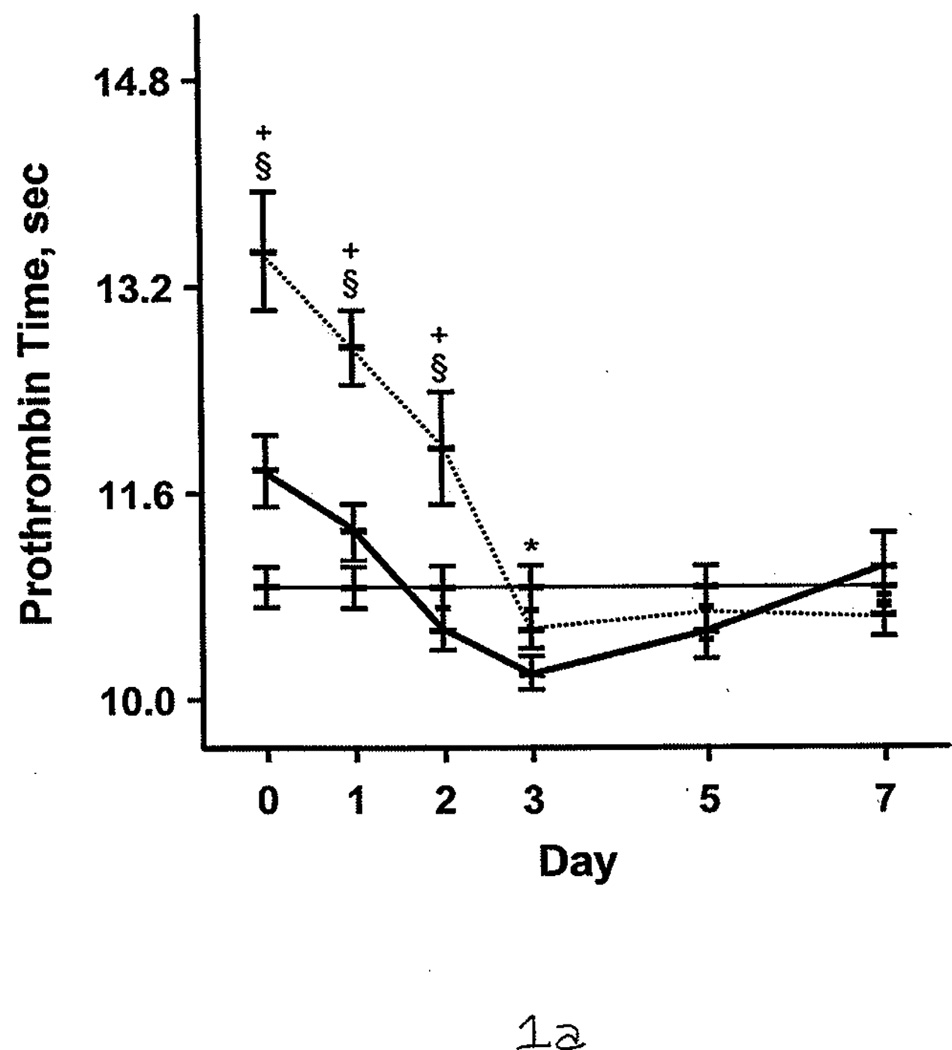
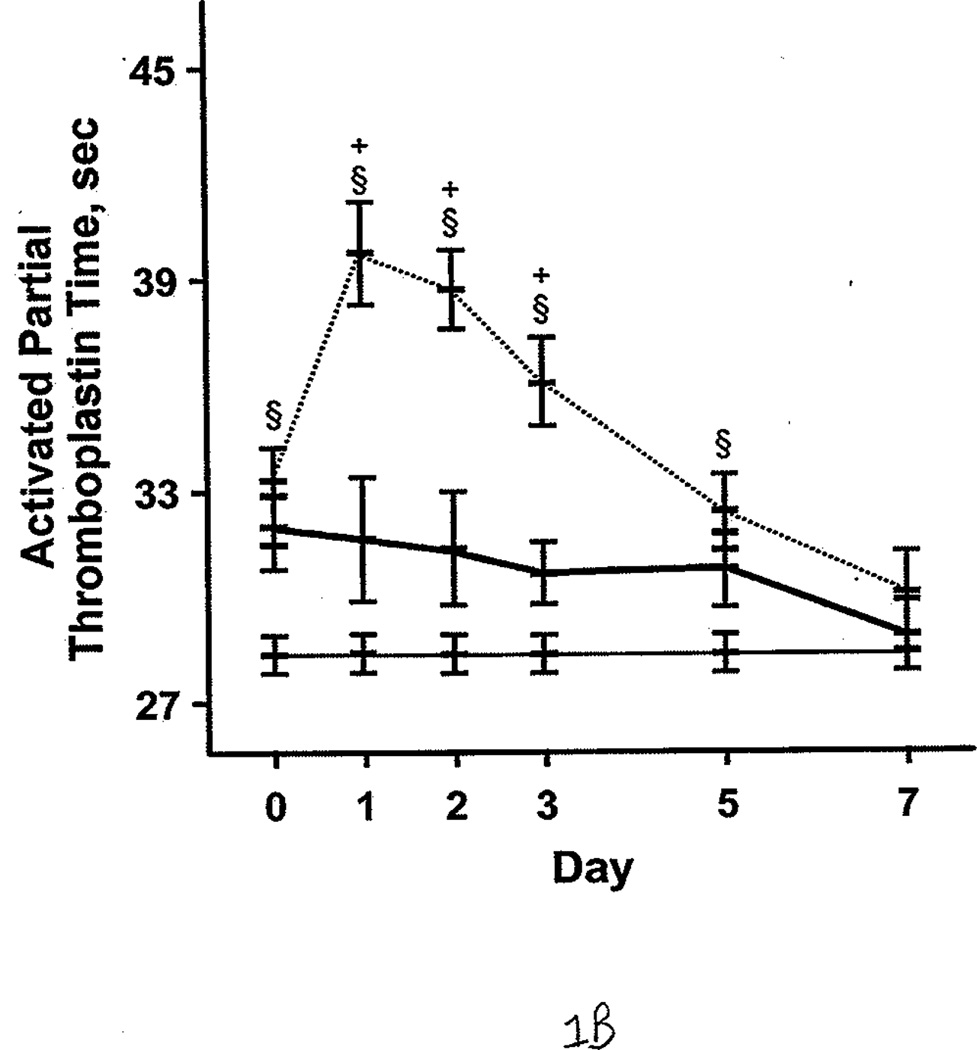
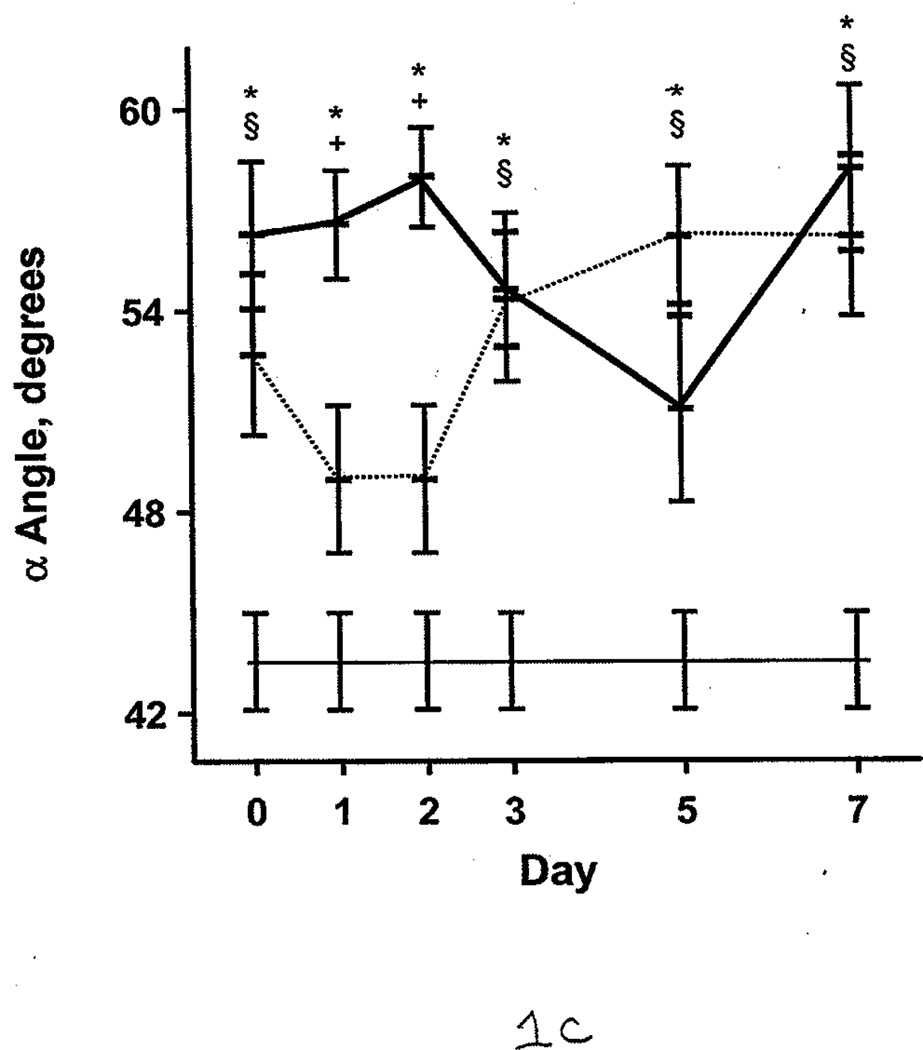
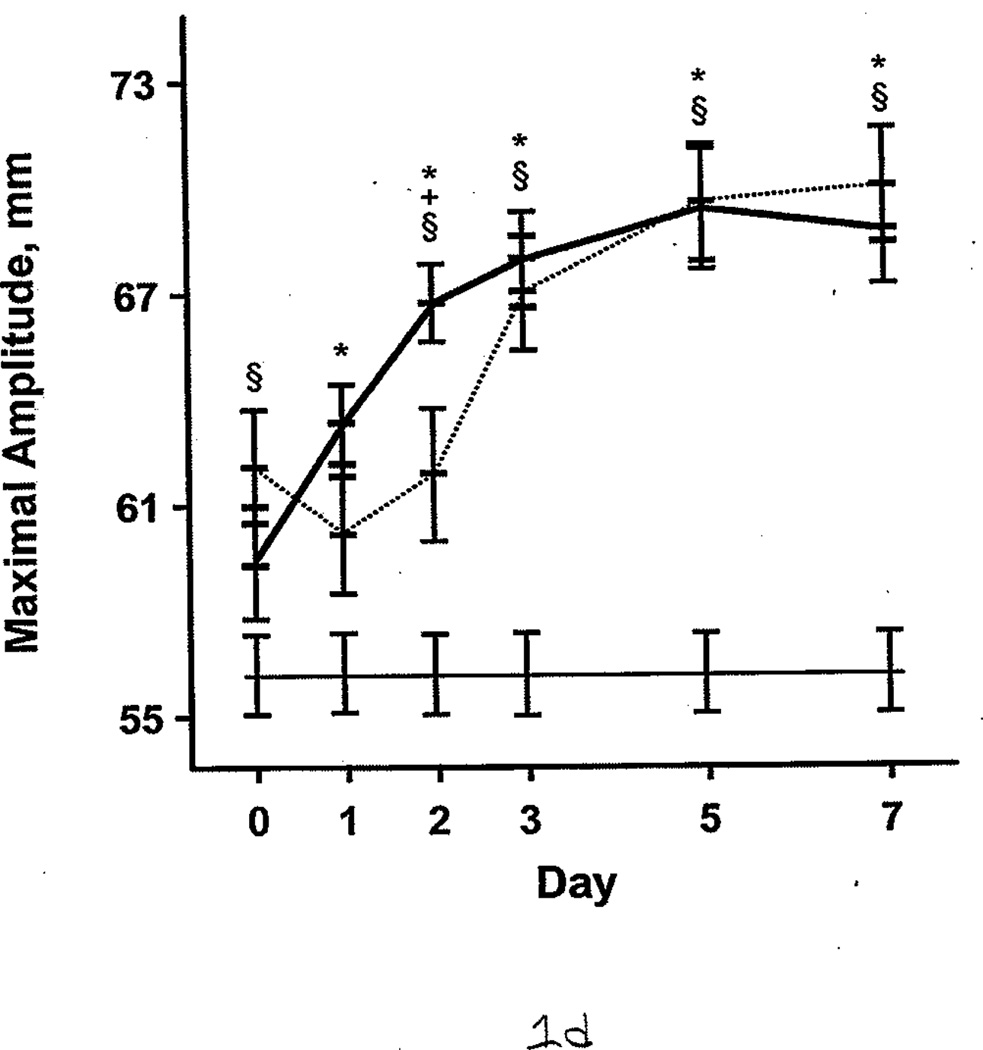
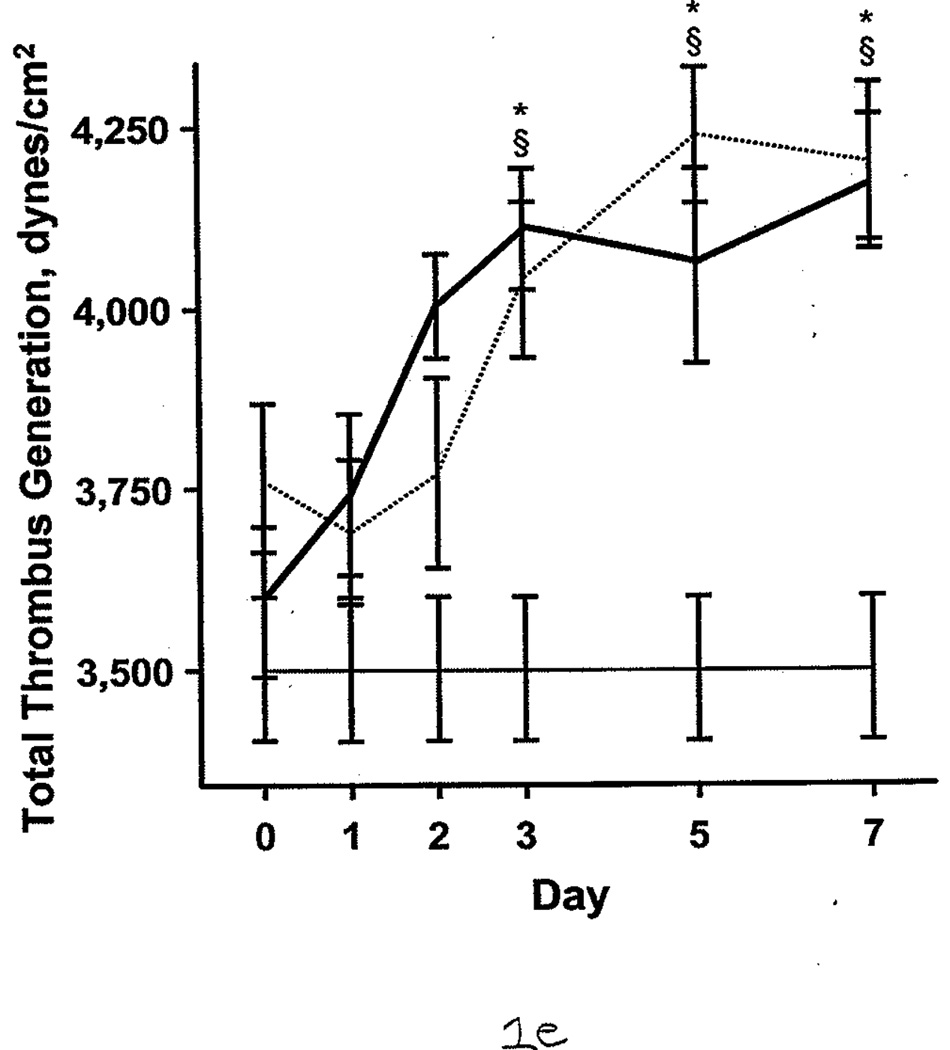
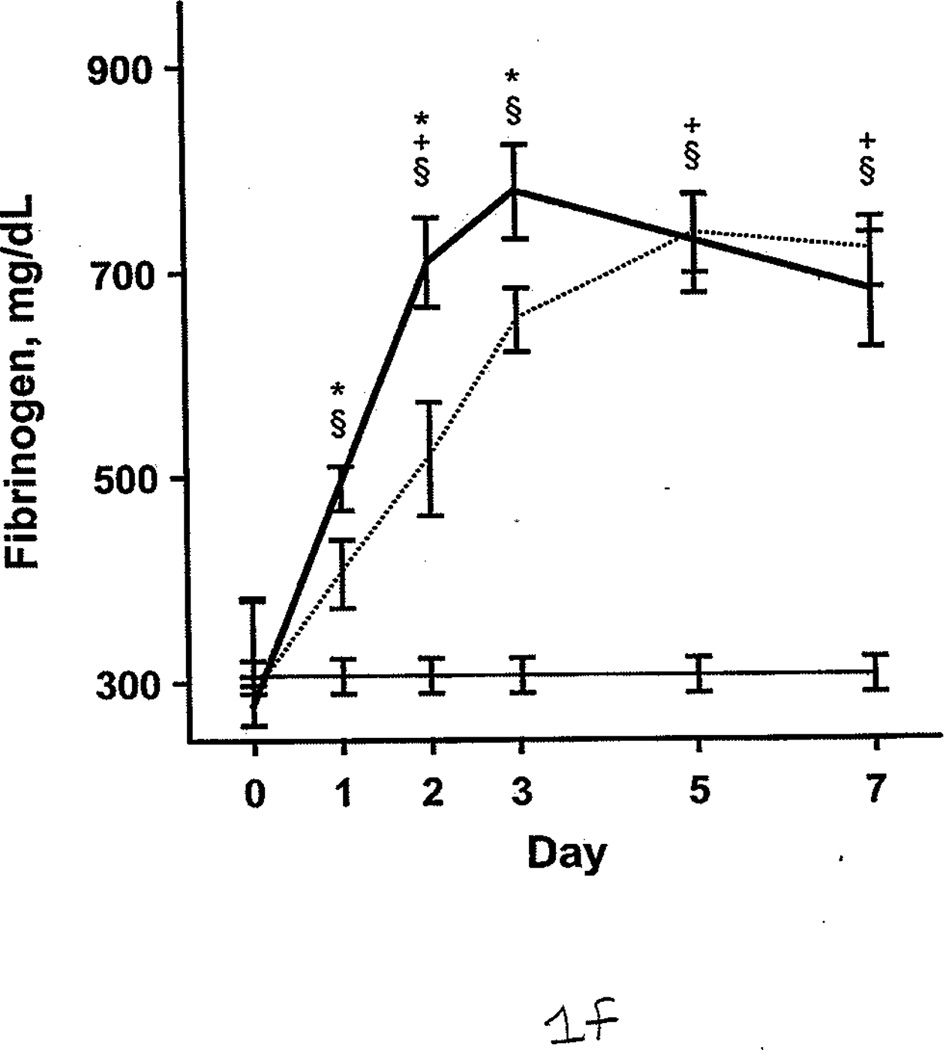
Coagulation Parameters in Burned Patients, Nonburn Trauma Patients, and Control Subjects. The dashed line denotes burned patients; the thick line, nonburn trauma patients; the thin line, control patients. Error bars indicate SEM. Symbols on the graph indicate statistically significant differences (§ denotes burned vs control; *, trauma vs control; +, burn vs trauma). A, Prothrombin time. B, Activated partial thromboplastin time. C, α angle. D, Maximal amplitude. E, Total thrombus generation. F, Fibrinogen.
Figure 2.
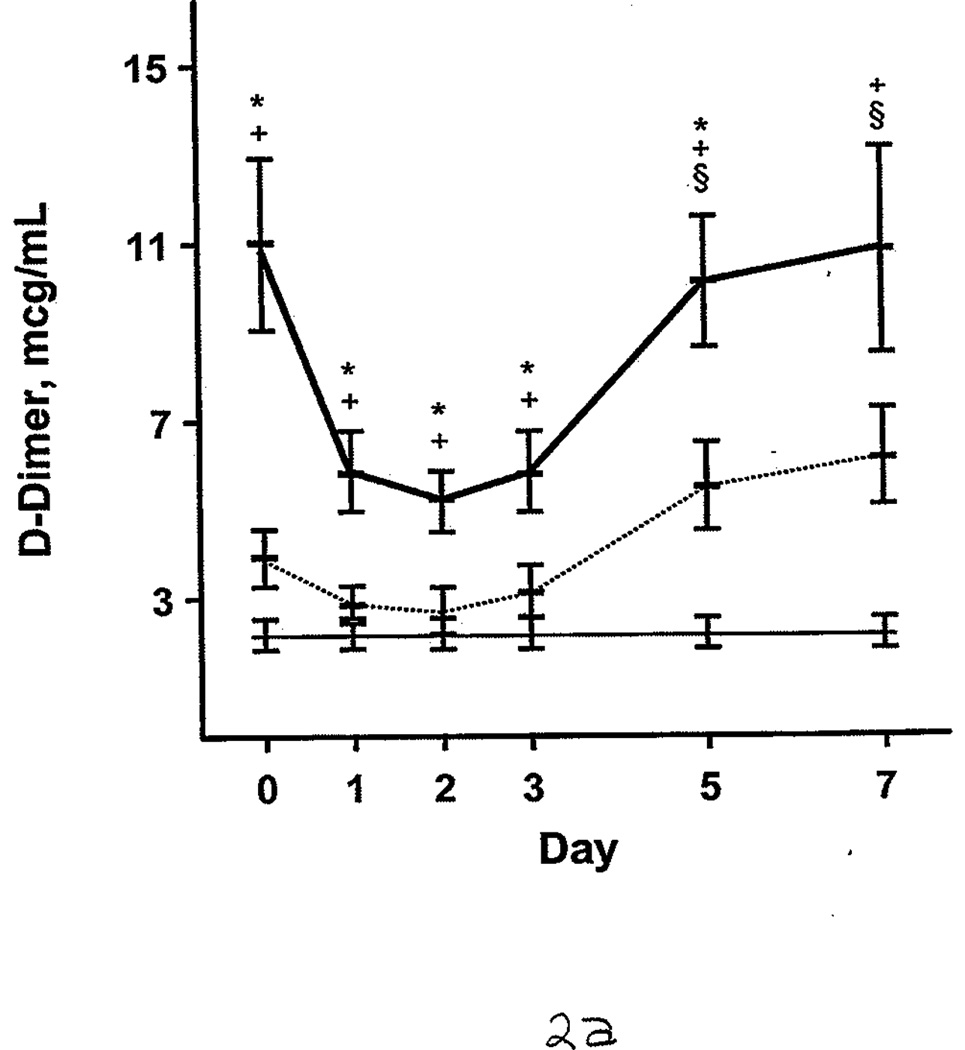
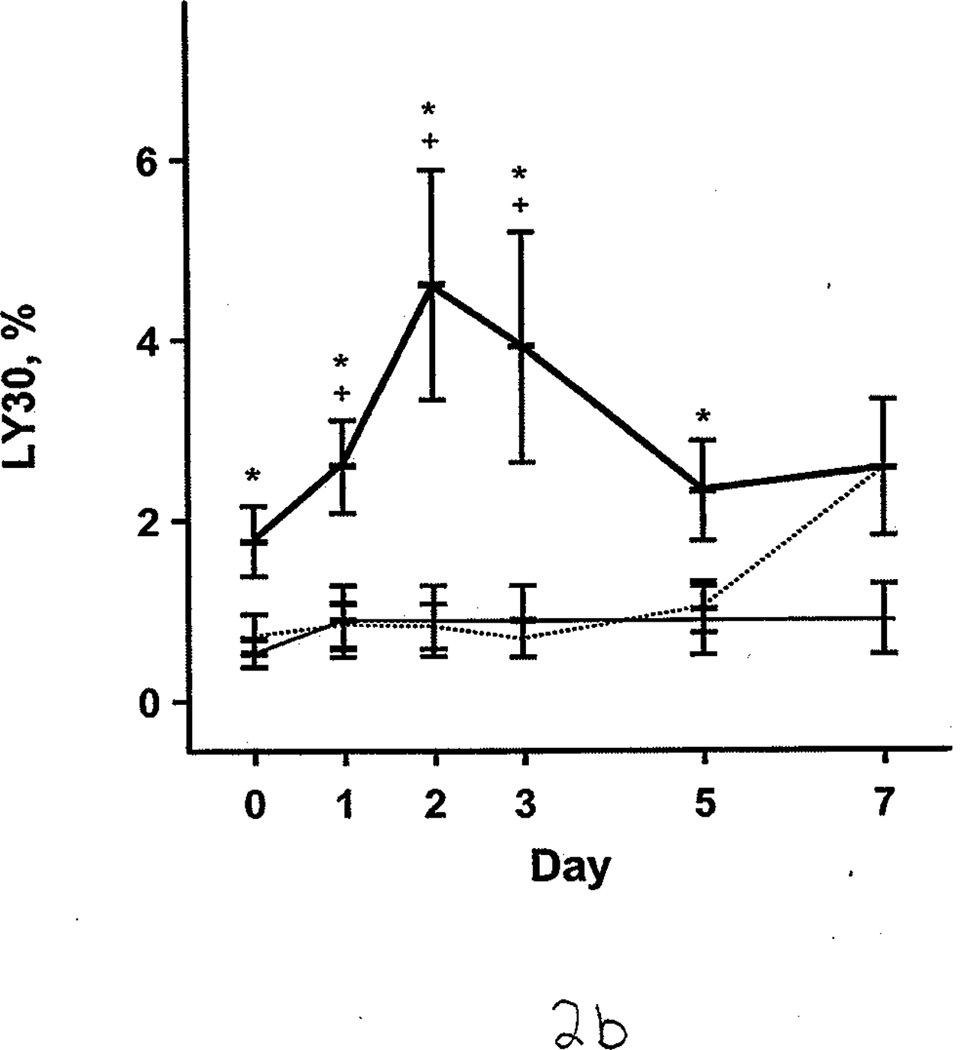
Fibrinolysis in Burned Patients, Nonburn Trauma Patients, and Control Subjects. Lines and symbols are same as described in the legend for Figure 1. A, D-dimer. B, Clot lysis at 30 minutes (LY30).
Patients With Blunt or Penetrating Trauma Injuries
We examined coagulation parameters of nonburn trauma patients and stratified patients by blunt versus penetrating injury. R time at admission (day 0) was significantly shorter for patients with blunt injuries, indicating a faster initiation phase of clotting, compared with patients with penetrating injuries (3.97 [0.23] vs 6.27 [0.96] minutes; P<.05) and compared with controls (6.00 [0.30] minutes; P<.001). The difference in R time between patients with penetrating injuries and the control subjects was not significant. The other TEG parameters (α angle, MA, TTG, LY30), D-dimers, PT, and aPTT were not significantly different between the patients with blunt injuries and patients with penetrating injuries (P>.05).
Patients With VTE
Only 2 nonburn trauma patients and 1 burned patient had development of VTE (Table 3). On the basis of clinical suspicion, these patients were evaluated, and each subsequently received a diagnosis of pulmonary embolism (the condition was diagnosed on day 9 for 2 subjects and on day 13 for 1).
Table 3.
Patients With Clinically Significant Venothromboembolic Complicationsa
| Injury | Age, y | DVT | Postinjury Day |
Clinical Indications |
|---|---|---|---|---|
| Burned | 45 | No | 9 | Hypoxia and peripheral edema |
| Nonburn trauma | 27 | Yes | 13 | Acute desaturation |
| Nonburn trauma | 53 | Yes | 9 | Acute desaturation and lung consolidation |
Abbreviation: DVT, deep venous thrombosis.
All patients were men. All had pulmonary embolism.
The PT, aPTT, and TEG parameters from the first 48 hours after admission (days 0 and 1) were compared with those of the controls. The PT (11.9 [0.3] vs 10.9 [0.2] seconds; P=.06) and aPTT (33.7 [2.0] vs 28.4 [0.5] seconds; P=.10) were not significantly different from controls. However, the α angle (56.5 [3.3] vs 43.5 [1.4] degrees; P=.04) and MA (62.9 [1.4] vs 56.2 [1.0] mm; P=.02) were significantly higher. Comparison of patients with VTE complications (n=3) and patients without (n=55) showed no significant differences for PT, aPTT, and TEG parameters.
FXIa, Protein C, and AT III
FXIa was measured for 21 of 58 patients. Of these, 8 (38%) had significantly higher FXIa (63 pM [17]) compared with controls, who had undetectable FXIa in the plasma (<10 pM; P<.05). FXIa levels were highest during the first 2 days after injury. The protein C percent activity (64.0 [2.1]% vs 115.0 [2.1]%; P<.001) and AT III percent activity (55.0 [2.0]% vs 107.0 [1.0]%; P<.001) were significantly lower in all patients compared with controls. During the first 7 days, burned patients had relatively lower protein C and AT III percent activities than nonburn trauma patients (Figure 3 A and B). (Reference range for AT III percent activity was 75%–125%; reference range for protein C percent activity was 70%–140%.) Patients with average AT III percent activity (greater than 69%) had significantly lower %TBSA burned than those with AT III percent activity less than 40% (14.8 [2.8] vs 30.1 [2.1] %TBSA; P<.05). Similarly, patients with protein C percent activity greater than 85% had significantly smaller %TBSA burned than those with protein C levels less than 41% (13.3 [1.5] vs 40.0 [3.8] %TBSA; P<.001). The 3 patients with VTE complications also had significantly lower levels of protein C percent activity than the healthy controls (90.0 [2.0]% vs 115.0 [2.1]%; P<.01) and AT III percent activity (83.6 [8.5] vs 107.0 [1.0]%; P<.05). Furthermore, protein C and AT III percent activities were associated with multiple organ dysfunction syndrome scores; generally, the higher the score, the lower these anticoagulant levels in plasma (Figure 4 A and B).
Figure 3.
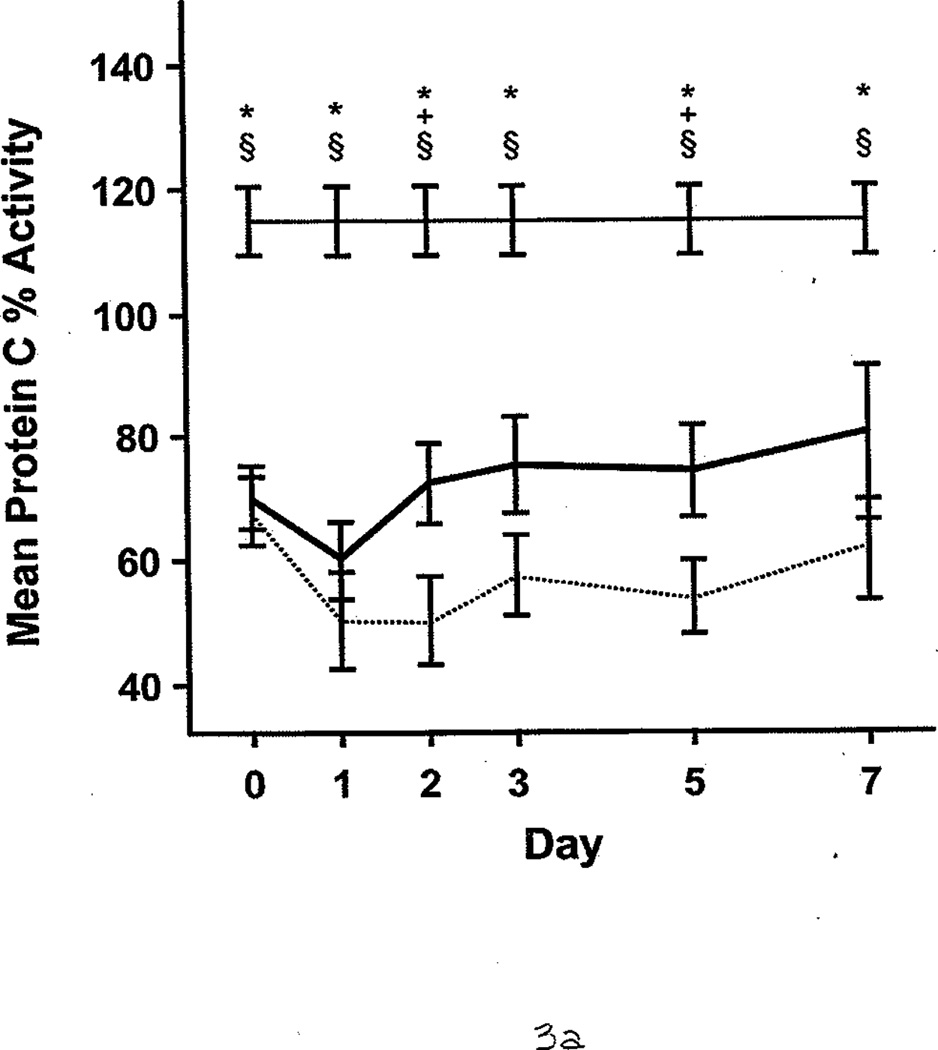
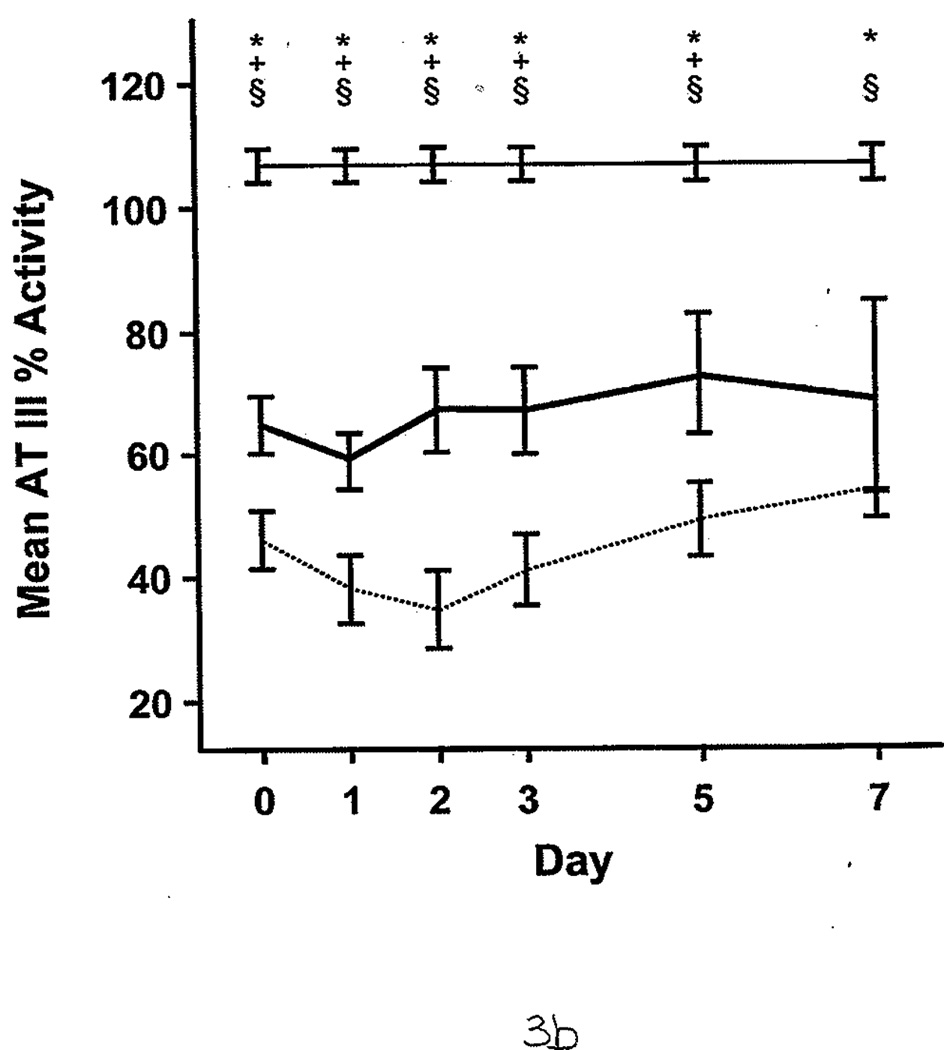
Protein C and Antithrombin III Percent Activities in Burned Patients, Nonburn Trauma Patients, and Control Subjects. Lines and symbols are same as described in the legend for Figure 1.
Figure 4.
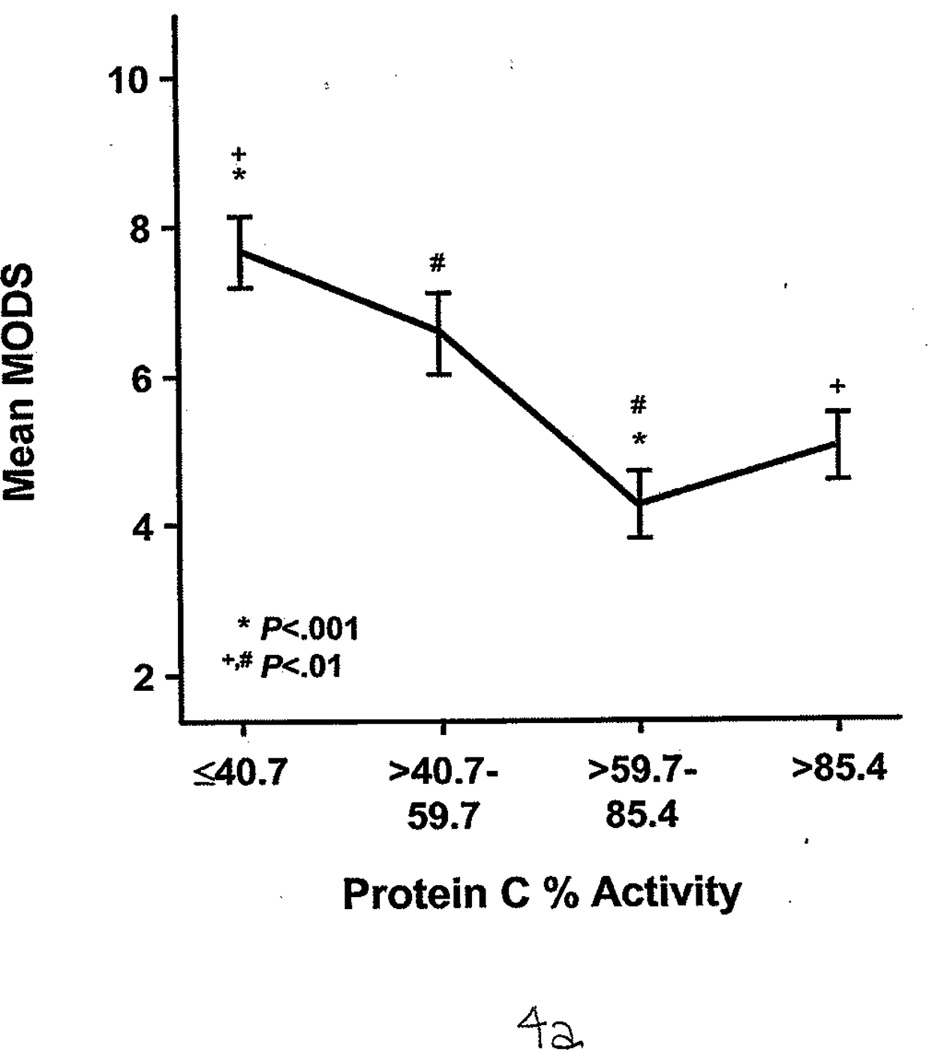
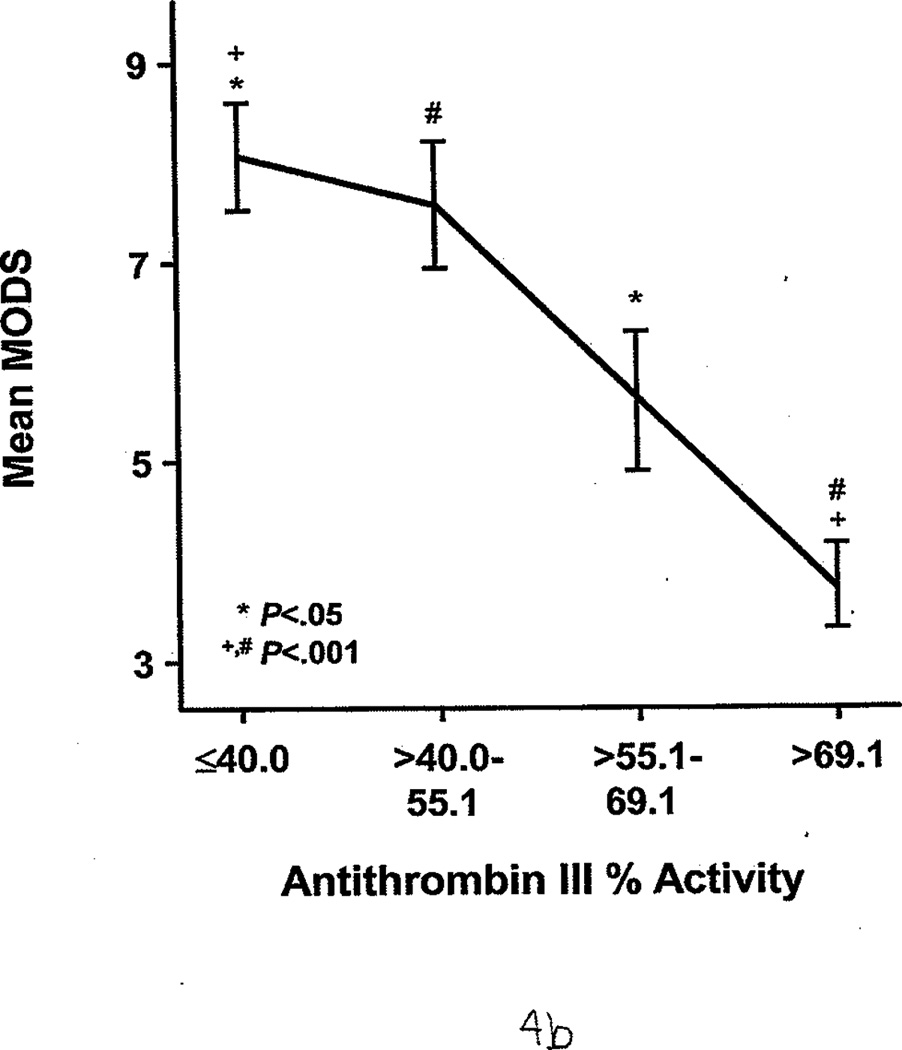
Protein C and Antithrombin III Percent Activities as Indirect Markers of Illness Severity. Both show an indirect association with the multiple organ dysfunction score (MODS). Identical symbols over each group indicate a significant difference between the 2 groups. A, Protein C percent activity, stratified by quartile. B, Antithrombin III percent activity, stratified by quartile. Essentially, the higher the MODS, the lower the protein C and antithrombin III percent activities.
Discussion
In this study, we evaluated plasma-based clotting assays (PT and aPTT) and whole-blood TEG analyses of critically injured patients. Only TEG showed that patients were in an overall hypercoagulable state for the first 7 days after injury. The TEG changes, ie, increase in α angle and MA, may be due to increased fibrinogen, an acute-phase protein. Lack of fibrinogen elevation after injury has been associated with poor survival after trauma and hepatectomy (35,36). Our group recently described 5 severely burned patients and showed that fibrinogen synthesis is accelerated relative to its breakdown when compared with age- and sex-matched controls (37). Furthermore, α angle and MA were significantly increased in those patients. Hence, increased fibrinogen synthesis may be an important factor in the postinjury hypercoagulable state observed in the current study.
Our 6% rate of VTE, which occurred despite pharmacologic DVT prophylaxis, was consistent with the rate reported by Geerts et al (38) in their landmark study comparing low-dose heparin and low-molecular-weight heparin in patients with major trauma. Our patients with VTE complications had significantly increased α angles and MA compared with controls, but TEG could not distinguish between patients with and without VTE complications. Recently, Cho and colleagues (39) presented work showing that the R time in patients with DVT development was significantly shorter than patients without DVT (6.1 [0.2] vs 7.6 [0.2] min; P<.001). Their study had mixed population of trauma patients (n=31) and general surgery patients (n=30) with a screening DVT rate of 28%. We have not observed any significant R time differences in our patient groups, but this may be because only 3 patients had development of VTE. We also did not perform screening duplex studies of our patients; it is unknown whether serial duplex studies of trauma patients are justifiable with regard to manpower and expense (40). Also, the clinical significance of nonocclusive, asymptomatic, infrapopliteal DVTs is controversial.
TEG Versus PT and aPTT
The apparent contradiction of PT and aPTT results and TEG results may be attributable to technical aspects of the 2 assays (41). By the most common methods, PT and aPTT assays detect changes in the turbidity of plasma as fibrinogen polymerization is initiated by adding tissue factor or kaolin, respectively. Both assays are performed at 37°C, regardless of the patient’s actual temperature, and they are further limited because they measure the time lag before fibrin polymerization starts and disregard interactions between platelets and fibrinogen or fibrin as clots form (5). Furthermore, PT and aPTT results do not give information about the overall strength of the clot or the rate of the turnover of the clot formed.
Kheirabadi and colleagues (42) have shown in a rabbit model that TEG is a better indicator of dilutional hypothermic coagulopathy than PT. Although PT was the same in the hypothermic, hemodiluted animals as it was in the controls, the α angle and MA were significantly reduced. Similarly, in our patients, TEG showed hypercoagulability in the blood that was not detected by PT or aPTT.
According to Kaufmann et al (2), the hypercoagulable state is defined by the presence of at least 2 of the following: shortened R time, increased α angle, and increased MA. On the basis of their study and studies by others (11,12,43), patients evidently enter a hypercoagulable state in response to tissue injury. In the current study, the R time for burned and nonburn trauma patients was not significantly longer than that of the controls, indicating that the coagulation factor activity preceding the initial fibrin platelet interaction was not deficient. However, subset analysis of the nonburn trauma patients showed that the group with blunt injuries had significantly shorter R time on the day of admission compared with the patients with penetrating injuries or the control group. This is consistent with work by Schreiber et al (12), who studied injured patients (97% of whom had blunt injuries) and reported that 60% had a shortened R time on day 1 after injury. Why patients with blunt injuries have a statistically shorter R time (ie, time to form the initial fibrin strands) compared with patients with penetrating injuries may be attributable to the extent of tissue damage. For example, the amount of soft-tissue trauma could be greater given a blunt injury than with a single stab wound; the greater volume of soft-tissue trauma may lead to greater augmentation of the proinflammatory and hypercoagulable response.
TEG and VTE
Our results showed that PT and aPTT were not accurate indicators of a postinjury hypercoagulable state. This is consistent with studies of patients undergoing general and orthopedic surgery, which showed that PT and aPTT are not reliable predictors of a clinically significant hypercoagulable state such as DVT. Milic et al (44) reported that PT and aPTT were similar in patients with and without DVT after cholecystectomy. In a study of 100 patients who were not receiving pharmacologic DVT prophylaxis before hallux valgus surgery, no differences in PT and aPTT were observed when comparing patients with and without postoperative DVT (P values were .14 and .29, respectively) (45).
Per our established clinical pathway guidelines, all but 2 patients in our study consistently received routine pharmacologic DVT prophylaxis and mechanical lower extremity compression. Despite routine use of pharmacologic DVT prophylaxis, TEG showed that patients were in a hypercoagulable state, and we observed a VTE rate of 6%. This rate is clinically significant, considering that almost all patients routinely and consistently received DVT prophylaxis. We note that DVT screening is not regularly performed at our institution, and subclinical VTEs may have been undiagnosed.
Hence, the question remains whether DVT prophylaxis should be tailored to the patient’s coagulation profile. Previous clinical studies using TEG showed that patients with cancer and postsurgical patients are in a hypercoagulable state compared with healthy controls and presurgical patients, respectively (46,47). Caprini et al (48) devised a TEG index (a formula to assess overall coagulation status that considers 8 TEG parameters), which was generated through multiple regression analysis of 90 patients with cancer and 90 healthy volunteers; the index had a sensitivity of 98% and a specificity of 100%. The model was validated with 31 patients with cancer and 51 volunteers and showed almost identical sensitivity and specificity. The authors of the report advocated adjustment of the subcutaneous heparin dosage in high-risk surgical patients and targeting the TEG index to a normal range (−2 to +2) (49). Prospective studies are challenging to do but are needed to show whether TEG-based titration of heparin prophylaxis reduces clinically significant VTE when compared with a control cohort matched for age, sex, and injury severity.
TEG and Fibrinolysis
Even though both patient groups in our study were in a hypercoagulable state early after injury, the nonburn trauma patients had accelerated fibrinolysis compared with controls, whereas burned patients did not have evidence of increased fibrinolysis until postinjury day 5. This is consistent with previously published studies of burned patients, which reported elevated fibrinolysis that peaked at 5 days to 2 weeks after injury (50,51).
TEG is more sensitive than routine, plasma-based tests (eg, D-dimer) for detecting a state of fibrinolysis. In a canine model with controlled levels of streptokinase, TEG could detect clot dissolution before changes were noted in plasma fibrinogen or plasminogen levels (52). The activated clotting time, PT, and aPTT do not provide information about fibrinolysis (they measure aspects of coagulation only up to the formation of the fibrin clot) (16). Furthermore, TEG fibrinolysis measurements do not necessarily correlate with D-dimer levels because fibrinogen can degrade into various split products other than D-dimers (53,54).
Hemostatic Balance
Blood coagulation is an essential physiologic process involving a delicate and dynamic balance between coagulation and anticoagulation. If either of these processes is defective, the balance is disturbed and hemorrhagic or thrombotic disorders can result. FXIa, a contact pathway coagulation factor, is generally thought to be activated by FXIIa. However, thrombin is a potent feedback activator of FXI. In other words, FXI can be activated independently of FXIIa (55–57). Hence, the TF-independent pathway may have a critical role in augmenting thrombin generation, with thrombin as its main stimulus. In the current study, only a small subset of patients (21/58) had plasma analyzed for FXIa. However, 38% of these patients had detectable FXIa (none was detected in the control group).
AT III is a serine protease inhibitor that is important in quenching the coagulation response, and its action is potentiated by heparinoids. Activated protein C is another key anticoagulant that is generated by the thrombomodulin-thrombin complex. Considerable AT III and protein C deficiency can occur after trauma (43). Furthermore, trauma patients with development of DVT have markedly lower AT III levels during the first week after injury compared with patients who do not have DVT (58). In the current study, AT III and protein C percent activities were significantly lower in all patients compared with controls. In particular, the burned patients had consistently lower AT III and protein C percent activities throughout the first 7 days after injury, and those with larger burns had lower values than those with smaller burns. The reasons for this may be 2-fold. First, lactated Ringer solution is administered for resuscitation, with the administered amount determined by the patient’s weight and %TBSA burned (59–61). Second, increased burn size means more injured tissue is leading to a hyperinflammatory state, which instigates the hypercoagulable state by consuming anticoagulant factors. Because we did not assess the metabolism of AT III and protein C in the current study, it remains to be shown whether a decrease in these anticoagulants after injury is attributable to their increased consumption or hemodilution, or if production of AT III and protein C in the liver decreases.
Limitations
This study had several limitations. First, coagulation profiles were not determined immediately after patients presented to the emergency department. The baseline blood samples were drawn after patients were transferred to the ICU (after initial evaluation in the emergency department or operating room). Second, we did not stratify patients on the basis of the amount or type of resuscitation fluids administered before the first blood sample was drawn. Although no patients were actively bleeding at the time of first blood draw, 15 of the 58 patients received blood products during the first 24 hours after admission. Third, only patients admitted to the ICU with an anticipated stay of at least 3 days were enrolled in the study, which may have introduced selection bias (only relatively sicker patients were enrolled), and we may have excluded others admitted into the ICU who were not in a hypercoagulable state.
Conclusion
In summary, the results of this study suggest that TEG is more sensitive than plasma-based clotting assays (PT or aPTT) for the detection of a hypercoagulable state in nonbleeding, burned or nonburn trauma patients. This hypercoagulable state may be partly due to a relative decrease in anticoagulant activity, as evidenced by decreased AT III and protein C percent activities and increased fibrinogen levels. Despite routine use of DVT prophylaxis, both groups of patients were in a hypercoagulable state early after injury, and the symptomatic VTE rate was 6%. The preliminary data presented in this report suggest that TEG can be an additional method of assessing the effectiveness of pharmacologic DVT prophylaxis in a patient population that is at high risk for VTE complications. Additional studies should include a larger number of patients to show whether TEG can identify the subset of patients at risk of clinically significant VTE even with pharmacologic prophylaxis.
Acknowledgment
The authors deeply thank Nancy Molter, RN, MN, PhD, Elizabeth Frail, RN, BSN, Peggy Bielke, RN, BSN, Kari L. Williams, RN, BSN, and Nik Kypreos for their assistance in this study. We are grateful for editorial support by Amy Newland. We appreciate support received from the Laboratory Support Branch at the US Army Institute of Surgical Research and the Department of Biochemistry, University of Vermont.
This study was supported by the US Army Medical Research and Medical Command. The opinions or assertions contained herein are the private views of the authors and are not to be construed as official or as reflecting the views of the Department of the Army or the Department of Defense (AR 360-5).
Abbreviations
- %TBSA
percent of the total body surface area
- aPTT
activated partial thromboplastin time
- AT III
antithrombin III
- DVT
deep vein thrombosis
- EDTA
ethylenediamine tetraacetic acid
- FXIa
activated coagulation factor XI
- ICU
intensive care unit
- LY30
clot lysis after 30 minutes
- MA
maximal amplitude
- PT
prothrombin time
- TEG
thromboelastogram, thromboelastography
- TF
tissue factor
- TTG
total thrombus generation
- VTE
venothromboembolic
Footnotes
This paper was the subject of an oral presentation at the 21st Eastern Association for the Surgery of Trauma, Amelia Island Plantation, Florida, 2008.
Conflict of interest: None
References
- 1.Brohi K, Singh J, Heron M, Coats T. Acute traumatic coagulopathy. J Trauma. 2003 Jun;54(6):1127–1130. doi: 10.1097/01.TA.0000069184.82147.06. [DOI] [PubMed] [Google Scholar]
- 2.Kaufmann CR, Dwyer KM, Crews JD, Dols SJ, Trask AL. Usefulness of thrombelastography in assessment of trauma patient coagulation. J Trauma. 1997 Apr;42(4):716–720. doi: 10.1097/00005373-199704000-00023. [DOI] [PubMed] [Google Scholar]
- 3.Geerts WH, Code KI, Jay RM, Chen E, Szalai JP. A prospective study of venous thromboembolism after major trauma. N Engl J Med. 1994 Dec 15;331(24):1601–1606. doi: 10.1056/NEJM199412153312401. [DOI] [PubMed] [Google Scholar]
- 4.Essell JH, Martin TJ, Salinas J, Thompson JM, Smith VC. Comparison of thromboelastography to bleeding time and standard coagulation tests in patients after cardiopulmonary bypass. J Cardiothorac Vasc Anesth. 1993 Aug;7(4):410–415. doi: 10.1016/1053-0770(93)90161-d. [DOI] [PubMed] [Google Scholar]
- 5.Schreiber MA. Coagulopathy in the trauma patient. Curr Opin Crit Care. 2005 Dec;11(6):590–597. doi: 10.1097/01.ccx.0000186374.49320.ab. [DOI] [PubMed] [Google Scholar]
- 6.Kang Y. Thromboelastography in liver transplantation. Semin Thromb Hemost. 1995;21(Suppl 4):34–44. [PubMed] [Google Scholar]
- 7.Spiess BD, Gillies BS, Chandler W, Verrier E. Changes in transfusion therapy and reexploration rate after institution of a blood management program in cardiac surgical patients. J Cardiothorac Vasc Anesth. 1995 Apr;9(2):168–173. doi: 10.1016/S1053-0770(05)80189-2. [DOI] [PubMed] [Google Scholar]
- 8.Spiess BD. Thromboelastography and cardiopulmonary bypass. Semin Thromb Hemost. 1995;21(Suppl 4):27–33. [PubMed] [Google Scholar]
- 9.Shore-Lesserson L, Manspeizer HE, DePerio M, Francis S, Vela-Cantos F, Ergin MA. Thromboelastography-guided transfusion algorithm reduces transfusions in complex cardiac surgery. Anesth Analg. 1999 Feb;88(2):312–319. doi: 10.1097/00000539-199902000-00016. [DOI] [PubMed] [Google Scholar]
- 10.Plotkin AJ, Wade CE, Jenkins DH, Smith KA, Noe JC, Park MS, et al. A reduction in clot formation rate and strength assessed by thrombelastography is indicative of transfusion requirements in patients with penetrating injuries. J Trauma. 2008 Feb;64(2 Suppl):S64–S68. doi: 10.1097/TA.0b013e318160772d. [DOI] [PubMed] [Google Scholar]
- 11.Watts DD, Trask A, Soeken K, Perdue P, Dols S, Kaufmann C. Hypothermic coagulopathy in trauma: effect of varying levels of hypothermia on enzyme speed, platelet function, and fibrinolytic activity. J Trauma. 1998 May;44(5):846–854. doi: 10.1097/00005373-199805000-00017. [DOI] [PubMed] [Google Scholar]
- 12.Schreiber MA, Differding J, Thorborg P, Mayberry JC, Mullins RJ. Hypercoagulability is most prevalent early after injury and in female patients. J Trauma. 2005 Mar;58(3):475–480. doi: 10.1097/01.ta.0000153938.77777.26. [DOI] [PubMed] [Google Scholar]
- 13.Drost AC, Burleson DG, Cioffi WG, Jr, Jordan BS, Mason AD, Jr, Pruitt BA., Jr Plasma cytokines following thermal injury and their relationship with patient mortality, burn size, and time postburn. J Trauma. 1993 Sep;35(3):335–339. doi: 10.1097/00005373-199309000-00001. [DOI] [PubMed] [Google Scholar]
- 14.Gando S, Nakanishi Y, Tedo I. Cytokines and plasminogen activator inhibitor-1 in posttrauma disseminated intravascular coagulation: relationship to multiple organ dysfunction syndrome. Crit Care Med. 1995 Nov;23(11):1835–1842. doi: 10.1097/00003246-199511000-00009. [DOI] [PubMed] [Google Scholar]
- 15.Utter GH, Owings JT, Jacoby RC, Gosselin RC, Paglieroni TG. Injury induces increased monocyte expression of tissue factor: factors associated with head injury attenuate the injury-related monocyte expression of tissue factor. J Trauma. 2002 Jun;52(6):1071–1077. doi: 10.1097/00005373-200206000-00008. [DOI] [PubMed] [Google Scholar]
- 16.Drake TA, Ruf W, Morrissey JH, Edgington TS. Functional tissue factor is entirely cell surface expressed on lipopolysaccharide-stimulated human blood monocytes and a constitutively tissue factor-producing neoplastic cell line. J Cell Biol. 1989 Jul;109(1):389–395. doi: 10.1083/jcb.109.1.389. [DOI] [PMC free article] [PubMed] [Google Scholar]
- 17.Neumann FJ, Ott I, Marx N, Luther T, Kenngott S, Gawaz M, et al. Effect of human recombinant interleukin-6 and interleukin-8 on monocyte procoagulant activity. Arterioscler Thromb Vasc Biol. 1997 Dec;17(12):3399–3405. doi: 10.1161/01.atv.17.12.3399. [DOI] [PubMed] [Google Scholar]
- 18.Schwager I, Jungi TW. Effect of human recombinant cytokines on the induction of macrophage procoagulant activity. Blood. 1994 Jan 1;83(1):152–160. [PubMed] [Google Scholar]
- 19.Edgington TS, Mackman N, Brand K, Ruf W. The structural biology of expression and function of tissue factor. Thromb Haemost. 1991 Jul 12;66(1):67–79. [PubMed] [Google Scholar]
- 20.Bouma BN, Griffin JH. Human blood coagulation factor XI: purification, properties, and mechanism of activation by activated factor XII. J Biol Chem. 1977 Sep 25;252(18):6432–6437. [PubMed] [Google Scholar]
- 21.Kleinschnitz C, Stoll G, Bendszus M, Schuh K, Pauer HU, Burfeind P, et al. Targeting coagulation factor XII provides protection from pathological thrombosis in cerebral ischemia without interfering with hemostasis. J Exp Med. 2006 Mar 20;203(3):513–518. doi: 10.1084/jem.20052458. Epub 2006 Mar 13. [DOI] [PMC free article] [PubMed] [Google Scholar]
- 22.Minnema MC, Peters RJ, de Winter R, Lubbers YP, Barzegar S, Bauer KA, et al. Activation of clotting factors XI and IX in patients with acute myocardial infarction. Arterioscler Thromb Vasc Biol. 2000 Nov;20(11):2489–2493. doi: 10.1161/01.atv.20.11.2489. [DOI] [PubMed] [Google Scholar]
- 23.Coppola R, Cristilli P, Cugno M, Ariens RA, Mari D, Mannucci PM. Measurement of activated factor XII in health and disease. Blood Coagul Fibrinolysis. 1996 Jul;7(5):530–535. doi: 10.1097/00001721-199607000-00004. [DOI] [PubMed] [Google Scholar]
- 24.Butenas S, Undas A, Gissel MT, Szuldrzynski K, Zmudka K, Mann KG. Factor XIa and tissue factor activity in patients with coronary artery disease. Thromb Haemost. 2008 Jan;99(1):142–149. doi: 10.1160/TH07-08-0499. [DOI] [PubMed] [Google Scholar]
- 25.Jordan RE, Oosta GM, Gardner WT, Rosenberg RD. The kinetics of hemostatic enzyme-antithrombin interactions in the presence of low molecular weight heparin. J Biol Chem. 1980 Nov 10;255(21):10081–10090. [PubMed] [Google Scholar]
- 26.Olson ST, Shore JD. Binding of high affinity heparin to antithrombin III: characterization of the protein fluorescence enhancement. J Biol Chem. 1981 Nov 10;256(21):11065–11072. [PubMed] [Google Scholar]
- 27.Bock SC. Antithrombin III and heparin cofactor II. In: Colman RW, Marder VJ, Clowes AW, George JN, Goldhaber SZ, editors. Hemostasis and thrombosis: basic principles and clinical practice. 5th ed. Philadelphia: Lippincott Williams & Wilkins; c2006. pp. 235–248. [Google Scholar]
- 28.van't Veer C, Mann KG. Regulation of tissue factor initiated thrombin generation by the stoichiometric inhibitors tissue factor pathway inhibitor, antithrombin-III, and heparin cofactor-II. J Biol Chem. 1997 Feb 14;272(7):4367–4377. doi: 10.1074/jbc.272.7.4367. [DOI] [PubMed] [Google Scholar]
- 29.Baugh RJ, Broze GJ, Jr, Krishnaswamy S. Regulation of extrinsic pathway factor Xa formation by tissue factor pathway inhibitor. J Biol Chem. 1998 Feb 20;273(8):4378–4386. doi: 10.1074/jbc.273.8.4378. [DOI] [PubMed] [Google Scholar]
- 30.Broze GJ, Jr, Warren LA, Novotny WF, Higuchi DA, Girard JJ, Miletich JP. The lipoprotein-associated coagulation inhibitor that inhibits the factor VII-tissue factor complex also inhibits factor Xa: insight into its possible mechanism of action. Blood. 1988 Feb;71(2):335–343. [PubMed] [Google Scholar]
- 31.Esmon CT. The anticoagulant and anti-inflammatory roles of the protein C anticoagulant pathway. J Autoimmun. 2000 Sep;15(2):113–116. doi: 10.1006/jaut.2000.0400. [DOI] [PubMed] [Google Scholar]
- 32.Esmon C. The protein C pathway. Crit Care Med. 2000 Sep;28(9 Suppl):S44–S48. doi: 10.1097/00003246-200009001-00010. [DOI] [PubMed] [Google Scholar]
- 33.Rivard GE, Brummel-Ziedins KE, Mann KG, Fan L, Hofer A, Cohen E. Evaluation of the profile of thrombin generation during the process of whole blood clotting as assessed by thrombelastography. J Thromb Haemost. 2005 Sep;3(9):2039–2043. doi: 10.1111/j.1538-7836.2005.01513.x. [DOI] [PMC free article] [PubMed] [Google Scholar]
- 34.Marshall JC, Cook DJ, Christou NV, Bernard GR, Sprung CL, Sibbald WJ. Multiple organ dysfunction score: a reliable descriptor of a complex clinical outcome. Crit Care Med. 1995 Oct;23(10):1638–1652. doi: 10.1097/00003246-199510000-00007. [DOI] [PubMed] [Google Scholar]
- 35.Giovannini I, Chiarla C, Giuliante F, Vellone M, Nuzzo G. Modulation of plasma fibrinogen levels in acute-phase response after hepatectomy. Clin Chem Lab Med. 2004 Mar;42(3):261–265. doi: 10.1515/CCLM.2004.048. [DOI] [PubMed] [Google Scholar]
- 36.Attar S, Boyd D, Layne E, McLaughlin J, Mansberger AR, Cowley RA. Alterations in coagulation and fibrinolytic mechanisms in acute trauma. J Trauma. 1969 Nov;9(11):939–965. doi: 10.1097/00005373-196911000-00004. [DOI] [PubMed] [Google Scholar]
- 37.Martini WZ, Wolf SE, Chinkes DL, Yu YM, Molter N, Pidcoke HF, et al. Accelerated fibrinogen metabolism and coagulation in severely burned adults. Poster session presented at: 14th Congress of the International Society of Burn Injury; 7–11 September 2008; Montreal, Quebec. [Google Scholar]
- 38.Geerts WH, Jay RM, Code KI, Chen E, Szalai JP, Saibil EA, et al. A comparison of low-dose heparin with low-molecular-weight heparin as prophylaxis against venous thromboembolism after major trauma. N Engl J Med. 1996 Sep 5;335(10):701–707. doi: 10.1056/NEJM199609053351003. [DOI] [PubMed] [Google Scholar]
- 39.Cho SD, Morris MS, Underwood SA, Watters JM, Schreiber MA. Thromboelastography Vs anti-factor Xa levels in the assessment of prophylactic-dose enoxaparin in critically ill patients. Paper presented at: 67th annual meeting of the American Association for the Surgery of Trauma; 2008 Sep 24–27; Maui, Hawaii. [Google Scholar]
- 40.Geerts WH, Bergqvist D, Pineo GF, Heit JA, Samama CM, Lassen MR, et al. American College of Chest Physicians. Prevention of venous thromboembolism: American College of Chest Physicians Evidence-Based Clinical Practice Guidelines (8th Edition) Chest. 2008 Jun;133(6 Suppl):381S–453S. doi: 10.1378/chest.08-0656. [DOI] [PubMed] [Google Scholar]
- 41.Pusateri AE, Park MS. Mechanistic implications for the use and monitoring of recombinant activated factor VII in trauma. Crit Care. 2005;9(Suppl 5):S15–S24. doi: 10.1186/cc3781. Epub 2005 Oct 7. [DOI] [PMC free article] [PubMed] [Google Scholar]
- 42.Kheirabadi BS, Crissey JM, Deguzman R, Holcomb JB. In vivo bleeding time and in vitro thrombelastography measurements are better indicators of dilutional hypothermic coagulopathy than prothrombin time. J Trauma. 2007 Jun;62(6):1352–1359. doi: 10.1097/TA.0b013e318047b805. [DOI] [PubMed] [Google Scholar]
- 43.Engelman DT, Gabram SG, Allen L, Ens GE, Jacobs LM. Hypercoagulability following multiple trauma. World J Surg. 1996 Jan;20(1):5–10. doi: 10.1007/s002689900001. [DOI] [PubMed] [Google Scholar]
- 44.Milic DJ, Pejcic VD, Zivic SS, Jovanovic SZ, Stanojkovic ZA, Jankovic RJ, et al. Coagulation status and the presence of postoperative deep vein thrombosis in patients undergoing laparoscopic cholecystectomy. Surg Endosc. 2007 Sep;21(9):1588–1592. doi: 10.1007/s00464-006-9179-3. Epub 2007 Mar 1. [DOI] [PubMed] [Google Scholar]
- 45.Radl R, Kastner N, Aigner C, Portugaller H, Schreyer H, Windhager R. Venous thrombosis after hallux valgus surgery. J Bone Joint Surg Am. 2003 Jul;85-A(7):1204–1208. doi: 10.2106/00004623-200307000-00004. [DOI] [PubMed] [Google Scholar]
- 46.Caprini JA, Natonson RA. Postoperative deep vein thrombosis: current clinical considerations. Semin Thromb Hemost. 1989 Jul;15(3):244–249. doi: 10.1055/s-2007-1002714. [DOI] [PubMed] [Google Scholar]
- 47.Arcelus JI, Traverso CI, Caprini JA. Thromboelastography for the assessment of hypercoagulability during general surgery. Semin Thromb Hemost. 1995;21(Suppl 4):21–26. doi: 10.1055/s-0032-1313617. [DOI] [PubMed] [Google Scholar]
- 48.Caprini JA, Zuckerman L, Cohen E, Vagher JP, Lipp V. The identification of accelerated coagulability. Thromb Res. 1976 Aug;9(2):167–180. doi: 10.1016/0049-3848(76)90161-4. [DOI] [PubMed] [Google Scholar]
- 49.Caprini JA, Arcelus JI, Goldshteyn S, Hoffman KN, Coats RW., 2nd Thromboelastography: measuring statistical probabilities. Semin Thromb Hemost. 1995;21(Suppl 4):14–20. doi: 10.1055/s-0032-1313616. [DOI] [PubMed] [Google Scholar]
- 50.Alkjaersig N, Fletcher AP, Peden JC, Jr, Monafo WW. Fibrinogen catabolism in burned patients. J Trauma. 1980 Feb;20(2):154–159. doi: 10.1097/00005373-198002000-00009. [DOI] [PubMed] [Google Scholar]
- 51.Curreri PW, Wilterdink ME, Baxter CR. Characterization of elevated fibrin split products following thermal injury. Ann Surg. 1975 Feb;181(2):157–160. doi: 10.1097/00000658-197502000-00005. [DOI] [PMC free article] [PubMed] [Google Scholar]
- 52.Summaria L, Sandesara J, Yang G, Vagher JP, Caprini JA. In vitro comparison of fibrinolytic activity of plasminogen activators using a thrombelastographic method: in vivo evaluation of the B-chain-streptokinase complex in the dog model using pre-titered doses. Thromb Haemost. 1986 Aug 20;56(1):71–79. [PubMed] [Google Scholar]
- 53.Van Riper DF, Horrow JC, Osborne D. Is the thromboelastograph a clinically useful predictor of blood loss after bypass [abstract]? Anesthesiology. 1990 Sep;73(3A) Abstract no. A1206. [Google Scholar]
- 54.Whitten CW, Allison PH, Latson TW, Elmore J, Gulden RH, Burkhardt D, et al. Thromboelastographic fibrinolysis does not correlate with levels of d-dimers after cardiopulmonary bypass [abstract] Anesthesiology. 1991 Sep;75(3) Abstract no. A431. [Google Scholar]
- 55.Baglia FA, Walsh PN. Thrombin-mediated feedback activation of factor XI on the activated platelet surface is preferred over contact activation by factor XIIa or factor XIa. J Biol Chem. 2000 Jul 7;275(27):20514–20519. doi: 10.1074/jbc.M000464200. Retraction in: J Biol Chem. 2007 Sep 28;282(39) 29067. [DOI] [PubMed] [Google Scholar]
- 56.Gailani D, Broze GJ., Jr Factor XI activation in a revised model of blood coagulation. Science. 1991 Aug 23;253(5022):909–912. doi: 10.1126/science.1652157. [DOI] [PubMed] [Google Scholar]
- 57.Yun TH, Baglia FA, Myles T, Navaneetham D, Lopez JA, Walsh PN, et al. Thrombin activation of factor XI on activated platelets requires the interaction of factor XI and platelet glycoprotein Ib alpha with thrombin anion-binding exosites I and II, respectively. J Biol Chem. 2003 Nov 28;278(48):48112–48119. doi: 10.1074/jbc.M306925200. Epub 2003 Sep 10. Partial retraction in: J Biol Chem 2007 Sep 28;282(39): 29067. [DOI] [PubMed] [Google Scholar]
- 58.Owings JT, Bagley M, Gosselin R, Romac D, Disbrow E. Effect of critical injury on plasma antithrombin activity: low antithrombin levels are associated with thromboembolic complications. J Trauma. 1996 Sep;41(3):396–405. doi: 10.1097/00005373-199609000-00004. [DOI] [PubMed] [Google Scholar]
- 59.Cotton BA, Guy JS, Morris JA, Jr, Abumrad NN. The cellular, metabolic, and systemic consequences of aggressive fluid resuscitation strategies. Shock. 2006 Aug;26(2):115–121. doi: 10.1097/01.shk.0000209564.84822.f2. [DOI] [PubMed] [Google Scholar]
- 60.Kiraly LN, Differding JA, Enomoto TM, Sawai RS, Muller PJ, Diggs B, et al. Resuscitation with normal saline (NS) vs. lactated ringers (LR) modulates hypercoagulability and leads to increased blood loss in an uncontrolled hemorrhagic shock swine model. J Trauma. 2006 Jul;61(1):57–64. doi: 10.1097/01.ta.0000220373.29743.69. [DOI] [PubMed] [Google Scholar]
- 61.Rhee P, Burris D, Kaufmann C, Pikoulis M, Austin B, Ling G, et al. Lactated Ringer's solution resuscitation causes neutrophil activation after hemorrhagic shock. J Trauma. 1998 Feb;44(2):313–319. doi: 10.1097/00005373-199802000-00014. [DOI] [PubMed] [Google Scholar]