

Abstract
Cassava is an important crop that provides food security and income generation in many tropical countries and is known for its adaptability to various environmental conditions. Despite its global importance, the development of cassava microarray tools has not been well established. Here, we describe the development of a 60-mer oligonucleotide Agilent microarray representing ∼20 000 cassava genes and how it can be applied to expression profiling under drought stress using three cassava genotypes (MTAI16, MECU72 and MPER417-003). Our results identified about 1300 drought stress up-regulated genes in cassava and indicated that cassava has similar mechanisms for drought stress response and tolerance as other plant species. These results demonstrate that our microarray is a useful tool for analysing the cassava transcriptome and that it is applicable for various cassava genotypes.
Keywords: cassava, DNA microarray, expression profile, transcriptome
1. Introduction
Cassava, Manihot esculenta Crantz, is a tropical crop that is important for food security and income generation for many poor farmers in several Asian and African countries. More than 240 million tons of cassava are produced per year, and cassava serves as the primary food source for >750 million people. Cassava is one of the most efficient producers of carbohydrates and energy among all the food crops.1 Cassava is known for its adaptability to different soils and environmental conditions, particularly for its tolerance to drought. Cassava can withstand short and longest period of drought of around 4–6 months.2 The drought stress response in cassava is followed by dehydration avoidance through deep root system, closure of stomata in dry air, and shedding of older leaves in which these features are effective for survival under drought conditions. Upon recovery from water stress, cassava rapidly regenerates new leaves and leaf area index becomes higher compared with non-stressed plants.3
Partial sequencing of cDNA clones has been used as an effective method for gene discovery and in the last decade, the development of several EST collections has led to functional genomics studies in several plant species.4,5 Large-scale cassava EST sequencing projects have been performed in various cassava research groups.2,6,7 Sakurai et al. constructed a full-length cDNA enriched library from cassava leaves and roots subjected to drought, heat, and acidic stress treatments, as well as from roots subjected to post-harvest physiological deterioration (PPD), a major obstacle for cassava commercialization.8 The cassava genome sequence is now publicly available and the initial assembly spans 419.5 Mb, covering 54% of the estimated cassava genome size (770 Mb).9 At present, 30 666 protein-coding genes have been predicted from the genome sequence and 3485 alternative splice forms have been supported by the ESTs.9
Microarray technology has demonstrated the power of high-throughput approaches to unravel key biological processes and identify useful candidate genes and promoters for genetic engineering.10–12 In cassava, a cDNA microarray containing ∼5700 unique cassava cDNA sequences has been prepared and used for studying expression profiles in response to Xanthomonas axonopodis pv. manihotis infection and during the PPD response.13,14 Oligo-DNA microarrays are gradually gaining importance due to the number of genes contained on each microarray, easier management of the system, and a greater dynamic range in the evaluation of expression levels.15,16 Recently, Yang et al.17 prepared an Agilent 60-mer oligo microarray representing ∼20 000 genes and applied this microarray to study the expression profile of cassava genes during the tuberization process. Although previous studies using cassava microarrays have provided valuable transcriptome information towards cassava molecular breeding, no reports on the cassava microarray studies under drought stress have been reported and only one genotype was used in the previous microarray studies.
More than 6500 cassava germplasm accessions with varying phenotypes for biomass, abiotic stress tolerance, and resistance to harmful pathogens are available from the Genetic Resources Program of CIAT (http://isa.ciat.cgiar.org/urg/).18 Therefore, it is necessary to develop a cassava microarray that can be applied to various cassava genotypes that is essential for identifying useful genes for genetic engineering and advancing molecular breeding in cassava.
In this study, we used three useful cassava genotypes: MTAI16 (also called KU50), MECU72, and MPER417-003. The detailed information for the three genotypes is shown in Section 2. Here we apply our newly developed cassava oligomicroarray to study the expression profile under drought stress and report that our cassava oligomicroarray can be used for analysing the cassava transcriptome in various cassava genotypes.
2. Materials and methods
2.1. Plant materials and drought stress treatment
The three cassava genotypes for the microarray analysis were used: (i) MTAI16 (also known as KU50), which is one of the most important cassava genotype (M. esculenta Crantz), especially in Southeast Asia (including Thailand). It was developed through cross-breeding between Rayong 1 and Rayong 90 by breeders of the Kasetsart University, Department of Agriculture, Ministry of Agriculture and CIAT, and released officially in 1993 (http://www.tapiocathai.org/English/K2_e.html). It has high root yield, high starch content in root tubers, and vigorous plant growth with wide adaptability to unfavourable environmental conditions19,20. (ii) MECU72, a naturally occurring cassava genotype (M. esculenta Crantz) with whitefly (Aleurotrachelus socialis) resistance and was isolated in Ecuador and (iii) MPER417-003, a wild landrace of M. esculenta subsp. peruviana, which shows resistance to whitefly and mealybug (Phenococcus herreni). MTAI16 and MECU72 might be closely related, because they are classified as the same species. Previous polymorphism studies using AFLP and RAPD markers reported that the mean genetic similarity between M. esculenta and M. peruviana was 0.59, suggesting that M. esculenta and M. peruviana are closely related when compared with between M. esculenta and other wild species.21,22 Previously, the impact of water stress on yield and quality of cassava starch was studied in six varieties and this study indicated that MTAI16 recovered quickly from water stress and also had high starch content under recovery after drought stress compared with other varieties studied.19 No studies on drought stress tolerance in MECU72 and MPER417-003 have been reported.
The preparation of in vitro cassava plantlets was performed as follows: after plantlets were sterilized with 1% sodium hypochlorite solution, the plantlet was transferred to a glass pot with Murashige and Skoog (MS) media (pH5.8) containing 20 g/l sucrose, 4.4 g/l MS salts containing vitamins (Duchefa), 2 µM CuSO4 (Wako), and 3.0 g/l gelrite (Wako). After cutting ∼2–3 cm from the shoot top of the cassava plantlets, three shoot cuttings were transferred to a glass pot with the MS media and grown under 16-h illumination of 40–80 μmol photons m−2 s−1 at 30°C. The roots were formed from the sections of the cutting shoots and the plantlets were grown until ∼5 cm high during 1 month and then used as experimental materials. The phenotypes of these genotypes under non-treated conditions were very similar (Fig. 1). For the untreated control samples, the shoots were harvested and frozen in liquid nitrogen. The plantlets were also subjected to drought treatment by transferring the plantlets from the glass pot onto a plastic plate and maintaining them for 1 h under 40–80 μmol photons m−2 s−1 at 30°C in 50% relative humidity. After the drought stress treatment, all of the leaves from the three cassava genotypes wilted (Fig. 1). After removing roots from the plantlets, the shoots were immediately frozen in liquid nitrogen and stored at −80°C until the RNA preparation. Three independent biological replicative experiments were performed for each treatment and each genotype as follows: (i) MTAI16 (untreated control), (ii) MTAI16 (1 h drought treatment), (iii) MECU72 (untreated control), (iv) MECU72 (1 h drought treatment), (v) MPER417-003 (untreated control), and (vi) MPER417-003 (1 h drought treatment).
Figure 1.

Phenotype of cassava genotypes after 1-h drought-stress treatment.
2.2. RNA extraction
Total RNA was extracted from six shoots (∼800 mg fresh weight (FW)) per experiment using an RNeasy Plant Mini Kit (QIAGEN) according to the manufacturer's instructions (QIAGEN). The total RNA extracts were treated with RNase-free DNase I (QIAGEN) to completely remove genomic DNA. The total RNA quality was evaluated with electrophoresis using the Bioanalyzer system (Agilent). The extracted total RNA was stored at −80°C until further use.
2.3. Oligomicroarray design
Figure 2 shows an overview of the development of our cassava oligomicroarray. We retrieved 76 566 ESTs and 86 cDNA (from high-throughput cDNA category) sequences from GenBank in February 2009 as starting sequences for the microarray probe design. The sequences used are derived from various cassava genotypes, such as MTAI16, CAS36.01, CAS36.04, CM21772, CM523-7, MCol22, IAC 12.829, MBra685, MCol1522, MNga2, MPer183, Mirassol, SG107-35, Sauti, Gomani, Mbundumali, TME 1, MkondeziTMS30572, and CM2177-2. Some sequences deposited in GenBank were contaminated by non-native sequences derived from cloning vectors, bacterial hosts, and other sources. In addition, abundant repetitive elements in a sequence set decreased our ability to accurately assemble the sequence. Therefore, contamination and repetitive elements in the retrieved sequences were masked via the cross match program in the Phred/Phrap package23 by using the −minmatch 10 −minscore 20 parameters and comparison with the NCBI UniVec and MSU Plant Repeat Database, respectively. Similarly, polyA and polyT sequences were also masked. We then omitted sequences that are shorter than 100 bp from the design process. In order to eliminate the sequence redundancy, the remaining sequences were assembled with the CAP3 program24 by using the -p 95 parameter. This condition is tighter than one for redundancy omission alone. All the public ESTs which were used in our assembly were not deposited as the sense strand and the contigous sequences in our assembly included antisense sequences. Therefore, we evaluated the contiguous sequences using the public protein sequence sets. The sense strands of the assembled sequences were evaluated using the BLASTX program25 against the three databases, NCBI RefSeq plant (released January 20, 2009),26 UniProt TrEMBL plant (released 3 March 2009),27 and the predicted protein sequences from poplar (JGI Poptr1_1) and castor bean genome sequences (GenBank accession numbers EQ973772–EQ999533). We identified the sequence that aligned with the three protein sequence sets with the same translation frame as the appropriate sequence for the microarray probe design.
Figure 2.

Design of the cassava oligo-DNA microarray.
Finally, the sequences filtered through the sense direction evaluation were submitted to the eArray application (https://earray.chem.agilent.com/earray/) of Agilent Technologies (Santa Clara, CA, USA) to design the 60-mer oligomicroarray probes using ‘Best probe methodology’ and ‘Design with 3′ bias’ options in order to prevent the occurrence of cross-hybridization. Note that only 2.6 and 0.6% had >80 and 90%, respectively, similarity with other probes on the array (Supplementary Table S1). About 60% of the probes had >1-bp overlap with the structural portion of genes. Sixty probes are added as non-plant or negative/positive control sequences on the array. The information is available at the Gene Expression Omnibus (GEO), accession number GPL14139.
2.4. Microarray hybridization
Cyanine-3 (Cy3)-labeled cRNA was prepared from 0.5 μg of total RNA using the Quick Amp Labeling kit (Agilent Technologies) according to the manufacturer's instructions (http://www.chem.agilent.com/Library/usermanuals/Public/G4140-90040_GeneExpression_One-color_v6.5.pdf), followed by RNeasy column purification (Qiagen). Dye incorporation and cRNA yield were checked with the NanoDrop ND-1000 Spectrophotometer. The Cy3-labelled cRNA (1.65 μg) was fragmented at 60°C for 30 min according to the manufacturer's instructions. Agilent hybridization buffer was then added to the fragmentation mixture and hybridized to the Agilent microarray (GPL14139) for 17 h at 65°C in a rotating Agilent hybridization oven. After hybridization, the microarrays were washed using the optimized protocol (http://www.chem.agilent.com/Library/usermanuals/Public/G4140-90040_GeneExpression_One-color_v6.5.pdf) recommended by Agilent technologies. Slides were scanned immediately after washing on the Agilent DNA Microarray Scanner (G2505B) using one color scan setting for 4 × 44 K array slides. Signal intensities were detected from the obtained digital images using Feature Extraction software (Ver. 9.1; Agilent Technologies). Three independent biological replicative experiments were performed for each treatment and for each genotype.
2.5. Microarray data analysis
Total 18 expression data obtained by microarray analysis were exported to GeneSpring GX (Agilent Technologies) and per chip normalization to the quantile expression level and per gene normalization to the median expression intensity were performed in all samples. Data were transformed into the log 2 ratio for display and analysis. The following calculations were performed according to the manufacturer's instructions of GeneSpring GX. Briefly, the microarray data were filtered to remove control probe sets and those probe sets with an intensity value close to background levels. The remaining genes were filtered based on the deviation of the intensity values within a condition. The remaining genes were placed together in one list. The genes selected in this way were further filtered to remove those probe sets whose expression change under all experimental conditions was below a threshold, based on median normalized intensity values, which was considered to be the no-change threshold. The resulting working gene list of transcripts for each experiment was used for the statistical analysis. To test for differential expression, an analysis of variance test was carried out between non-treated and drought-treated samples. The changes in gene expression were statistically analysed by the unpaired t-test (threshold was set at P< 0.01) for two groups (non-treated and drought-treated samples). The false discovery rate (q-value) was calculated for each P value according to the method of Benjamini and Hochberg (1995).28 The information from the cassava oligomicroarray is available at the GEO of NCBI. The accession numbers are Platform, GPL14139; Series, GSE31749; Samples, GSM787966–GSM787983.
When the total 21 522 sequences on the array were searched by BLASTX program against 35 176 Arabidopsis protein sequence data sets in the nuclear genome. (TAIR10, ftp://ftp.arabidopsis.org/home/tair/Genes/TAIR10_genome_release/TAIR10_blastsets/TAIR10_pep_20101214), 20 436 sequences had hits with Arabidopsis proteins at E value ≤ 1e−5. The top hits were used for gene annotations, and the corresponding AGI code was used for the functional classification using the gene ontology (GO) of TAIR10 (http://www.arabidopsis.org/tools/bulk/go/index.jsp). The percentage of the up-regulated, down-regulated, overrepresented and underrepresented genes was calculated as follows: percentage (%) = (number of the genes classified into the GO term)/(total number of the genes used for the classification).
2.6. Quantitative real-time RT-PCR (qPCR) analysis
First-strand cDNA synthesis was performed with a SuperScript® VILO™ cDNA synthesis kit (Invitrogen) using random hexamer primers. After denaturing the total RNA (2.0 µg) at 70°C for 5 min, reverse transcription was performed for 1 h at 42°C with total RNA, 4 µl of SuperScript VILO Reaction Mix, and 2 µl of SuperScript Enzyme Mix in a 20 µl total volume. The reaction was stopped by heating for 5 min at 85°C. The first-strand cDNA preparations were stored at −30°C until use. The basic procedure of qPCR was carried out on an ABI PRISM 7000 (Applied Biosystems) using a cDNA mixture corresponding to 1.5 ng of total RNA, 10 µl of Fast SYBR® green master mix (Applied Biosystems), 0.5 µM of both forward and reverse primers in a 20 µl total volume. The gene-specific primers used for qPCR are listed in Supplementary Table S2. The sequences of all primer sets were designed using the Primer 3 program (http://primer3.sourceforge.net/). The PCR cycling conditions were as follows: 95°C for 20 s, for initial denaturation followed by 45 cycles of 95°C for 5 s and 60°C for 30 s. The specificity of the PCR amplification was evaluated with a melting curve analysis (from 55°C to 95°C) of the band pattern of the amplification product after the final cycle of the PCR. Each plate also incorporated a no-template control. We employed probes specific for the ubiquitin-conjugating enzyme 4 (UBC4) gene from cassava as references. The qPCR data was analysed with the ΔCT method using a reference gene. For each sample, the mRNA levels of target genes were normalized to that of the UBC4 mRNA.
3. Results and discussion
3.1. Cassava oligomicroarray design
For the development of the cassava oligomicroarray, we designed 60-mer oligonucleotide probes based on 76 652 cassava cDNA sequences (Fig. 2; 76 566 ESTs and 86 high-throughput cDNA sequences retrieved from GenBank in February 2009). We omitted non-native sequences derived from cloning vectors, bacterial host sequences, and sequences shorter than 100 bp. As a result of this cleaning process, the number of sequences was reduced to 76 568. In order to eliminate the sequence redundancy, the remaining sequences were assembled using the CAP3 program, which resulted in the identification of 29 636 non-redundant sequences (11 422 contigs and 18 214 singlets). We then performed a BLASTX search with the target sequences against NCBI RefSeq plant, UniProt TrEMBL plant, and the predicted protein sequences from poplar and castor bean genome sequences to evaluate the transcriptional direction, because some public ESTs were not deposited as sense strand sequences. This analysis identified 25 708 potential target sequences (average size: 853 bp) for the 60-mer probe design. To obtain more individual sequences among cassava varieties, we assembled the cassava expressed-sequences using the option p 95. We then applied the selected probes to the design via Agilent e-array (https://earray.chem.agilent.com/earray/) using ‘Best probe methodology’ and ‘Design with 3′ bias’ options to prevent cross-hybridization (Fig. 2). Finally, 21 522 unique microarray probes were selected via the Agilent's eArray application. About 52% (17 753) of the total predicted cassava CDS (34 151) are supported by 21 522 probes. Please note that when we designed the cassava microarray in 2009, 18 591 cassava CDS have been supported by the ESTs and this array has the probes corresponding to 89% (16 619) of them.
When the total 21 522 sequences were searched by BLASTX program against 35 176 Arabidopsis protein sequences present in the nuclear genome (TAIR10, ftp://ftp.arabidopsis.org/home/tair/Genes/TAIR10_genome_release/TAIR10_blastsets/TAIR10_pep_20101214), 20 436 sequences had hits with Arabidopsis proteins. Among them, 16 875 sequences had hits with 9748 Arabidopsis proteins at E value ≤1e−5. The top hits were used for gene annotation and analyses of the GO (please see below).29 Note that the percentage of the probes on the array having >80 or 90% similarity with other probes is 2.6 or 0.6, respectively (Supplementary Table S1). We then adopted the Agilent 44k oligomicroarray platform and the selected probes were duplicated in the randomized layout on the array. We have also added the 60 probes of non-plant or negative/positive control sequences on the array.
Similar type of 60-mer Agilent cassava oligomicroarray has been also developed17 and applied to study the expression profiles during storage root formation in cassava. The previous studies have applied it to only one cultivar, TMS60444 and have not demonstrated that the probes on the array could hybridize with the cRNAs prepared from various cassava genotypes. Our array differs from the previous array in the following ways: (i) slightly more ESTs were used to design the array (76 566 vs. 71 520), (ii) more genes are represented on our arrays (21 522 vs. 20 840), and (iii) care was taken to examine the transcript direction on our array.
3.2. Cassava oligomicroarray can be used for transcriptome analyses in various cassava genotypes
We applied the 22-k cassava oligomicroarray to study the expression profiles of three cassava genotypes, MTAI16, MECU72, and MPER417-003 under drought stress (Fig. 1) as described in Section 2. After filtering (see Section 2), the genes with the following characteristics were selected: (i) the signal intensity is higher than the local background plus 2.6 times of the standard deviation; (ii) the signal intensity is not saturated; and (iii) the spot is uniform. We adopted the Agilent standard protocol for the oligo-microarray kit in order to keep the objectivity of the statistics (http://www.genomics.agilent.com/files/Manual/G4460-90026_FE_Reference.pdf). The total numbers of valid gene probes that were identified as ‘expressed’ with the above characteristics were 16 888, 17 772, and 17 037 from MTAI16, MECU72, and MPER417-003, respectively (Table 1). These results showed that 77–83% from a total of 21 522 genes were detectable by hybridization to the cRNA from the tissues.
Table 1.
Number of expressed genes and data reproducibility among experiments using three cassava genotypes
| Cassava genotypes | Number of expressed genesa | Correlation coefficient |
||
|---|---|---|---|---|
| MTAI16 | MECU72 | MPER417-003 | ||
| MTAI16 | 16888 | 1.000 | — | — |
| MECU72 | 17772 | 0.959 ± 0.014 | 1.000 | — |
| MPER417-003 | 17037 | 0.967 ± 0.005 | 0.879 ± 0.014 | 1.000 |
aTotal number of the gene probes with the following characteristics in six experiments (both non-treated and drought-treated samples): (i) the signal intensity was higher than the local background plus 2.6 times of the standard deviation; (ii) the signal intensity was not saturated, and (iii) the spot is uniform.
To show the feasibility of our oligomicroarray for cassava genotypes with heterologous chromosomes, the signal intensities of the above-selected probes were plotted, and the correlation coefficients (R2) among three cassava genotypes under a non-treated condition were evaluated (Table 1). The R2 values were 0.959, 0.967, and 0.879 between MTAI16 and MECU72, MTAI16 and MPER417-003, and MECU72 and MPER417-003, respectively. It is worth noting that the R2 value between MECU72 and MPER417-003 was slightly lower than that of other combinations. This might be due to the following reasons: (i) the MTAI16 ESTs have been used for the microarray design, but the ESTs from MECU72 and MPER417-003 have not been used and (ii) the chromosomes of MECU72 and MPER417-003 might be more heterologous compared with MTAI16. To examine the reproducibility of the experiments, we calculated the coefficient of variation (CV) value for the signal intensities in the three replicative microarray experiments. In this study, we used four types of classification based on the CV value, that is, <0.25, between 0.25 and 0.50, between 0.50 and 0.75, and ≥0.75. More than 90% of all signals have CV values of <0.50 in both the control and drought-treated conditions (Fig. 3). These results indicate that there are few significant differences in the signal intensities among the three genotypes and that our oligomicroarray can be applied to multiple cassava genotypes.
Figure 3.

Variation in signal intensities in microarray experiments using three cassava genotypes. Black and white bars indicate non-treated and drought-treated samples, respectively. CVs were calculated for signal intensities in the three independent hybridizations.
Genes whose expression levels changed >2-fold in response to drought treatment were selected using statistical methods (see Section 2). The following three criteria were used for the gene selection: (i) the signal intensity changed >2-fold between the non-treated and drought-treated samples; (ii) The P value from the t-test for two groups (non-treated and drought-treated samples) was <0.01 and (iii) FDR (q-value) according to the method of Benjamini and Hochberg was <0.1.28 The number of drought stress up-regulated genes was 1078, 305, and 671 in MTAI16, MECU72, and MPER417-003, respectively (Fig. 4) and the number of drought stress down-regulated genes was 597, 419, and 238 in MTAI16, MECU72, and MPER417-003, respectively (Fig. 4). These results suggest that MTAI16 has the specific system for adaptability under various stress conditions, such as drought stress. Previous studies reported that MTAI16 recovered quickly from stress and also had high starch content under drought recovery compared with other varieties studied.19 Sequencing analysis of the full-length cDNA clones from MTAI16 subjected to various stress treatments, such as drought, identified many putative gene duplications that might have played a role in cassava stress responses.8 A total of 168 genes (Fig. 4; Supplementary Table S3) and 69 genes (Fig. 4; Supplementary Table S4) were up-regulated and down-regulated, respectively, by drought stress in all three genotypes.
Figure 4.

Venn diagram analysis of the genes up-regulated (A) or down-regulated (B) by drought stress treatment in the three cassava genotypes. In each genotype, the drought stress-up-regulated genes were identified as follows: (i) ratio (drought treatment/no treatment) ≥2, (2) t-test, P-value < 0.01, and (3) FDR (q-value) <0.1 according to the method of Benjamini and Hochberg (1995). The drought stress-down-regulated genes were identified as follows: (i) ratio (drought treatment/no treatment) ≤0.5, (ii) t-test, P-value < 0.01, and (iii) FDR (q-value) <0.1 according to the method of Benjamini and Hochberg (1995).
3.3. Cassava has similar mechanisms for drought stress response and tolerance as other plants, such as arabidopsis
Drought can be a major environmental constraint affecting the growth and physiology of many plant species. As a result, many plants have developed strategies to defend against damage caused by drought stress. In this study, we identified 168 genes that were up-regulated by drought stress in three cassava genotypes. Among them, there were many homologs of drought-inducible genes that were identified in previous studies of other plant species, such as Arabidopsis and rice (Supplementary Table S3).30–32
Functional category classification using the GO of the Arabidopsis Information Resource (TAIR10; http://www.arabidopsis.org/tools/bulk/go/index.jsp) for three components (‘biological process’, ‘molecular function’ and ‘cellular component’) was performed on the 168 drought stress up-regulated or 69 down-regulated genes (Fig. 5). Many drought stress up-regulated genes were classified into the GO terms ‘other cellular processes’, ‘other metabolic processes’, ‘unknown biological processes’, ‘response to abiotic or biotic stimulus’ and ‘response to stress’ for biological process.
Figure 5.

Percentage of GO terms for (A) biological process, (B) molecular function, and (C) cellular component of the genes up-regulated (168 genes in Supplementary Table S3; black bar) and down-regulated (69 genes in Supplementary Table S4; white bar) by drought stress treatment in the 3 genotypes (MTAI16, MECU72, and MPER417-003).
The drought stress up-regulated genes classified in a GO term ‘response to stress’ (Supplementary Table S5) include the homolog of a key gene in the biosynthetic pathway for abscisic acid (ABA), AtNCED3 (AT3G14440),33 which encodes a member of the 9-cis-epoxycarotenoid dioxygenases; an NAC transcription factor homolog, RD26 (AT4G27410)34 that is involved in the ABA-dependent drought stress signaling pathway; and a homolog of a drought-inducible galactinol synthase, AtGolS1 (AT2G47180),35 which encodes the key step in the biosynthesis of raffinose family oligosaccharides, osmolytes that play a role in drought stress tolerance. Among the drought-inducible genes identified, we also found homologs of several jasmonate ZIM-domain (JAZ) proteins36 that function in jasmonate pathway responses, such as wounding. This is most likely the result of cross-talk between ABA and JA signaling that has been observed in previous studies.37 In cassava, the interaction between ABA and JA might function in protecting the plants from the water loss that occurs under drought stress conditions. This might also be due to the fact that the cassava plants used for this microarray analysis were subjected to a wounding stress when the plantlets were removed from the gelrite medium during the drought stress treatment and when the shoots were cut from the plantlets prior to storage at −80°C.
Many drought stress down-regulated genes were classified into the GO terms ‘other intracellular components’, ‘other cytoplasmic components’, ‘chloroplast’, ‘other membranes’ and ‘plastid’ for cellular component (Fig. 5C). The drought stress down-regulated genes classified into the GO terms ‘chloroplast’ or ‘plastid’ include the homologs of a light-harvesting chlorophyll a/b-binding protein, LHCA4 (AT3G47470) and a chloroplast triose phosphate/3-phosphoglycerate translocator, APE2 (AT5G46110) genes (Supplementary Table S4). These results are consistent with previous reports that drought stress inhibits photosynthesis.38 Repression of photosynthesis under drought stress also occurs in cassava in the same way as other plants and might help the plants to survive under the stress.
Hierarchical clustering analysis of the 168 drought stress up-regulated and 69 down-regulated genes revealed similar expression pattern of the genes in both non-treated and drought stress-treated conditions among the three genotypes (Fig. 6). The venn diagram analysis also identified many genes up-regulated or down-regulated specifically in each genotype by drought stress treatment (Fig. 4; Supplementary Tables S6–S17). These genes include genes with unknown function and ones with various functional categories, such as transcription factors, protein kinases, stress response-related ones and metabolism-related ones. The GO term analyses for biological process showed that many genes up-regulated specifically in each genotype by drought stress were classified into the GO terms ‘other cellular processes’ and ‘other metabolic processes’. We could not find big differences on the pattern of GO term among the differentially regulated gene groups in each genotype (Supplementary Figs S1–S3).
Figure 6.
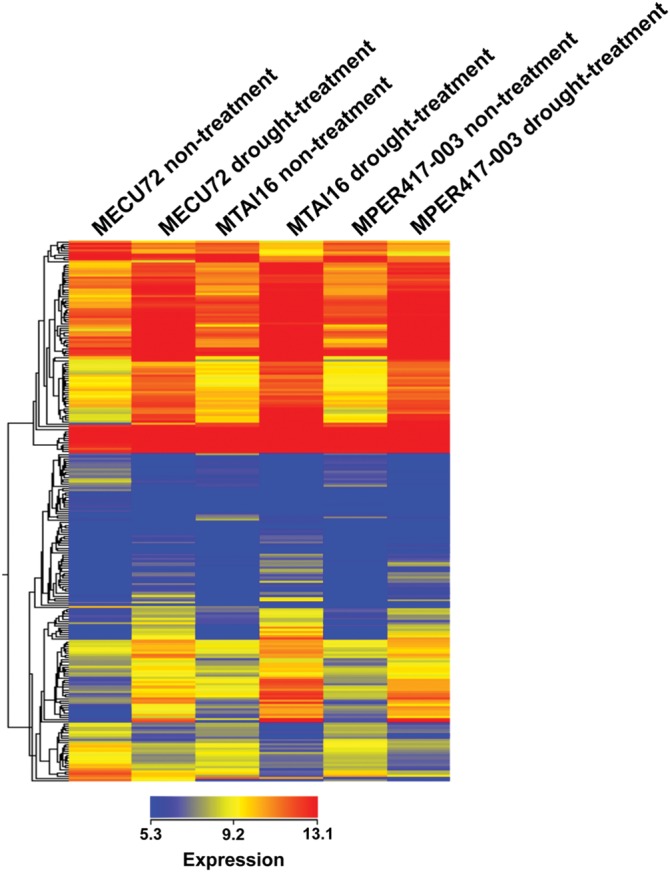
Hierarchical clustering analysis of the genes up-regulated (168 genes) and down-regulated (69 genes) by drought stress treatment in the three cassava genotypes. The signal intensity values for each sample were transformed to log2 values and subjected to hierarchical clustering using standard correlation. The genes with higher and lower signal intensity values are shown in red and blue, respectively. The genes with the signal intensity value of a median level are shown in yellow.
Many differentially expressed genes under the same conditions (no treatment and drought stress treatment) were identified between the genotypes (Supplementary Tables S18–S30) and the GO term analyses of the genes were performed (Supplementary Figs S4–S6). The number of the differentially expressed genes was larger in MPER417-003/MECU72 compared with that in MTAI16/MECU72 and MTAI16/MPER417-003. The differentially expressed genes between the genotypes include the genes with unknown function and the genes with various functional categories, such as transcription factors, protein kinases, transporters and metabolism-related ones.
3.4. Validation of the microarray data by qPCR
To evaluate the expression profiles obtained by microarray analysis, we also performed qPCR analysis. Nine genes were randomly selected from the genes shown in Supplementary Tables S1 and S3. The cassava homolog of the ubiquitin UBC4 gene (Supplementary Table S2) was used as a control because its expression level was constant between no treatment and the 1-h drought treatment. The results of the qPCR analysis were consistent with those of the microarray analysis (Fig. 7). The R2 between the two experiments for the 27 total plots was 0.904. These results show that the cassava microarray provides reliable data and can be used for transcriptome analyses in various cassava genotypes with heterologous chromosomes.
Figure 7.

Confirmation of microarray data by qPCR analysis. A scatter plot between the log2-transformed ratio (drought treatment/no treatment) measured by qPCR analysis (X axis) and those (drought treatment/no treatment) obtained by the microarray analysis (Y axis). White circles, black circles and white squares indicate the data from MTAI16, MECU72 and MPER417-003, respectively. Correlation coefficient (R2) was 0.904.
Supplementary Data
Supplementary Data are available at www.dnaresearch.oxfordjournals.org.
Funding
This work was supported by Strategic Funds for the Promotion of Science and Technology of the Ministry of Education, Culture, Sports, Science and Technology (MEXT) of Japan and the Grant-in-Aid for Scientific Research (Young Scientists (B) 21710205) from the Ministry of Education, Culture, Sports, Science and Technology of Japan, and the core fund of CIAT.
Supplementary Material
Acknowledgements
The authors would like to thank Dr Sarah Ayling and Ms Angela Fernando for reading the manuscript and for providing helpful comments.
References
- 1.Vries C.A., Ferweds J.D., Flash M. Choice of crops in relation to actual and potential production in tropics. Neth. J. Agric. Sci. 1976;15:241–6. [Google Scholar]
- 2.Lokko Y., Anderson J.V., Rudd S., et al. Characterization of an 18,166 EST dataset for cassava (Manihot esculenta Crantz) enriched for drought-responsive genes. Plant Cell Rep. 2007;26:1605–18. doi: 10.1007/s00299-007-0378-8. [DOI] [PubMed] [Google Scholar]
- 3.El-Sharkawy M.A., Cock J.H. Response of cassava to water stress. Plant Soil. 1987;100:345–60. [Google Scholar]
- 4.Alba R., Fei Z., Payton P., et al. ESTs, cDNA microarrays, and gene expression profiling: tools for dissecting plant physiology and development. Plant J. 2004;39:697–714. doi: 10.1111/j.1365-313X.2004.02178.x. [DOI] [PubMed] [Google Scholar]
- 5.Seki M., Shinozaki K. Functional genomics using RIKEN Arabidopsis thaliana full-length (RAFL) cDNAs. J. Plant Res. 2009;122:355–66. doi: 10.1007/s10265-009-0239-3. [DOI] [PubMed] [Google Scholar]
- 6.Anderson J.V., Delseny M., Fregene M.A., et al. An EST resource for cassava and other species of Euphorbiaceae. Plant Mol. Biol. 2004;56:527–39. doi: 10.1007/s11103-004-5046-6. [DOI] [PubMed] [Google Scholar]
- 7.Li Y.Z., Pan Y.H., Sun C.B., et al. An ordered EST catalogue and gene expression profiles of cassava (Manihot esculenta) at key growth stages. Plant Mol. Biol. 2010;74:573–90. doi: 10.1007/s11103-010-9698-0. [DOI] [PubMed] [Google Scholar]
- 8.Sakurai T., Plata G., Rodríguez-Zapata F., et al. Sequencing analysis of 20,000 full-length cDNA clones from cassava reveals lineage specific expansions in gene families related to stress response. BMC Plant Biol. 2007;7:66–83. doi: 10.1186/1471-2229-7-66. [DOI] [PMC free article] [PubMed] [Google Scholar]
- 9.Prochnik S., Marri P.R., Desany B., et al. The cassava genome: current progress, future directions. Trop. Plant Biol. 2012;5:88–94. doi: 10.1007/s12042-011-9088-z. [DOI] [PMC free article] [PubMed] [Google Scholar]
- 10.Aharoni A., Vorst O. DNA microarrays for functional plant genomics. Plant Mol. Biol. 2001;48:99–118. doi: 10.1023/a:1013734019946. [DOI] [PubMed] [Google Scholar]
- 11.Clark J.D., Zhu T. Microarray analysis of the transcriptome as a stepping stone towards understanding biological systems: practical considerations and perspectives. Plant J. 2006;45:630–50. doi: 10.1111/j.1365-313X.2006.02668.x. [DOI] [PubMed] [Google Scholar]
- 12.Rensink W.A., Buell C.R. Microarray expression profiling resources for plant genomics. Trends Plant Sci. 2005;12:1360–85. doi: 10.1016/j.tplants.2005.10.003. [DOI] [PubMed] [Google Scholar]
- 13.Lopez C., Soto M., Restrepo S., et al. Gene expression profile in response to Xanthomonas axonopodis pv. manihotis infection in cassava using a cDNA microarray. Plant Mol. Biol. 2005;57:393–410. doi: 10.1007/s11103-004-7819-3. [DOI] [PubMed] [Google Scholar]
- 14.Reilly K., Bernal D., Cortes D.F., Gomez-Vasquez R., Tohme J., Beeching J.R. Towards identifying the full set of genes expressed during cassava post-harvest physiological deterioration. Plant Mol. Biol. 2007;64:187–203. doi: 10.1007/s11103-007-9144-0. [DOI] [PubMed] [Google Scholar]
- 15.Woo Y., Affourtit J., Daigle S., et al. A comparison of cDNA, oligonucleotide, and Affymetrix GeneChip gene expression microarray platforms. J. Biomol. Tech. 2004;15:276–84. [PMC free article] [PubMed] [Google Scholar]
- 16.Larkin J.E., Frank B.C., Gavras H., Sultana R., Quackenbush J. Independence and reproducibility across microarray platforms. Nat. Method. 2005;2:337–43. doi: 10.1038/nmeth757. [DOI] [PubMed] [Google Scholar]
- 17.Yang J., An D., Zhang P. Expression profiling of cassava storage roots reveals an active process of glycolysis/gluconeogenesis. J. Integr. Plant Biol. 2011;53:193–211. doi: 10.1111/j.1744-7909.2010.01018.x. [DOI] [PubMed] [Google Scholar]
- 18.Kawano K. Thirty years of cassava breeding for productivity—biological and social factors for success. Crop Sci. 2003;43:1325–35. [Google Scholar]
- 19.Santisopasri V., Kurotjanawong K., Chotineeranat S., Piyachomkwan K., Sriroth K., Christopher G.O. Impact of water stress on yield and quality of cassava starch. Ind. Crops Prod. 2001;13:115–29. [Google Scholar]
- 20.Sriroth K., Santisopasrib V., Petchalanuwatc C., Kurotjanawonga K., Piyachomkwand K., Oatese C.G. Cassava starch granule structure—function properties: influence of time and conditions at harvest on four cultivars of cassava starch. Carbohydr Polymers. 1999;38:161–70. [Google Scholar]
- 21.Colombo C., Second G., Charrier A. Genetic relatedness between cassava (Manihot esculenta Crantz) and M. flabellifolia and M. peqruviana based on both RAPD and AFLP markers. Genet. Mol. Biol. 2000;2:417–23. [Google Scholar]
- 22.Roa A.C., Chavarriaga-Aguirre P., Duque M.C., et al. Cross-speices amplification of cassava (Manihot esculenta) (Euphorbiaceae) microsatellites: alleic polymorphism and degree of relationship. Am. J. Bot. 2000;87:1647–55. [PubMed] [Google Scholar]
- 23.Ewing B., Green P. Base-calling of automated sequencer traces using phred. II. Error probabilities. Genome Res. 1998;8:186–94. [PubMed] [Google Scholar]
- 24.Huang X., Madan A. CAP3: a DNA sequence assembly program. Genome Res. 1999;9:868–87. doi: 10.1101/gr.9.9.868. [DOI] [PMC free article] [PubMed] [Google Scholar]
- 25.Altschul S.F., Madden T.L., Schaffer A.A., et al. Gapped BLAST and PSI-BLAST: a new generation of protein database search programs. Nucleic Acids Res. 1997;25:3389–402. doi: 10.1093/nar/25.17.3389. [DOI] [PMC free article] [PubMed] [Google Scholar]
- 26.Pruitt K.D., Tatusova T., Klimke W., Maglott D.R. NCBI reference sequences: current status, policy and new initiatives. Nucleic Acids Res. 2009;37:D32–6. doi: 10.1093/nar/gkn721. [DOI] [PMC free article] [PubMed] [Google Scholar]
- 27.The UniProt Consortium. Ongoing and future developments at the Universal Protein Resource. Nucleic Acids Res. 2010;39:D214–9. doi: 10.1093/nar/gkq1020. [DOI] [PMC free article] [PubMed] [Google Scholar]
- 28.Benjamini Y., Hochberg Y. Controlling the false discovery rate: a practical and powerful approach to multiple testing. J. R. Statist Soc. Ser. B. 1995;57:289–300. [Google Scholar]
- 29.Ashburner M., Ball C.A., Blake J.A., et al. Gene ontology: tool for the unification of biology. The gene ontology consortium. Nat. Genet. 2000;25:25–9. doi: 10.1038/75556. [DOI] [PMC free article] [PubMed] [Google Scholar]
- 30.Seki M., Narusaka M., Ishida J., et al. Monitoring the expression profiles of 7000 Arabidopsis genes under drought, cold and high-salinity stresses using a full-length cDNA microarray. Plant J. 2000;31:279–92. doi: 10.1046/j.1365-313x.2002.01359.x. [DOI] [PubMed] [Google Scholar]
- 31.Rabbani M.A., Maruyama K., Abe H., et al. Monitoring expression profiles of rice genes under cold, drought, and high-salinity stresses and abscisic acid application using cDNA microarray and RNA gel-blot analyses. Plant Physiol. 2003;133:1755–67. doi: 10.1104/pp.103.025742. [DOI] [PMC free article] [PubMed] [Google Scholar]
- 32.Matsui A., Ishida J., Morosawa T., et al. Arabidopsis transcriptome analysis under drought, cold, high-salinity and ABA treatment conditions using a tiling array. Plant Cell Physiol. 2008;49:1135–49. doi: 10.1093/pcp/pcn101. [DOI] [PubMed] [Google Scholar]
- 33.Iuchi S., Kobayashi M., Taji T., et al. Regulation of drought tolerance by gene manipulation of 9-cis-epoxycarotenoid dioxygenase, a key enzyme in abscisic acid biosynthesis in Arabidopsis. Plant J. 2001;27:325–33. doi: 10.1046/j.1365-313x.2001.01096.x. [DOI] [PubMed] [Google Scholar]
- 34.Fujita M., Fujita Y., Maruyama K., et al. A dehydration-induced NAC protein, RD26, is involved in a novel ABA-dependent stress-signaling pathway. Plant J. 2004;39:863–76. doi: 10.1111/j.1365-313X.2004.02171.x. [DOI] [PubMed] [Google Scholar]
- 35.Taji T., Ohsumi C., Iuchi S., et al. Important roles of drought- and cold-inducible genes for galactinol synthase in stress tolerance in Arabidopsis thaliana. Plant J. 2002;29:417–26. doi: 10.1046/j.0960-7412.2001.01227.x. [DOI] [PubMed] [Google Scholar]
- 36.Chini A., Fonseca S., Fernández G., et al. The JAZ family of repressors is the missing link in jasmonate signaling. Nature. 2007;448:666–71. doi: 10.1038/nature06006. [DOI] [PubMed] [Google Scholar]
- 37.Munemasa S., Oda K., Watanabe-Sugimoto M., Nakamura Y., Shimoishi Y., Murata Y. The coronatine-insensitive 1 mutation reveals the hormonal signaling interaction between abscisic acid and methyl jasmonate in Arabidopsis guard cells. Specific impairment of ion channel activation and second messenger production. Plant Physiol. 2007;143:1398–407. doi: 10.1104/pp.106.091298. [DOI] [PMC free article] [PubMed] [Google Scholar]
- 38.Tezara W., Mitchell V.J., Driscoll S.D., Lawlor D.W. Water stress inhibits plant photosynthesis by decreasing coupling factor and ATP. Nature. 1999;401:914–7. [Google Scholar]
Associated Data
This section collects any data citations, data availability statements, or supplementary materials included in this article.