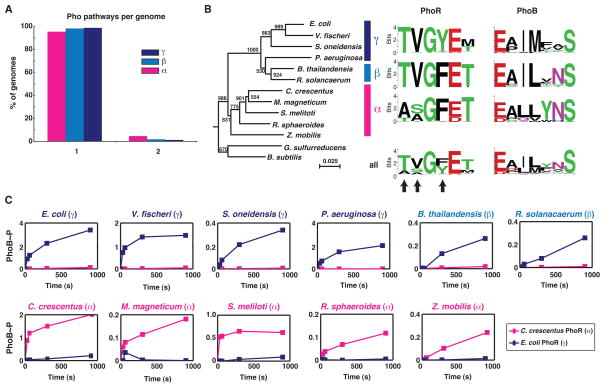
Figure 1. Phosphotransfer specificity of PhoR is different in α– and γ-proteobacteria.
(A) Percentage of genomes harboring one or two Pho pathways. (B) Neighbor-joining tree for a subset of PhoR orthologs and sequence logos for specificity residues in PhoR and PhoB orthologs. Logos are shown for orthologs in each subdivision and as a combined set. Bootstrap values are out of 1000. A neighbor-joining tree for PhoB orthologs and a species tree for the species used are in Figure S1A–B. (C) Time-courses of phosphotransfer from C. crescentus PhoR (α) and E. coli PhoR (γ) to each of 11 PhoB orthologs from representative α-, γ-, and β-proteobacteria as noted above each graph. Band intensities for each PhoB were normalized in each experiment to the initial amount of autophosphorylated kinase. Values for PhoB phosphorylation can be greater than one as ATP was in excess in the reaction, allowing for re-autophosphorylation of PhoR and subsequent transfer to PhoB. For original gel images, see Figure S1D.

