

Abstract
Idiopathic generalized epilepsy (IGE) is a complex disease with high heritability, but little is known about its genetic architecture. Rare copy-number variants have been found to explain nearly 3% of individuals with IGE; however, it remains unclear whether variants with moderate effect size and frequencies below what are reliably detected with genome-wide association studies contribute significantly to disease risk. In this study, we compare the exome sequences of 118 individuals with IGE and 242 controls of European ancestry by using next-generation sequencing. The exome-sequenced epilepsy cases include study subjects with two forms of IGE, including juvenile myoclonic epilepsy (n = 93) and absence epilepsy (n = 25). However, our discovery strategy did not assume common genetic control between the subtypes of IGE considered. In the sequence data, as expected, no variants were significantly associated with the IGE phenotype or more specific IGE diagnoses. We then selected 3,897 candidate epilepsy-susceptibility variants from the sequence data and genotyped them in a larger set of 878 individuals with IGE and 1,830 controls. Again, no variant achieved statistical significance. However, 1,935 variants were observed exclusively in cases either as heterozygous or homozygous genotypes. It is likely that this set of variants includes real risk factors. The lack of significant association evidence of single variants with disease in this two-stage approach emphasizes the high genetic heterogeneity of epilepsy disorders, suggests that the impact of any individual single-nucleotide variant in this disease is small, and indicates that gene-based approaches might be more successful for future sequencing studies of epilepsy predisposition.
Introduction
In the past decade, there have been extensive efforts to identify the genetic basis of common, complex human disease. Until recently, this effort has focused primarily on common variants with the use of genome-wide association studies. Although a number of important gene discoveries have emerged from this work, most of the identified variants have only a small effect on disease risk, particularly of neuropsychiatric diseases.1 Recently, however, studies have demonstrated that rare copy-number variants (CNVs) contribute to the risk of developing neurological, psychiatric, and developmental disorders.2–10 These findings implicate specific risk loci in these diseases and also support the role of rare variation in the genetic architecture of neuropsychiatric diseases.
Next-generation sequencing (NGS) allows for nearly comprehensive cataloging of genetic variants and offers an unprecedented ability to identify rare variants. However, distinguishing the disease-causing variants from the large number of rare and apparently functional variants found in each human genome presents a considerable challenge. Although the optimum NGS study design for identifying causal genetic loci in complex disease will evolve as we expand our knowledge of the underlying genetic architecture, NGS studies evaluating the role of rare variants in complex diseases at this stage include two broadly defined approaches: (1) variant-based assessments for exploring the role of individual variants that have a relatively large effect and that are common enough to be seen in multiple cases and (2) gene-level approaches that seek to identify multiple rare risk alleles within the same genes.
In this study, we test the first approach and report on the results of a NGS study of individuals with idiopathic generalized epilepsy (IGE [MIM 600669], also known as genetic generalized epilepsy), one of the most heritable subtypes of common epilepsy.11,12
Subjects and Methods
Study Population
IGE-affected subjects evaluated in this study were largely recruited through the Epilepsy Genetics (EPIGEN) Consortium. Across EPIGEN, subjects are recruited and enrolled by physicians during routine clinical visits across five clinical sites: Erasme Hospital and Universitair Ziekenhuis Gasthuisberg (Belgium), Duke University Medical Center (United States), Beaumont Hospital (Ireland), and the National Hospital for Neurology and Neurosurgery (England). Detailed phenotypic information is collected at the time of enrollment and put into a database in a deidentified manner for the facilitation of genetic association studies. Clinical information is updated periodically when the individual returns to the clinic for routine care and treatment. From the database information, we selected 118 unrelated individuals of European ancestry for the exome-sequencing phase of the study, and these included 93 subjects with a diagnosis of juvenile myoclonic epilepsy (JME [MIM 254770]) and 25 with a diagnosis of absence epilepsy (AE [MIM 607631 and MIM 600131]). For follow-up genotyping of candidate variants, we identified an additional 578 EPIGEN IGE-affected individuals without restricting to particular ethnicities, 181 DNA samples (of European ancestry) obtained from the Coriell Cell Repository (National Institute of Neurological Disease and Stroke epilepsy collection), and eight additional unrelated individuals with IGE (contributed by James McNamara and Ruth Ottman). All subjects selected for this study had clinical and electroencephalographical characteristics meeting the 1989 International League against Epilepsy syndrome definitions13 for childhood AE (MIM 600131), juvenile AE (MIM 607631), JME (MIM 254770), or other unspecified forms of IGE (MIM 600669). The full cohort of 885 IGE-affected individuals, either exome sequenced or genotyped, included 131 individuals with a diagnosis of AE and 288 individuals with a diagnosis of JME. Diagnoses were assigned by the treating physician at each site. Approximately 90% of this follow-up IGE cohort was of European ancestry.
Exome- or whole-genome-sequenced controls consisted of a group of 242 individuals who were sequenced as part of other NGS studies being carried out in the Center for Human Genome Variation (Duke University). All 242 controls were of European ancestry and were not enriched for epilepsy or other neuropsychiatric phenotypes. Controls used for follow-up genotyping consisted of an additional 1,780 subjects who were not enriched for neuropsychiatric phenotypes and who were from the Genetics of Memory and Epilepsy cohort collected in the Center for Human Genome Variation, the Murdock Research Institute cohort, the Center for HIV/AIDS Vaccine Immunology progression cohort, or the high-risk seronegative HIV cohort. Approximately 65% of this follow-up control cohort was of European ancestry. We note that controls were matched for broad ancestral group (European) only.
This study was carried out in compliance with the institutional review board at Duke University and the relevant ethics boards at the collection sites. Informed consent was obtained from all study participants or their legal guardians.
Study Design and Methods
In this study, we used a two-stage discovery approach that first employed exome sequencing in a series of IGE-affected individuals and a subsequent large-scale follow-up genotyping of identified candidate variants in a larger cohort of IGE-affected subjects and controls (Figure 1).
Figure 1.
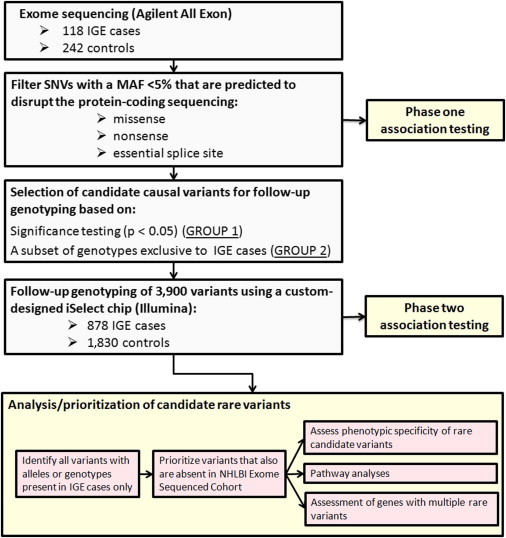
Overview of the Study Design
Exome Sequencing, Alignment, and Variant Calling
Samples were either exome sequenced with Agilent's All Exon (37 Mb or 50 Mb) capture or whole-genome sequenced (n = 51 controls) on Illumina GAIIx or HiSeq 2000 machines in the Genomic Analysis Facility within the Center for Human Genome Variation. Only the regions targeted on the 37 Mb or 50 Mb Agilent All Exon platform were interrogated from the whole-genome-sequenced samples. Sequencing was performed according to standard protocols. The targeted exonic regions of all sequenced samples were sequenced to an average coverage of 64.3× ± 13, which translated to at least 5× coverage of approximately 86% of the Human Genome Organization (HUGO)-defined protein-coding regions in each subject. Paired-end reads were aligned to the human reference genome (National Center for Biotechnology Information Build 36) with Burrows-Wheeler Aligner software.14 Variant calling was performed with SAMtools software.15 SequenceVariantAnalyzer (SVA)16 was used for annotating variants identified from the sequence data (Ensembl 50_36l). This software provides each variant with a genomic context (nonsynonymous or splice-site coding, gene name, transcript, associated Gene Ontology term, etc.).16 Association Tests for Annotated Variants (ATAV) software was used for performing Fisher's exact tests for the comparison of the frequencies of variants identified from the sequence data between cases and controls so that candidate variants for follow-up genotyping could be selected.
Identifying Candidate Variants from the Sequence Data
Variants for follow-up genotyping were selected on the basis of variant-call quality, association evidence, and functional annotation. We first isolated variants with a minor allele frequency (MAF) of less than 5% in the control population in transcripts encoding a HUGO protein-coding gene, and only those predicted to affect the protein-coding sequence (these included missense variants, nonsense variants, and single-nucleotide variants [SNVs] residing in the highly conserved essential splice-site region—two base pairs into an intron or one base pair into the exon at the intron-exon junction). We then eliminated autosomal variants that were out of Hardy-Weinberg equilibrium in controls (p < 0.001), X chromosome variants that were out of Hardy-Weinberg equilibrium in females only (p < 0.001), sex-chromosome variants called as heterozygotes in males, and variants with less than 10× coverage in more than 50% of sequenced subjects. These quality-control steps left us with a set of high-quality variants that were annotated as functional.
We then selected the subset of variants that were statistically significantly enriched in cases (uncorrected p < 0.05, Fisher's exact test, allelic or recessive model, GROUP 1) and those with alleles or genotypes exclusive to cases (GROUP 2) if they satisfied at least one of the following selection criteria: (1) the variant genotype was observed in more than one individual with IGE, (2) the variant was located in a region known to harbor pathogenic CNVs implicated in neuropsychiatric disease, or (3) for variants with genotypes observed in one case only, the variant met more stringent criteria for functional effect, i.e., variants that were predicted to disrupt an essential splice site, variants that targeted the transcript for nonsense-mediated decay, and nonsynonymous variants predicted by Polyphen-217 to change protein function with high confidence (“probably damaging”). SNVs composing GROUP 2 were also screened in an additional 296 sequenced controls of other ethnicities (non-European ancestry) and were eliminated if the genotype was observed.
Follow-Up Genotyping
Candidate variants were genotyped in additional cases and controls with a custom designed iSelect genotyping chip (Illumina). Of the 3,897 selected variants, 3,626 met the design standards, permitting them to be included on the custom-designed chip. Variants were genotyped in 878 IGE cases and 1,830 controls, including 111 of the 118 originally sequenced cases and 50 of the 242 originally sequenced controls. In a separate effort to identify susceptibility variants in schizophrenia (see Need et al.18 in this issue of AJHG) and to assess phenotypic specificity of the candidate epilepsy-susceptibility variants being evaluated, we also included individuals with schizophrenia (MIM 181500) in this follow-up genotyping study. After genotyping, the raw data from the custom genotyping chip were evaluated with Illumina's GenomeStudio software. Any samples with a call rate below 0.95 were excluded from analysis. Several additional quality-control steps were also taken for ensuring genotyping accuracy. First, genders determined from genotyping were compared to the record of sample genders. Samples with discordant gender calls were excluded from further analysis. Next, genotype concordance was checked for all samples that had been exome or whole-genome sequenced. Any variant that had discordant calls between the genotyping and sequencing data set and that could not be reconciled with inspection of the genotyping or sequencing data was excluded from further analysis. Finally, for subjects who had been previously genotyped on an Illumina genome-wide genotyping chip, we compared the genotyping calls of a set of 170 variants that were genotyped on both platforms and removed samples with <95% concordance.
Candidate variants that were absent in the control population were also evaluated in a cohort of ∼5,400 samples exome sequenced as part of the National Heart, Lung, and Blood Institute (NHLBI) Grand Opportunity (GO) Exome Sequencing Project (ESP) for the identification of genes contributing to heart, lung, and blood disorders (Exome Variant Server [EVS], NHLBI ESP, Seattle, WA). In order for a variant to be called present or absent in a study sample, the coverage of the site was required to be at least 10× and any variant had to have a quality score of at least 30.
Association Testing
PLINK19 was used for performing logistic regression (allelic and recessive models) on variants genotyped in the follow-up genotyping phase of the study (iSelect genotyping) for the identification of variants enriched more in cases than in controls. Genome-wide-association chip data (Illumina) were available on a subset of the genotyped samples, which permitted the calculation of eigenvectors so that population substructure in the logistic regression could be corrected for according to the Eigenstrat method.20 Association testing for variants residing on the X chromosome was performed in females only.
Results
Exome Sequencing
After exome sequencing, alignment, and a series of quality-control steps, we isolated 97,242 nonsense, missense, or essential splice-site SNVs that were in transcripts encoding a HUGO-defined protein-coding gene and that had a control MAF of less than 5% from the variant profiles identified in the 118 IGE cases and 242 controls. A total of 9,987 SNVs were removed as a result of inconsistency with Hardy-Weinberg equilibrium in controls or excessively high missingness (i.e., insufficiently covered for accurate variant calling), leaving us with 87,255 high-quality functional variants with an estimated population frequency of less than 5%. We performed logistic regressions by using both allelic and recessive models to compare the frequencies of variants in the cases and controls. Given the number of variants tested and the sample size, we had little power to achieve formal significance unless risk alleles were common and/or of major effect (Figure 2). Not surprisingly, there were no significant findings after correction for the 87,255 single-variant association tests performed (p < 6 × 10−07). However, by targeting the subset of variants showing nominal significance in the sequence data in a follow-up cohort of 878 cases and 1,830 controls, we had power to detect variants over a much broader range of parameters (Figure 2). Hence, all candidate IGE-susceptibility variants selected from the exome-sequencing data on the basis of the criteria defined in the Subjects and Methods section were then taken forward for genotyping in the follow-up cohort.
Figure 2.
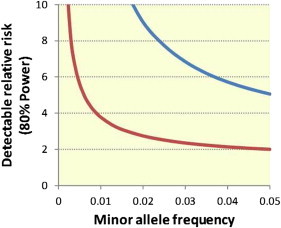
Power for Detecting an Epilepsy-Susceptibility Variant in This Study
The detectable relative risk of an IGE-susceptibility variant across a range of MAFs in the sequencing phase of this study (blue line) is compared to that of the follow-up genotyping phase of this study (red line). To be significant, associations must have a p value below 6 × 10⁻⁷, which is equivalent to p < 0.05 when we correct for all 87,255 high-quality, functional variants that were annotated as functional and had a control MAF < 5% in the sequencing study. Power calculations were performed with the CaTS-Power Calculator.21
Importantly, we note that no correction was made for population substructure when we selected variants from the sequence data for follow-up genotyping. Because we used a very liberal threshold for inclusion of variants, the impact that not controlling for stratification has on power should be modest. Furthermore, these variants would subsequently be analyzed in further samples where a correction for population stratification was incorporated (see Subjects and Methods).
Because this selection of candidate variants included variants with very modest statistical enrichment or exclusive presence in IGE cases (which could occur if the variant is a risk factor for JME, AE, or both [or neither]), we emphasize that this study design does not presume that the genetic control is constant across all syndromes composing IGE.
Follow-Up Genotyping of Candidate Variants
Variant Validation
In total, 3,897 variants met the defined candidate-variant criteria. Because the reference-mapping approaches used in this analysis have been shown to generate false positives,22 we calculated validation rates among our selected variants to evaluate the extent to which this occurred. On average, 96% of SNVs selected from the exome-sequencing study were confirmed in the iSelect follow-up analysis to be present in the variant carrier or in another subject analyzed in this study. We did not see differences in validation rates between functional groups, as previously reported for more common variants,22 which is most likely due to the highly stringent quality control used in this analysis, as well as the fact that the majority of the variants selected for follow-up analysis were predicted to be deleterious.
Association Testing
Of the 3,897 selected variants, 3,349 were successfully genotyped on a custom-designed iSelect genotyping chip (Illumina) and passed the defined quality-control criteria. The 3,349 SNVs were first tested for association with the IGE phenotype in the larger cohort. In a subset of samples (460 IGE cases versus 814 controls), we applied Eigenstrat axes to control for stratification.20 The eigenvectors generated from the genome-wide genotyping data were incorporated as covariates into the logistic regression comparing the genotype frequency of the candidate susceptibility variants in cases and controls. The quantile-quantile plot suggests that population substructure has been adequately corrected for in this analysis (Figure 3). Using a Bonferonni correction for all rare, functionally annotated variants identified in the exome-sequencing study (n = 87,255), we found that no variants had a corrected p value below 0.05. Table 1 provides a list of the ten lowest p values showing enrichment in IGE cases under an allelic model. Among these, the most significantly enriched is a nonsynonymous variant (c.103C>G [p.Pro35Ala]; Ensembl accession number ENST00000322805 and RefSeq accession number NM_001191323) located in GREM1. This gene belongs to a family of bone morphogenetic protein antagonists and is believed to play a role in organogenesis and tissue differentiation.23 This GREM1 SNV is located within 100 kb of the 15q13.3 region that was recently found to harbor large genomic deletions that associate with epilepsy, schizophrenia (MIM 181500), and autism (MIM 209850).5,9,24,25 No trend associations (uncorrected p < 0.05) were detected with a recessive model. Likewise, subanalyses of individuals with a diagnosis of AE (n = 61) and JME (n = 173) revealed no study-wide significant associations.
Figure 3.
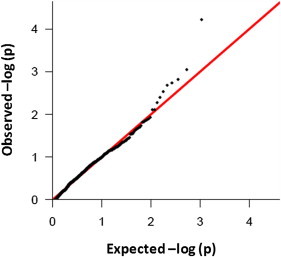
Quantile-Quantile Plot Shows No Evidence of Population Stratification
A quantile-quantile plot of transformed p values (black dots) against the expected transformed p values for variants with at least six alleles represented in the study population. The red line indicates the expectation under the null model of no effect on risk.
Table 1.
List of Variants Enriched in 460 IGE-Affected Individuals of European Ancestry
| Variant (chr_hg18 position_ allele) | SNP ID (dbSNP 129/Ensembl 50_36l) | Gene | MIM Number | Transcript (Ensembl 50_36l) | Transcript (RefSeq) | Position of Sequence and Amino Acid Change | Annotated Function | IGE Counts (Hom/Het/Reference) | Control Counts (Hom/Het/Reference) | Odds Ratio | Uncorrected p Value | Corrected p Valuea |
|---|---|---|---|---|---|---|---|---|---|---|---|---|
| 15_30810286_G | − | GREM1 | 603054 | ENST00000322805 | NM_001191323.1 | c.103C>G (p.Pro35Ala) | NS | 0/16/444 | 0/4/811 | 9.50 | 0.0002 | NS |
| 11_123353274_A | rs17759447 | OR10S1 | − | ENST00000360721 | − | c.335C>T (p.Ala112Val) | NS | 0/25/435 | 0/11/804 | 3.64 | 0.001 | NS |
| 4_77032104_T | − | PPEF2 | 602256 | ENST00000337500 | − | c.107G>A (p.Arg36His) | NS | 0/19/437 | 0/9/806 | 3.77 | 0.003 | NS |
| 6_139274117_A | − | REPS1 | − | ENST00000367663 | − | c.1900C>T (p.Pro634Ser) | NS | 0/3/457 | 0/1/813 | 28.8 | 0.006 | NS |
| 5_98220168_A | − | CHD1 | 602118 | ENST00000284049 | NM_001270.2 | c.4949C>T (p.Thr1650Met) | NS | 0/5/455 | 0/2/813 | 14.3 | 0.007 | NS |
| 11_19203863_C | − | E2F8 | 612047 | ENST00000250024 | NM_024680.3 | c.2018C>G (p.Pro673Arg) | NS | 0/3/457 | 0/1/814 | 33.21 | 0.008 | NS |
| 1_100379032_A | − | CCDC76 | − | ENST00000370141 | NM_019083.2 | c.538C>A (p.Leu180Ile) | NS | 0/2/458 | 0/1/814 | 40.6 | 0.008 | NS |
| 5_178487703_T | rs35445112 | ADAMTS2 | 604539 | ENST00000251582 | NM_014244.4 | c.2480G>A (p.Arg827Gln) | NS | 0/47/413 | 0/54/761 | 1.84 | 0.009 | NS |
| 19_57401117_T | − | PPP2R1A | 605983 | ENST00000322088 | NM_014225.5 | c.259C>T (p.His87Tyr) | NS | 0/7/453 | 0/4/811 | 5.61 | 0.015 | NS |
| 1_212642864_C | − | PTPN14 | 603155 | ENST00000366956 | NM_005401.4 | c.566A>G (p.Glu189Gly) | NS | 1/33/426 | 0/30/785 | 1.99 | 0.016 | NS |
The following abbreviations are used: IGE, idiopathic generalized epilepsy; NS, nonsynonymous; hom, homozygous; and het, heterozygous.
Corrected for 87,255 high-quality, putatively functional SNVs seen in the sequencing study.
Evaluation of Variants with Alleles or Genotypes Exclusive to Cases
We next evaluated the 1,863 SNVs for which the variant allele continued to be exclusively present in cases after follow-up genotyping (Table S1, available online). We examined the frequency of these variants in an additional ∼5,400 subjects who had their exomes sequenced as part of the NHLBI GO ESP. A total of 1,289 variants remained absent in the NHLBI control population, and 23 were not sufficiently covered for the evaluation of frequency (noted in Table S1). Among these 1,289 rare candidate variants is a missense mutation (c.620C>T [p.Ala207Val]; Ensembl ENST00000396881) in PSME2 (MIM 602161); this mutation was observed in five unrelated IGE cases (Table 2). PSME2 encodes the proteasome activator complex subunit 2 and is involved in antigen processing and the assembly of the immunoproteasome.26 The encoded protein has no reported role in epilepsy pathophysiology; however, expression of the gene has been shown to be upregulated in mesial temporal-lobe epilepsy.27
Table 2.
SNVs Present in at Least Three IGE-Affected Individuals, Absent in the Control Population Evaluated in This Study, and Absent from the NHLBI Exome-Sequenced Cohort
| Variant (chr_hg18 position_ allele) | Gene | MIM Number | Transcript (Ensembl 50_36l) | Transcript (RefSeq) | Position of Sequence and Amino Acid Change | Annotated Function | IGE Countsa(Hom/Het/Reference) | Control Countsa(Hom/Het/Reference) | p Valueb | MAF (%)/Number of Subjects (NHLBI Cohort) |
|---|---|---|---|---|---|---|---|---|---|---|
| 14_23682683_A | PSME2 | 602161 | ENST00000396881 | − | c.620C>T (p.Ala207Val) | NS | 0/5/874 | 0/0/2,021 | 0.003 | 0/5,379 |
| 7_30760037_A | INMT | 604854 | ENST00000013222 | NM_006774.4 | c.320G>A (p.Trp107∗) | SG | 0/3/875 | 0/0/2,005 | 0.028 | 0/5,379 |
| 7_150410267_T | TMUB1 | − | ENST00000297533 | NM_031434.3 | c.317G>A (p.Arg106Gln) | NS | 0/3/876 | 0/0/2,011 | 0.028 | 0/5,379 |
| 2_235615236_G | SH3BP4 | 605611 | ENST00000322950 | − | c.865C>G (p.Pro289Ala) | NS | 0/3/875 | 0/0/2,020 | 0.028 | 0/5,378 |
| 3_46425043_A | CCRL2 | 608379 | ENST00000399036 | NM_003965.4 | c.469G>A (p.Val157Ile) | NS | 0/3/875 | 0/0/1,981 | 0.028 | 0/4,927 |
| 6_43054127_C | PEX6 | 601498 | ENST00000244546 | − | c.740C>G (p.Pro247Arg) | NS | 0/3/875 | 0/0/2,022 | 0.029 | 0/5,379 |
| 3_135148919_T | SLCO2A1 | 601460 | ENST00000310926 | NM_005630.2 | c.1166G>A (p.Arg389His) | NS | 0/3/875 | 0/0/2,022 | 0.029 | 0/5,379 |
| 3_15661572_G | BTD | 609019 | ENST00000303498 | NM_000060.2 | c.1205A>G (p.Asn402Ser) | NS | 0/3/875 | 0/0/2,022 | 0.029 | 0/5,379 |
| 13_47884428_T | P2RY5 | 609239 | ENST00000345941 | NM_001162498.1 | c.133G>A (p.Val45Ile) | NS | 0/3/875 | 0/0/2,022 | 0.029 | 0/5,379 |
| 5_153746175_G | GALNT10 | 608043 | ENST00000377661 | − | c.862T>G (p.Ser288Ala) | NS | 0/3/876 | 0/0/2,022 | 0.029 | 0/5,379 |
| 4_157080116_T | CTSO | 600550 | ENST00000281527 | − | c.409G>A (p.Val137Met) | NS | 0/3/876 | 0/0/2,022 | 0.029 | 0/5,379 |
| 19_45206312_A | ZNF546 | − | ENST00000347077 | NM_178544.3 | c.394G>A (p.Asp132Asn) | NS | 0/3/875 | 0/0/2,022 | 0.029 | 0/5,379 |
A full list of variants with IGE-specific alleles is provided in Table S2. The following abbreviations are used: IGE, idiopathic generalized epilepsy; MAF, minor allele frequency; NS, nonsynonymous; and SG, stop gained.
Counts include both sequenced and iSelect genotyped samples.
Fisher's exact test comparing carriers to noncarriers in the study cohort only (i.e., excluding NHLBI exome-sequenced samples).
In addition, among this set of candidate variants are two heterozygous variants—c.1205A>G (p.Asn402Ser) (Ensembl ENST00000303498) in BTD (MIM 609019) and c.740C>G (p.Pro247Arg) (Ensembl ENST00000244546 and RefSeq NM_000060) in PEX6 (MIM 601498)—in genes responsible for severe, recessive neurological disorders that usually include seizures (e.g., biotinidase deficiency [MIM 253260] and Zellweger syndrome [MIM 214100]). It is possible that a mutation in one copy of these genes might lead to less-severe phenotypes such as epilepsy alone.
Next, we evaluated SNVs that were found in the homozygous state exclusively in individuals with IGE (n = 72, Table 3 and Table S2). No homozygotes were observed in the EVS for 36 of these variants, and eight were not sequenced in the NHLBI cohort (Table S2). One variant in AGPAT3, encoding an acyltransferase involved in the phospholipid biosynthetic pathway,28 was homozygous in three unrelated IGE cases. This gene does not have any known direct involvement in epilepsy.
Table 3.
SNVs Called as Homozygotes in More than Two IGE-Affected Individuals and Absent in Homozygous Form in Controls
| Variant (chr_hg18 position_ allele) | SNP ID (dbSNP 129/Ensembl 50_36l) | Gene | Transcript (Ensembl 50_36l) | Transcript (RefSeq) | MIM Number | Position of Sequence and Amino Acid Change | Annotated Function | IGE Countsa(Hom/Nonhom) | Control Counts (Hom/Nonhom) | p Valueb | Homozygotes/Nonhomozygotes (NHLBI Cohort) |
|---|---|---|---|---|---|---|---|---|---|---|---|
| 21_44215700_T | ENSSNP7256682 | AGPAT3 | ENST00000398058 | NM_020132.4 | − | c.668C>T (p.Ala223Val) | NS | 3/876 | 0/1,987 | 0.028 | 0/5,379 |
| 4_113572281_T | rs35633116 | ALPK1 | ENST00000177648 | NM_025144.3 | 607347 | c.2129C>T (p.Ser710Phe) | NS | 2/876 | 0/1,994 | 0.094 | 0/5,379 |
| 3_38540580_T | rs1141223 | ENDOGL1 | ENST00000287675 | NM_005107.3 | 604051 | c.830G>T (p.Gly277Val) | NS | 2/877 | 0/1,994 | 0.094 | 0/5,379 |
| X_90577242_A | − | PABPC5 | ENST00000402906 | − | 300407 | c.10G>A4 (p.Gly4Arg) | NS | 3/874 | 0/1,095 | 0.088 | 0/5,379 |
A full list of variants with homozygous genotypes seen only in cases is provided in Table S3. The following abbreviations are used: IGE, idiopathic generalized epilepsy; NS, nonsynonymous; hom, homozygous; and nonhom, nonhomozygous.
Counts include both sequenced and iSelect genotyped samples.
p values compare counts of homozygotes (or hemizygotes) to those of nonhomozygotes (or nonhemizygotes).
In the interest of evaluating the phenotypic specificity of these candidate epilepsy-susceptibility variants, we have provided the number of JME and AE carriers in Tables S2 and S3. Even though we considered these to be very specific phenotypes, we still failed to identify study-wide significant associations.
Pathway Analysis of Genes Harboring Candidate Epilepsy-Susceptibility Variants
We performed a pathway analysis including all 1,183 genes harboring a SNV with a genotype exclusive to individuals with IGE, JME, or AE (and also absent from the NHLBI control cohort) by using the Reactome software.29 After applying a Bonferroni correction for the number of tests performed, we observed no pathways significantly overrepresented in any phenotypic group (detailed pathway results for genes associated with the IGE phenotype are provided in Table S3).
Discussion
In this study, we evaluated 3,349 candidate epilepsy-susceptibility variants (identified in an exome-sequencing study of 118 IGE cases) in a larger cohort of 878 cases and 1,830 controls and did not find any variants with statistically significant associations. One possible explanation for the lack of significant findings is that epilepsy-susceptibility variants are sufficiently rare that each one accounts for only a small fraction of individuals with epilepsy. This finding is consistent with that observed with CNVs in epilepsy disorders in that deletions at 15q13.3 and 16p13.11—despite the fact that they explain a significant proportion of cases—are very rare when one considers each identical-by-descent deletion event.3,4,9,24,30 If this supposition is true, then among the list of candidate susceptibility variants identified in this sequencing study is a set of very rare disease-causing variants. Of the 3,349 variants studied, 1,325 variants or homozygous genotypes, including 103 that were observed in additional IGE cases in the follow-up phase and 118 that are located in genes previously implicated in linkage studies of individuals with IGE, remain exclusively present in cases (they are absent from both the current study control cohort and the NHLBI cohort) (Tables S1 and S4).
Under the assumption that some of these candidate rare variants are causal (Tables S2 and S3), we can use our data to estimate the extent of genetic heterogeneity in IGE. The variant observed most commonly in the IGE cases studied here (c.620C>T [p.Ala207Val] in PSME2; 14_23682683_A; Ensembl ENST00000396881; Table 2) appears to account for approximately 0.6% of the studied cases, assuming that the variant ultimately proves to be causal. When we consider variants with genotypes exclusively seen in individuals with JME and absent in all control populations and study participants with a diagnosis of AE or schizophrenia, no single variant identified in our study can explain more than 1% of individuals with JME. Likewise, no single variant can explain more than 1.5% of AE cases evaluated in this study. Collectively, this suggests that no single-base substitution affecting the protein (represented in the exome data) causes epilepsy in a large percentage of IGE cases (or JME or AE cases), a finding consistent with a model of high genetic heterogeneity, probably including both locus and allelic heterogeneity. It is also likely that gene-level association analyses might effectively guide us toward epilepsy-susceptibility genes that would be readily missed in the single-variant analyses in this study as a result of allelic heterogeneity. Consistent with this hypothesis, we note that many of the identified case-only variants (absent in both this study cohort and the NHLBI cohort) reside in the same gene (Tables S1 and S2). In total, 115 genes, including seven genes with a rare variant in more than three IGE-affected individuals and two genes with a rare variant in six IGE study subjects, have multiple rare variants in IGE cases only (Table S5). Assuming that allelic heterogeneity might contribute in part to the overall genetic heterogeneity associated with IGE, future studies should focus on gene-level association analyses.
It is possible that beyond locus and allelic heterogeneity, other multilocus models might account for the negative results we observed in our study. Although oligogenic, polygenic, or epistatic modes of disease-risk inheritance are possible, statistical proof for these multivariant models has to withstand very high thresholds of multiple testing to be detected in NGS studies. It is likely that if these models account for some fraction of disease risk, they will only be secondarily identified in NGS studies if marginal effects of single variants can be detected in very large sample sizes.
Although it does not yet provide definitive evidence of specific risk factors, this work makes a number of important contributions to epilepsy genetics. First and most fundamentally, this work strongly suggests that moderately rare variants with intermediate effects (“goldilocks alleles”31) do not play a major role in the risk of IGE. In this study, we had 80% power to detect a putatively functional coding SNV with a frequency of 0.5% and a relative risk of 5.4. However, power decreases as the variants become rarer or carry less relative risk. Although the power for obtaining secure evidence for an association of any individual variant with MAFs between 0.1% and 0.5% in this study is only modest (for example, ∼10% power for detecting a SNV with a MAF of 0.3% and a relative risk of 5), we would have detected some of them here if there were many such IGE-susceptibility alleles in the human gene pool. This suggests that discovery will require designs that can provide evidence of variants that are outside this range in terms of either effect size or allele frequency or both.
Second, this study provides a candidate gene list that is likely to include real IGE risk factors. Interestingly, the pathway analysis of the genes harboring candidate epilepsy-susceptibility variants revealed no evidence of enrichment of genes encoding ion channels or ion-channel modifiers (Table S3). This lack of enrichment of protein-disrupting ion-channel mutations in individuals with epilepsy is consistent with what was observed by Klassen et al.32 Collectively, these findings suggest that the pathophysiology governing epilepsy might be far more complex than simply a disorder of disrupted ion channels (“channelopathy”), as was suggested by early studies of Mendelian epilepsies.
Third, the results of this study provide a benchmark against which researchers can compare small studies that are likely to emerge in the near future and claim evidence of pathogenicity. Given the near comprehensive assessment of coding variation reported here, pathogenicity claims based on small discovery samples need to be treated with caution. Finally, under the assumption that some of the variants reported here as exclusive to epilepsy cases are real risk factors, these results give us the opportunity to estimate how many samples will be needed for statistically significant evidence of any single associated variant. By assuming that the frequency of the risk alleles observed in our follow-up sample is correct and by simply scaling up the sample sizes, we can determine at what point we expect to achieve p < 6 × 10⁻⁷, which would be sufficiently low to account for the testing of the >100,000 variants identified in the sequenced cohort. In this study, candidate variants were seen at a frequency range of 0.06%–0.3% among study subjects with IGE. If these frequencies are consistent in follow-up cohorts, we would need equivalently sized case and control cohorts of between 2,000 and 6,000 individuals each to prove the association of variants seen at a frequency of 0.1%–0.5% of IGE cases. Importantly, for variants that are seen in only one case (those that have a frequency of approximately 0.06%), proving pathogenicity is virtually out of reach even with large sample sizes; such variants will probably only be securely implicated through gene-based association analyses in large sample sizes and, where available, cosegregation analyses within multiplex families.33
Acknowledgments
We thank all the individuals who kindly participated, as well as the physicians who recruited them. We also acknowledge all of the collaborators and groups who contributed controls for ascertaining the frequency of candidate variants in the population; these collaborators include the Murdock Study Community Registry and Biorepository (R. Murdock), D. Daskalakis, D. Attix, V. Dixon, O. Chiba-Falek, J. McEvoy, V. Shashi, R. Brown, A. Holden, E. Behr, W. Lowe, P. Lugar, J. Milner, K. Welsh-Bohmer, C. Hulette, J. Burke, D. Valle, J. Hoover-Fong, N. Sobriera, D. Marchuk, S. Palmer, E. Pras, D. Lancet, and Z. Farfel. This project was funded by the National Institute of Neurological Disorders and Stroke (RC2NS070344), the National Institute of Mental Health (RC2MH089915), the National Institute of Allergy and Infectious Diseases (UO1AIO67854, 1RC2NS070342), the Ellison Medical Foundation (O. Chiba-Falek), the National Institute on Aging (P30 AG028377), the Wellcome Trust (084730), the National Institute for Health Research (grant 08-08-SCC), the Fonds National de la Recherche Scientifique, the Fondation Erasme, Université Libre de Bruxelles, Brainwave–The Irish Epilepsy Association/the Medical Research Charities Group of Ireland/Health Research Board award 2009/001, and the Programme for Human Genomics and the Programme for Research in Third Level Institutions (PRTLI3) funded by the Irish Higher Education Authority. M.M.C. was supported by a Health Research Board of Ireland's Translational Research Scholars award.
Contributor Information
Erin L. Heinzen, Email: e.heinzen@duke.edu.
David B. Goldstein, Email: d.goldstein@duke.edu.
Supplemental Data
Web Resources
The URLs for data presented herein are as follow:
HUGO Gene Nomenclature Committee, http://www.genenames.org
NHLBI Exome Sequencing Project Exome Variant Server, http://snp.gs.washington.edu/EVS
Online Mendelian Inheritance in Man (OMIM), http://www.omim.org
Picard, http://picard.sourceforge.net
Reactome, http://www.reactome.org
SequenceVariantAnalyzer, http://www.svaproject.org
References
- 1.Need A.C., Goldstein D.B. Whole genome association studies in complex diseases: Where do we stand? Dialogues Clin. Neurosci. 2010;12:37–46. doi: 10.31887/DCNS.2010.12.1/aneed. [DOI] [PMC free article] [PubMed] [Google Scholar]
- 2.Aldinger K.A. Copy number variation at 1q21.1 results in a spectrum of developmental abnormalities. Clin. Genet. 2009;75:425–427. doi: 10.1111/j.1399-0004.2009.01186_2.x. [DOI] [PubMed] [Google Scholar]
- 3.Heinzen E.L., Radtke R.A., Urban T.J., Cavalleri G.L., Depondt C., Need A.C., Walley N.M., Nicoletti P., Ge D., Catarino C.B. Rare deletions at 16p13.11 predispose to a diverse spectrum of sporadic epilepsy syndromes. Am. J. Hum. Genet. 2010;86:707–718. doi: 10.1016/j.ajhg.2010.03.018. [DOI] [PMC free article] [PubMed] [Google Scholar]
- 4.Mefford H.C., Muhle H., Ostertag P., von Spiczak S., Buysse K., Baker C., Franke A., Malafosse A., Genton P., Thomas P. Genome-wide copy number variation in epilepsy: Novel susceptibility loci in idiopathic generalized and focal epilepsies. PLoS Genet. 2010;6:e1000962. doi: 10.1371/journal.pgen.1000962. [DOI] [PMC free article] [PubMed] [Google Scholar]
- 5.Stefansson H., Rujescu D., Cichon S., Pietiläinen O.P., Ingason A., Steinberg S., Fossdal R., Sigurdsson E., Sigmundsson T., Buizer-Voskamp J.E., GROUP Large recurrent microdeletions associated with schizophrenia. Nature. 2008;455:232–236. doi: 10.1038/nature07229. [DOI] [PMC free article] [PubMed] [Google Scholar]
- 6.Need A.C., Ge D., Weale M.E., Maia J., Feng S., Heinzen E.L., Shianna K.V., Yoon W., Kasperaviciūte D., Gennarelli M. A genome-wide investigation of SNPs and CNVs in schizophrenia. PLoS Genet. 2009;5:e1000373. doi: 10.1371/journal.pgen.1000373. [DOI] [PMC free article] [PubMed] [Google Scholar]
- 7.Weiss L.A., Shen Y., Korn J.M., Arking D.E., Miller D.T., Fossdal R., Saemundsen E., Stefansson H., Ferreira M.A., Green T., Autism Consortium Association between microdeletion and microduplication at 16p11.2 and autism. N. Engl. J. Med. 2008;358:667–675. doi: 10.1056/NEJMoa075974. [DOI] [PubMed] [Google Scholar]
- 8.de Kovel C.G., Trucks H., Helbig I., Mefford H.C., Baker C., Leu C., Kluck C., Muhle H., von Spiczak S., Ostertag P. Recurrent microdeletions at 15q11.2 and 16p13.11 predispose to idiopathic generalized epilepsies. Brain. 2010;133:23–32. doi: 10.1093/brain/awp262. [DOI] [PMC free article] [PubMed] [Google Scholar]
- 9.Helbig I., Mefford H.C., Sharp A.J., Guipponi M., Fichera M., Franke A., Muhle H., de Kovel C., Baker C., von Spiczak S. 15q13.3 microdeletions increase risk of idiopathic generalized epilepsy. Nat. Genet. 2009;41:160–162. doi: 10.1038/ng.292. [DOI] [PMC free article] [PubMed] [Google Scholar]
- 10.Vacic V., McCarthy S., Malhotra D., Murray F., Chou H.H., Peoples A., Makarov V., Yoon S., Bhandari A., Corominas R. Duplications of the neuropeptide receptor gene VIPR2 confer significant risk for schizophrenia. Nature. 2011;471:499–503. doi: 10.1038/nature09884. [DOI] [PMC free article] [PubMed] [Google Scholar]
- 11.Hemminki K., Li X., Johansson S.E., Sundquist K., Sundquist J. Familial risks for epilepsy among siblings based on hospitalizations in Sweden. Neuroepidemiology. 2006;27:67–73. doi: 10.1159/000094976. [DOI] [PubMed] [Google Scholar]
- 12.Berkovic S.F., Howell R.A., Hay D.A., Hopper J.L. Epilepsies in twins: Genetics of the major epilepsy syndromes. Ann. Neurol. 1998;43:435–445. doi: 10.1002/ana.410430405. [DOI] [PubMed] [Google Scholar]
- 13.Commission on Classification and Terminology of the International League Against Epilepsy Proposal for revised classification of epilepsies and epileptic syndromes. Epilepsia. 1989;30:389–399. doi: 10.1111/j.1528-1157.1989.tb05316.x. [DOI] [PubMed] [Google Scholar]
- 14.Li H., Durbin R. Fast and accurate short read alignment with Burrows-Wheeler transform. Bioinformatics. 2009;25:1754–1760. doi: 10.1093/bioinformatics/btp324. [DOI] [PMC free article] [PubMed] [Google Scholar]
- 15.Li H., Handsaker B., Wysoker A., Fennell T., Ruan J., Homer N., Marth G., Abecasis G., Durbin R., 1000 Genome Project Data Processing Subgroup The Sequence Alignment/Map format and SAMtools. Bioinformatics. 2009;25:2078–2079. doi: 10.1093/bioinformatics/btp352. [DOI] [PMC free article] [PubMed] [Google Scholar]
- 16.Ge D., Ruzzo E.K., Shianna K.V., He M., Pelak K., Heinzen E.L., Need A.C., Cirulli E.T., Maia J.M., Dickson S.P. SVA: Software for annotating and visualizing sequenced human genomes. Bioinformatics. 2011;27:1998–2000. doi: 10.1093/bioinformatics/btr317. [DOI] [PMC free article] [PubMed] [Google Scholar]
- 17.Adzhubei I.A., Schmidt S., Peshkin L., Ramensky V.E., Gerasimova A., Bork P., Kondrashov A.S., Sunyaev S.R. A method and server for predicting damaging missense mutations. Nat. Methods. 2010;7:248–249. doi: 10.1038/nmeth0410-248. [DOI] [PMC free article] [PubMed] [Google Scholar]
- 18.Need A.C., McEvoy J.P., Gennarelli M., Heinzen E.L., Ge D., Maia J.M., Shianna K.V., He M., Cirulli E.T., Gumbs C.E. Exome Sequencing Followed by Large-Scale Genotyping Suggests a Limited Role for Moderately Rare Risk Factors of Strong Effect in Schizophrenia. Am. J. Hum. Genet. 2012 doi: 10.1016/j.ajhg.2012.06.018. Published online August 2, 2012. [DOI] [PMC free article] [PubMed] [Google Scholar]
- 19.Purcell S., Neale B., Todd-Brown K., Thomas L., Ferreira M.A., Bender D., Maller J., Sklar P., de Bakker P.I., Daly M.J., Sham P.C. PLINK: A tool set for whole-genome association and population-based linkage analyses. Am. J. Hum. Genet. 2007;81:559–575. doi: 10.1086/519795. [DOI] [PMC free article] [PubMed] [Google Scholar]
- 20.Price A.L., Patterson N.J., Plenge R.M., Weinblatt M.E., Shadick N.A., Reich D. Principal components analysis corrects for stratification in genome-wide association studies. Nat. Genet. 2006;38:904–909. doi: 10.1038/ng1847. [DOI] [PubMed] [Google Scholar]
- 21.Skol A.D., Scott L.J., Abecasis G.R., Boehnke M. Joint analysis is more efficient than replication-based analysis for two-stage genome-wide association studies. Nat. Genet. 2006;38:209–213. doi: 10.1038/ng1706. [DOI] [PubMed] [Google Scholar]
- 22.MacArthur D.G., Balasubramanian S., Frankish A., Huang N., Morris J., Walter K., Jostins L., Habegger L., Pickrell J.K., Montgomery S.B., 1000 Genomes Project Consortium A systematic survey of loss-of-function variants in human protein-coding genes. Science. 2012;335:823–828. doi: 10.1126/science.1215040. [DOI] [PMC free article] [PubMed] [Google Scholar]
- 23.Michos O., Panman L., Vintersten K., Beier K., Zeller R., Zuniga A. Gremlin-mediated BMP antagonism induces the epithelial-mesenchymal feedback signaling controlling metanephric kidney and limb organogenesis. Development. 2004;131:3401–3410. doi: 10.1242/dev.01251. [DOI] [PubMed] [Google Scholar]
- 24.Sharp A.J., Mefford H.C., Li K., Baker C., Skinner C., Stevenson R.E., Schroer R.J., Novara F., De Gregori M., Ciccone R. A recurrent 15q13.3 microdeletion syndrome associated with mental retardation and seizures. Nat. Genet. 2008;40:322–328. doi: 10.1038/ng.93. [DOI] [PMC free article] [PubMed] [Google Scholar]
- 25.Pagnamenta A.T., Wing K., Sadighi Akha E., Knight S.J., Bölte S., Schmötzer G., Duketis E., Poustka F., Klauck S.M., Poustka A., International Molecular Genetic Study of Autism Consortium A 15q13.3 microdeletion segregating with autism. Eur. J. Hum. Genet. 2009;17:687–692. doi: 10.1038/ejhg.2008.228. [DOI] [PMC free article] [PubMed] [Google Scholar]
- 26.Murata S., Udono H., Tanahashi N., Hamada N., Watanabe K., Adachi K., Yamano T., Yui K., Kobayashi N., Kasahara M. Immunoproteasome assembly and antigen presentation in mice lacking both PA28alpha and PA28beta. EMBO J. 2001;20:5898–5907. doi: 10.1093/emboj/20.21.5898. [DOI] [PMC free article] [PubMed] [Google Scholar]
- 27.Mishto M., Ligorio C., Bellavista E., Martucci M., Santoro A., Giulioni M., Marucci G., Franceschi C. Immunoproteasome expression is induced in mesial temporal lobe epilepsy. Biochem. Biophys. Res. Commun. 2011;408:65–70. doi: 10.1016/j.bbrc.2011.03.117. [DOI] [PubMed] [Google Scholar]
- 28.Shindou H., Shimizu T. Acyl-CoA:lysophospholipid acyltransferases. J. Biol. Chem. 2009;284:1–5. doi: 10.1074/jbc.R800046200. [DOI] [PubMed] [Google Scholar]
- 29.Vastrik I., D'Eustachio P., Schmidt E., Gopinath G., Croft D., de Bono B., Gillespie M., Jassal B., Lewis S., Matthews L. Reactome: A knowledge base of biologic pathways and processes. Genome Biol. 2007;8:R39. doi: 10.1186/gb-2007-8-3-r39. [DOI] [PMC free article] [PubMed] [Google Scholar]
- 30.Mefford H.C., Mulley J.C. Genetically complex epilepsies, copy number variants and syndrome constellations. Genome Med. 2010;2:71. doi: 10.1186/gm192. [DOI] [PMC free article] [PubMed] [Google Scholar]
- 31.Price A.L., Kryukov G.V., de Bakker P.I., Purcell S.M., Staples J., Wei L.J., Sunyaev S.R. Pooled association tests for rare variants in exon-resequencing studies. Am. J. Hum. Genet. 2010;86:832–838. doi: 10.1016/j.ajhg.2010.04.005. [DOI] [PMC free article] [PubMed] [Google Scholar]
- 32.Klassen T., Davis C., Goldman A., Burgess D., Chen T., Wheeler D., McPherson J., Bourquin T., Lewis L., Villasana D. Exome sequencing of ion channel genes reveals complex profiles confounding personal risk assessment in epilepsy. Cell. 2011;145:1036–1048. doi: 10.1016/j.cell.2011.05.025. [DOI] [PMC free article] [PubMed] [Google Scholar]
- 33.The Epi4K Consortium Epi4K: Gene Discovery in 4,000 Genomes. Epilepsia. 2012 doi: 10.1111/j.1528-1167.2012.03511.x. Published online May 29, 2012. [DOI] [PMC free article] [PubMed] [Google Scholar]
Associated Data
This section collects any data citations, data availability statements, or supplementary materials included in this article.