

Abstract
We propose in this paper a unified approach for testing the association between rare variants and phenotypes in sequencing association studies. This approach maximizes power by adaptively using the data to optimally combine the burden test and the nonburden sequence kernel association test (SKAT). Burden tests are more powerful when most variants in a region are causal and the effects are in the same direction, whereas SKAT is more powerful when a large fraction of the variants in a region are noncausal or the effects of causal variants are in different directions. The proposed unified test maintains the power in both scenarios. We show that the unified test corresponds to the optimal test in an extended family of SKAT tests, which we refer to as SKAT-O. The second goal of this paper is to develop a small-sample adjustment procedure for the proposed methods for the correction of conservative type I error rates of SKAT family tests when the trait of interest is dichotomous and the sample size is small. Both small-sample-adjusted SKAT and the optimal unified test (SKAT-O) are computationally efficient and can easily be applied to genome-wide sequencing association studies. We evaluate the finite sample performance of the proposed methods using extensive simulation studies and illustrate their application using the acute-lung-injury exome-sequencing data of the National Heart, Lung, and Blood Institute Exome Sequencing Project.
Introduction
Array-based genotyping technologies have been used successfully in hundreds of genome-wide association studies in the last few years for identifying over one thousand common genetic variants associated with many complex diseases. The recent advance of massively parallel sequencing technologies1,2 has transformed human genetic research. These emerging sequencing technologies provide a rich opportunity to study the association between rare variants and complex traits. Rare variants, which have minor allele frequencies (MAFs) of less than 0.01∼0.05, might play an important role in the etiology of complex traits and account for missing heritability unexplained by common variants.3,4 Several complex traits have been found to be associated with rare variants.5–7
In recent years, significant efforts have been devoted to developing powerful and computationally efficient statistical methods for testing associations between rare variants and complex traits. Single-variant tests are typically conducted to investigate associations of common variants and phenotypes; however the same approach has little power for testing for rare-variant effects because of their low frequencies and large numbers. Instead, the statistical development of rare-variant analysis has been focused on testing cumulative effects of rare variants in genetic regions or SNP sets, such as genes. These tests can be broadly classified as burden and nonburden tests.
Burden tests collapse rare variants in a genetic region into a single burden variable and then regress the phenotype on the burden variable to test for the cumulative effects of rare variants in the region. Examples of the burden tests include the cohort allelic sum test,8 the combined multivariate and collapsing method,9 and the nonparametric weighted sum test (WST),10 which imposes weights when collapsing rare variants. Several alternative burden methods are largely based on the same approach.11–14 Because all burden tests implicitly assume that all the rare variants in a region are causal and affect the phenotype in the same direction with similar magnitudes, they suffer from a substantial loss of power when these assumptions are violated.15,16
Kernel-based test methods, such as the sequence kernel association test (SKAT),17 are nonburden tests. Instead of aggregating variants, SKAT aggregates individual variant-score test statistics with weights when SNP effects are modeled linearly. More generally, SKAT aggregates the associations between variants and the phenotype through a kernel matrix and can allow for SNP-SNP interactions, i.e., epistatic effects. SKAT is especially powerful when a genetic region has both protective and deleterious variants or many noncausal variants. SKAT is derived as a variance-component test in the induced mixed models wherein regression coefficients are assumed to be independent and follow a distribution with the variance component. SKAT efficiently calculates the p value analytically for large samples; hence, it is computationally fast for analyzing genome-wide sequencing association studies. It has been shown that some nonburden tests15,18,19 constitute a special case of SKAT.16,17
Although SKAT provides attractive power and makes few assumptions about rare-variant effects, it has several limitations. It can be less powerful than burden tests if a large proportion of the rare variants in a region are truly causal and influence the phenotype in the same direction.16,17 In addition, large-sample-based p value calculations, which SKAT uses, can produce conservative type I errors for small-sample case-control sequencing association studies, which could lead to power loss.17,20 This is particularly an issue in current exome-sequencing studies, which are often of small sizes.
This paper aims to address the limitations of burden tests and SKAT and has two objectives. First, we propose a unified test for rare-variant effects by using the data to find the optimal linear combination of the burden test and SKAT to maximize the power. We show that this unified test belongs to an extended SKAT family by allowing the correlation of the regression coefficients of variants.21 We hence term this optimal unified test, which is optimal in both scenarios, as SKAT-O. Specifically, using the data, SKAT-O automatically behaves like the burden test when the burden test is more powerful than SKAT, and behaves like SKAT when the SKAT is more powerful than the burden test.
The second objective of this paper is to improve the performance of SKAT and SKAT-O in small-sample case-control sequencing association studies. The original SKAT test has been found to be conservative for small samples.17,20 In this paper, we develop an analytic adjustment method for SKAT and SKAT-O by precisely estimating the small-sample variance and kurtosis. This allows us to precisely calculate the reference distribution for a small sample, thereby properly controlling the type I error. This is motivated by the fact that many of the current exome-sequencing studies, such as those in the National Heart, Lung, and Blood Institute (NHLBI) Exome Sequencing Project (ESP), have small sample sizes; e.g., the acute lung injury (ALI) exome-sequencing data that are discussed in this paper have 88 subjects and the chronic Pseudomonas aeruginosa infection exome-sequencing data have 91 subjects.22 The proposed small-sample adjustment method is computationally fast and can be effectively applied to whole-exome and whole-genome sequencing studies.
Using extensive simulations and analysis of the ALI exome-sequencing data of the NHLBI Lung Grand Opportunity (GO) ESP, we demonstrate that the small-sample-adjusted unified test (SKAT-O) has proper type I error rates for small-sample sequencing association studies, has higher power in a wide range of settings, and is more robust than SKAT and the burden tests.
Material and Methods
For simplicity, we assume that we are interested in testing the association between rare variants in a region, e.g., a gene, and a complex trait. For whole-exome and whole-genome sequencing studies, the same method can be applied to one gene or one region at a time and then adjusted for multiple comparisons with the user’s method of choice. For whole-genome sequencing studies, one can consider analysis of one window of the same size, e.g., 10 kb, at a time using the moving-window approach or of different sizes, using haplotype blocks.
Sequence Kernel Association Test
Assume n subjects are sequenced in a region, e.g., a gene, that has m variants. For the subject, let denote a dichotomous phenotype, the genotypes of the m variants , and the covariates. Without loss of generosity, we assume an additive genetic model and a binary trait. Results are similar for quantitative traits. To relate genotypes to a dichotomous phenotype, we consider the logistic regression model
| (Equation 1) |
where is the disease probability, is an vector of regression coefficients of covariates, and is an vector of regression coefficients of genetic variants. The standard m degrees of freedom (df) test for no genetic association, H0: , has little statistical power when m is large. Several approaches have been proposed to reduce the df and increase analysis power. Two classes of tests have been proposed: burden and nonburden tests.
Burden tests treat the s as the same up to a weight function; i.e., , where is a weight function that may depend on properties of the variant. For example, one can assume to be a function of MAF. Then Equation 1 becomes
| (Equation 2) |
and the association between the m genetic variants and a dichotomous trait can be tested using a one-df test for H0: . Suppose is the estimated probability of under the null hypothesis; i.e., is calculated by fitting the null model
| (Equation 3) |
Then the burden score statistic for testing is
| (Equation 4) |
which asymptotically follows scaled under the null hypothesis. This weighted burden test is equivalent to the WST of Madsen and Browning10 and Han and Pan,13 wherein Madsen and Browning10 assumed , where is the estimated MAF for SNP j using controls. When all are the same and analysis is restricted to rare variants, e.g., the variants with MAF , is equivalent to the Morris and Zeggini test.12 The key limitation of the weighted burden test is that it assumes all rare variants in the region are causal and are associated with the trait in the same direction with the same magnitude after weighting, and thus the presence of both protective and deleterious variants or a large number of noncausal variants would substantially reduce its statistical power.
SKAT,17 which includes the C-alpha test15 and the SSU test18 as a special case, is a nonburden test. SKAT assumes that the in Equation 1 are independent and follow an arbitrary distribution with mean 0 and variance . The null hypothesis in the model in Equation 1 is equivalent to the hypothesis . Hence, SKAT is a variance-component test under the induced logistic mixed model.23 Specifically, under the logistic model (Equation 1), the SKAT statistic can be written as
| (Equation 5) |
where is a vector of the estimated probability of y under the null model (Equation 3), and is an kernel matrix, where is an genotype matrix, and is an diagonal weight matrix. The SKAT statistic can be simplified as the weighted sum of the individual SNP score statistics as
| (Equation 6) |
where is the score statistic for testing in the single-SNP model with only the jth SNP,
Note that the notation of the weights here is slightly different from that of Wu et al.17 Our here was denoted as in Wu et al.17 We modified the notation in this paper to allow for a simple notation for the burden test.
The weight can be flexibly chosen using the observed data, such as a function of MAF, or external information, such as a PolyPhen or SIFT score.24,25 For example, the beta density function of MAF can be used as a weight function in which , where is the estimated MAF for SNP j using all cases and controls, and the parameters and are prespecified. The SKAT test statistic asymptotically follows a mixture of chi-square distributions.17 For large samples, the p value of SKAT can be quickly and accurately calculated by either matching the moments or inverting the characteristic function.26–28
A comparison of the burden statistic in Equation 4 and the SKAT statistic in Equation 6 shows that the burden test aggregates the variants first before performing regression, whereas SKAT aggregates individual variant-test statistics. Hence, SKAT is robust to the mixed signs of βs and a large fraction of noncausal variants.
Optimal Unified Association Test
The foregoing discussions suggest that burden tests are not powerful when the target region has many noncausal variants or when causal variants have different directions of association, whereas SKAT is powerful in these situations.17 However, if the target region has a high proportion of causal variants with the effects in the same direction, burden tests can be more powerful than SKAT. Because such prior biological knowledge is often unknown, and the underlying genetic mechanisms vary from one gene to another across the genome, the development of a test that is optimal for both scenarios in whole-exome and whole-genome sequencing studies is of substantial interest. Here, we propose a unified test that includes burden tests and SKAT in one framework. In particular, the test statistic of the proposed unified test is
| (Equation 7) |
which is a weighted average of SKAT and burden-test statistics. One can easily see that the unified test reduces to SKAT when and to the burden test when ; i.e, the class of tests includes the burden test and SKAT as special cases. One can further show that the unified test (Equation 7) is equivalent to the generalized SKAT test,21 derived as the variance component score statistic assuming the regression coefficients in Equation 1 follow an arbitrary distribution with mean 0 and variance and pairwise correlation ρ between different s as
| (Equation 8) |
where is an kernel matrix, is an compound symmetric matrix, and . This implies that the weight ρ in Equation 7 can be interpreted as the correlation of the regression coefficients s . If the regression coefficients are perfectly correlated , they will be all the same after weighting, and one should collapse the variants first before running regression, i.e., using the burden test. If the regression coefficients are unrelated to each other, one should use SKAT.
In practice, the optimal weight ρ is unknown and needs to be estimated from the data to maximize the power. Lee et al.21 proposed the optimal-test procedure for the generalized SKAT, which selects the weight ρ to maximize the power. It follows that the optimal unified test can be calculated as
| (Equation 9) |
where is the p value computed on the basis of a given ρ. The optimal-unified-test statistic can be easily obtained through the simple grid search: set a grid , then
For large samples, Lee et al.21 showed that for a given ρ, each test statistic can be decomposed into a mixture of two random variables; one asymptotically follows a chi-square distribution with one df, and the other can be asymptotically approximated to a mixture of chi-square distributions with a proper adjustment. Hence, the p value of can be quickly obtained analytically with the use of a one-dimensional numerical integration. We term the optimal unified test as SKAT-O in view of the fact that it is an optimal test in the generalized SKAT family.
Small-Sample Optimal Unified Test
One of the key strengths of SKAT and SKAT-O over the other competing methods is their ability to efficiently compute asymptotic p values without the need for resampling; also, it is easy to adjust for covariates. This is particularly advantageous in whole-genome and whole-exome sequencing studies wherein a large number of tests are performed and one needs to control for multiple comparisons and account for population stratification. However, when the trait is binary and sample sizes are small, e.g., hundreds of subjects, the large-sample-based p value calculations in Wu et al.17 and Lee et al.21 have been found to produce conservative results, which can lead to incorrect type I error control and power loss.17,20,21
As most current whole-exome sequencing studies, such as those of the NHLBI ESP, have small sample sizes, there is a pressing need to develop a method that works well for small samples. We propose in this section small-sample-adjusted p value calculations for SKAT and SKAT-O.
We first consider p value calculations for SKAT when sample sizes are small. When variants are rare, and the genotype matrix G is sparse, the small-sample variance of is much smaller than the asymptotic variance. Hence, we readjust the moments of the null distribution of . Suppose was obtained with known π. Denote this with , where is the probability of being a case under the null. Let , be a diagonal matrix of ordered nonzero eigenvalues, be an eigenvector matrix of , and be the element of . In Appendix A, we show that the small-sample mean and variance of SKAT under the null hypothesis are
| (Equation 10) |
where
A comparison of these results with those in Wu et al.17 shows that the small-sample mean of is the same as the asymptotic mean of , but the small-sample variance differs from the asymptotic variance. With the use of the estimated moments, the p value can then be calculated as
| (Equation 11) |
where is the distribution function of , and
and . is an estimated with . We can apply the same approach to SKAT-O; details are shown in Appendix B.
Note that the results here do not restrict the kernel matrix K to be the linear weighted kernel. This proposed small-sample adjustment procedure can be used for all types of kernel matrices, such as identity-by-state (IBS) and IBS-weighted kernels17,29
Small-Sample SKAT and Unified Test with Higher Moments Adjustments
In the previous section, we adjusted the asymptotic null distribution of and using the small-sample variance of and . If the sample size is very small, e.g., in the ALI whole-exome sequencing data, this approach may not be accurate enough to correct small-sample type I error rates. We thus need to adjust for higher moments, especially kurtosis. Unfortunately, deriving the analytical formula of the kurtosis of is a daunting task. Hence, we propose a practical approach in which the kurtosis is estimated through a resampling method. When there is no covariate, the kurtosis of the null distribution of can be estimated from B permutation samples of phenotypes, and then the estimated kurtosis can be used to calculate the df parameter in Equation 11.
Specifically, suppose is the SKAT test statistic from the permutation sample . The sample kurtosis is
where
The df of the mixture of the chi-square distribution in Equation 11 is modified as
and the p values can be calculated with Equation 11.
When there are covariates to adjust for, the simple permutation method cannot be used. Instead, we propose to generate resampled phenotypes from the parametric bootstrap.30 We first estimate under the null model and use it to generate with the same number of cases and controls.
It should be noted that our method has a computation-time advantage over calculating p values on the basis of permutations or bootstrap samples that are obtained as a proportion of larger than . For whole-exome sequencing studies, one needs to calculate p values at the 10−5–10−6 level to account for multiple comparison adjustments for performing tests for 20,000 genes. This requires more than 107–108 permutations or bootstraps for each gene. However, our approach requires sampling phenotypes under the null model only 10,000 times to obtain stable estimates of the higher moments. Note that the null model is the same across different genes, and hence the same resampled bootstrap phenotypes under the null model can be used for all the genes across the genome. Hence, we can save a substantial amount of computation time.
Numerical Simulations
We conducted extensive simulation studies to evaluate the performance of the proposed methods for binary traits when sample sizes are small. We generated sequence data of European ancestry from 10,000 chromosomes over 1 Mb regions using the calibrated coalescent model.31 We randomly selected regions with lengths of 3 kb and tested for associations in all simulation settings.
Type I Error Simulations
We first generated data sets under the null model to evaluate the type I error control of the proposed methods. Dichotomous phenotypes with 50% cases and 50% controls were generated from the null logistic regression model
where was a continuous covariate from , was a binary covariate from , and was chosen to create a trait prevalence of 0.01 under the null hypothesis. We applied six different methods to each of the randomly selected 3 kb regions: (1) counting-based burden test (N); (2) weighted burden test (W); (3) SKAT without small-sample adjustment (SKAT); (4) unified test without small-sample adjustment (SKAT-O); (5) small-sample-adjusted SKAT (adjusted SKAT); and (6) small-sample-adjusted unified test (adjusted SKAT-O).
For all methods except N, weights were used to upweight rarer variants. For N, we used flat weights and restricted variants with observed MAF . For both N and W, the likelihood-ratio test was used to compute p values. The p values of the optimal unified tests were computed using the 11 points of equal-sized grids search of ρ from 0 to 1. For adjusted SKAT and adjusted SKAT-O, the sample kurtosis was estimated from 10,000 bootstrapped phenotype sets. Three different total sample sizes (n = 200, 500, and 1,000) were considered, with 10,000 simulated data sets for each sample size.
To investigate type I error rates in the SKAT family tests when the α level is set at a level for exome-wide testing, we conducted simulations with slightly different settings. In order to reduce the computational burden, we first generated 20,000 genotype sets of randomly selected regions, and we then generated 500 phenotype sets for each genotype set. A total of 107 phenotypes were generated, and type I error rates were estimated by the proportion of p values smaller than the given α level.
Power Simulations
To evaluate the power of the proposed unified tests and their small-sample adjustments relative to the competing methods, we simulated data sets under the alternative model. As with the type I error simulations, we randomly selected 3 kb regions from a broader 1 Mb region, but we then randomly chose causal variants from the rare variants with true MAF . The dichotomous phenotypes with 50% cases and 50% controls were simulated from
where were selected causal variants. Covariates and followed the same distribution as in the type I error simulation, and was chosen to set the disease prevalence as 0.01 under the null hypothesis.
To study the effects of varying proportions of variants being causal variants, we considered three different settings, in which 10%, 20%, and 50% of the rare variants were causal variants. For each setting, we considered three different sign configurations of the nonzero βs: all s were positive, 80% of s were positive, and 50% of s were positive. We used , where was the MAF of the variant. When 10% of the rare variants were causal, , which gives an odds ratio equal to 7 for a variant with MAF = 0.01. When 20% and 50% of the rare variants were causal variants, and , respectively; therefore, the powers would not be too close to 1, and we can distinguish the powers of different methods. For each setting, 1,000 data sets were generated, and the power was estimated as the proportion of p values smaller than a given α level.
The NHLBI ALI Exome-Sequencing Data
The ALI whole-exome sequencing data were part of the Lung GO of the NLBLI ESP. We performed exome sequencing of 88 individuals with ALI32 selected from the extremes of the severity spectrum. Individuals with ALI and severe hypoxemia (ratio of partial pressure of arterial oxygen to fraction of inspired oxygen < 200) were enrolled from the intensive care unit at the Massachusetts General Hospital. Those with very high or very low “ventilator-free days” (VFD), a composite variable measuring the degree of dependence on mechanical ventilation in the first 28 days of hospital admission,33 were selected for sequencing. Exome sequencing was completed on 88 subjects (n = 43 high severity ALI [VFD < 2], n = 45 low severity ALI [VFD < 24]) at the Northwest Genomics Center at the University of Washington. This study was approved by the institutional review boards of the Massachusetts General Hospital, the Harvard School of Public Health, and the University of Washington.
The Genome Analysis Toolkit (GATK) of the Broad Institute was used for calling SNP variants,34 and approximately 130,000 SNP variants on 17,755 genes were identified. We subsequently filtered out variants with high missing rates (missing rate ) and low quality-control scores using GATK, i.e, keeping variants with Qual < 30, QD < 5, AB > 0.75 or SB > −0.10, and % of missing %. This yielded a total of 106,736 variants.
For SKAT and the unified test (SKAT-O), we used all the variants. For the weighted burden test (W) and the counting-based burden test (N), because of the very small sample size, we used MAF < 0.05 as the criterion for defining rare variants to be included in the analysis. Any genes with fewer than four rare variants with MAF < 0.05 were excluded from the analysis, as these genes have little information about association with the phenotype given the small sample size. A total of 6,488 genes remained for analysis. All six methods discussed in the simulation study were applied to the data. The first two principal components calculated with EIGENSOFT35 from all 106,736 variants were used as covariates for adjustment of possible population stratification.
Results
Type I Error Simulation Results
To investigate the type I error rates with exome-wide α levels, we generated 107 data sets. The results are given in Table 1. Three different , and levels were considered. Note that is Bonferroni-adjusted level when simultaneously testing 20,000 genes. Table 1 clearly shows that the unadjusted SKAT and unified test (SKAT-O) had substantially deflated type I error rates for small sample sizes. The unified test (SKAT-O) was less conservative than SKAT and had correct type I error control when the sample size was 1,000. Both the proposed small-sample-adjusted SKAT and the unified test (adjusted SKAT and adjusted SKAT-O) performed much better than their unadjusted counterparts in small samples. They controlled type I error rates accurately over all sample sizes and all significance levels. We also evaluated the type I error rates of the burden tests and SKAT and SKAT-O tests at using 10,000 simulated data sets (Table S1 available online), and the results agreed with Table 1. Overall, our type I error simulation results confirm empirically that the proposed small-sample adjustment methods accurately control type I error rates.
Table 1.
Simulation Studies of Type I Error Estimates of Four Different Methods of Testing an Association between Randomly Selected 3 kb Regions with Dichotomous Traits at Stringent α Levels α = 10−3, 10−4, and 2.5×10⁻⁶.
| α | SKAT | SKAT-O | Adjusted SKAT | Adjusted SKAT-O |
|---|---|---|---|---|
| Sample Size = 200 | ||||
| 10−3 | 1.84 × 10⁻⁴ | 5.03 × 10⁻⁴ | 1.13 × 10⁻³ | 1.24 × 10⁻³ |
| 10−4 | 5.30 × 10⁻⁶ | 3.20 × 10⁻⁵ | 1.01 × 10⁻⁴ | 1.04 × 10⁻⁴ |
| 2.5 × 10⁻⁶ | 1.00 × 10⁻⁷ | 3.00 × 10⁻⁷ | 3.20 × 10⁻⁶ | 2.50 × 10⁻⁶ |
| Sample Size = 500 | ||||
| 10−3 | 5.17 × 10⁻⁴ | 8.14 × 10⁻⁴ | 1.12 × 10⁻³ | 1.16 × 10⁻³ |
| 10−4 | 2.95 × 10⁻⁵ | 7.13 × 10⁻⁵ | 1.14 × 10⁻⁴ | 1.12 × 10⁻⁴ |
| 2.5 × 10⁻⁶ | 1.00 × 10⁻⁷ | 1.00 × 10⁻⁶ | 2.50 × 10⁻⁶ | 2.30 × 10⁻⁶ |
| Sample Size = 1,000 | ||||
| 10−3 | 7.22 × 10⁻⁴ | 1.00 × 10⁻³ | 1.09 × 10⁻³ | 1.12 × 10⁻³ |
| 10−4 | 5.59 × 10⁻⁵ | 1.02 × 10⁻⁴ | 1.22 × 10⁻⁴ | 1.19 × 10⁻⁴ |
| 2.5 × 10⁻⁶ | 1.00 × 10⁻⁶ | 2.80 × 10⁻⁶ | 3.20 × 10⁻⁶ | 3.10 × 10⁻⁶ |
Each entry represents type I error rate estimates as the proportion of p values smaller than α under the null hypothesis based on 107 simulated phenotypes.
Power Simulation Results
We compared the powers for the burden tests, SKAT, and the unified test (SKAT-O) and their small-sample adjustments, i.e., all of the six methods considered in the type I error simulations. The number of observed variants is given in Table S2. On average, depending on sample sizes, 20 to 40 variants were observed in each region. We first considered the scenario that all causal variants were deleterious variants, i.e., that the effects of the causal variants were all in the same direction. Figure 1 reports that by properly controlling the type I error, the small-sample-adjusted SKAT (adjusted SKAT) was more powerful than SKAT in every configuration, and the power gap was large when the sample size was small or when the significance level was small. The power for SKAT-O and its small-sample adjustment (adjusted SKAT-O) showed a similar pattern. Between the two burden tests, W was more powerful than N for these simulation configurations, suggesting that proper weighting can increase power.
Figure 1.
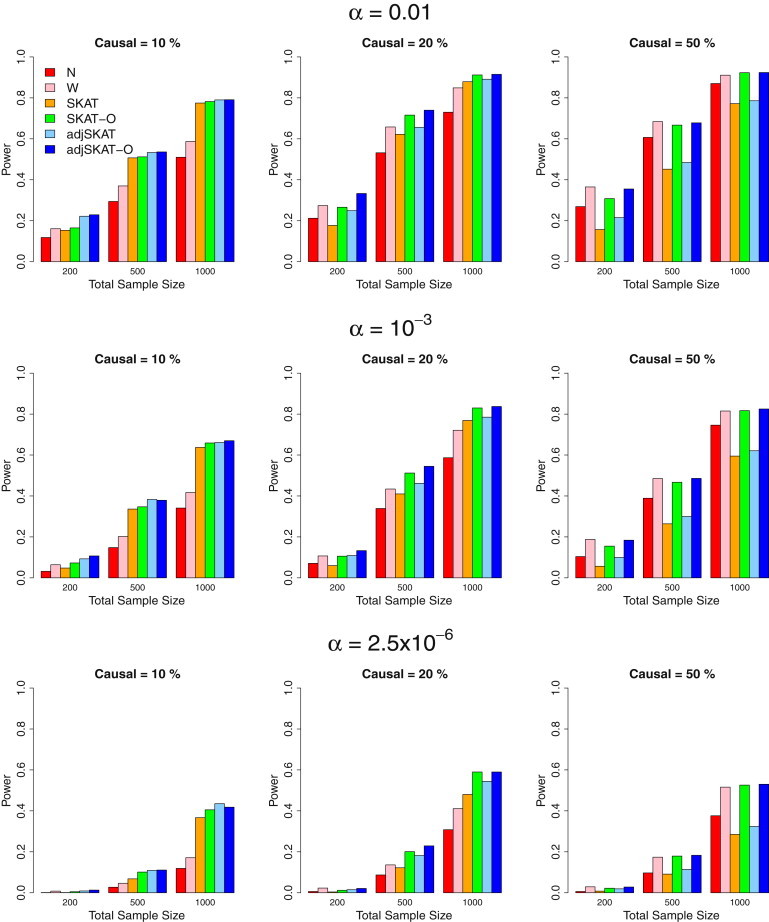
Power Estimates for the Six Competing Methods when All Causal Variants Were Deleterious
Empirical power of the six methods for randomly selected 3 kb regions wherein all causal variants were deleterious. From top to bottom, the plots consider the significance levels 0.01, , and , respectively. From left to right, the plots consider settings in which 10% of rare variants were causal, 20% of rare variants were causal, and 50% of rare variants were causal, respectively. For causal variants, we assumed , where was the MAF of the variant. A different c was used for the three panels from left to right: for the percentage of causal variants being 10%, 20%, and 50% respectively. Hence, the powers between the three panels from left to right are not comparable. Total sample sizes considered were 200, 500, and 1,000, and half were cases in case-control studies.
When only 10% of the rare variants were causal, adjusted SKAT was the most powerful test. The burden tests had the substantially lowest power, indicating that burden tests are not powerful in the presence of a large fraction of noncausal variants. When the proportion of causal rare variants increased, the burden tests performed better. When 50% of the rare variants were causal, the burden tests had a higher power than adjusted SKAT.
The optimal unified tests (SKAT-O and adjusted SKAT-O) consistently performed very well in both settings above. They behaved like SKAT when SKAT was more powerful than the burden tests, and they behaved like burden tests when the burden tests were more powerful than SKAT. Adjusted SKAT-O outperformed its unadjusted counterpart (SKAT-O), especially when sample sizes were small, e.g., n = 200. When 20% of rare variants were causal, adjusted SKAT-O was the most powerful test.
We next performed simulations in which 20%/80% and 50%/50% of causal variants were protective/deleterious variants (Figures 2 and 3). The same odds-ratio functions from above were used. Similar to the case wherein all causal variants were deleterious (Figure 1), adjusted SKAT had higher power than SKAT, and adjusted SKAT-O had higher power than its unadjusted counterpart (SKAT-O). The presence of mixed protective and deleterious variants substantially reduced the powers of burden tests, because the effects of the causal variants canceled out. With 50%/50% of the causal variants being protective/deleterious, the powers of the burden tests were less than half those of SKAT and its small-sample adjustment. The optimal unified test behaved similarly to SKAT but had better power than SKAT and the burden test when 50% of the rare variants were causal and 50%/50% of the causal variants were protective/deleterious. Small-sample adjustment for both SKAT and the unified test improved the power. All tests had lower power relative to the situation in which all causal variants were deleterious (Figure 1). This is because for the given low prevalence, the presence of protective variants resulted in fewer causal variants selected into the case-control sample (Table S3).
Figure 2.
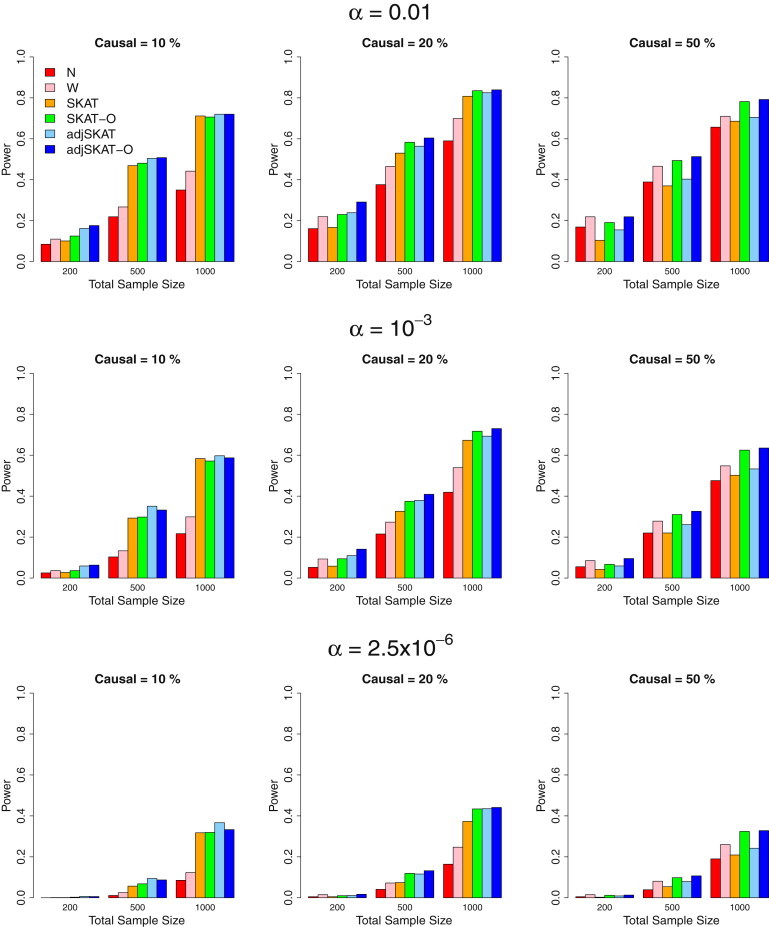
Power Estimates for the Six Competing Methods when 20%/80% of Causal Variants Were Protective/Deleterious
Empirical power of the six methods for randomly selected 3 kb regions wherein 20%/80% of causal variants were protective/deleterious. From top to bottom, the plots consider the significance levels 0.01, , and , respectively. From left to right, the plots consider settings in which 10% of rare variants were causal, 20% of rare variants were causal, and 50% of rare variants were causal, respectively. For causal variants, we assumed , where was the MAF of the variant. A different c was used for the three panels from the left to the right: for the percentage of causal variants being 10%, 20%, and 50% respectively. Hence, the powers between the three panels from left to right are not comparable. Total sample sizes considered were 200, 500, and 1,000, and half were cases in case-control studies.
Figure 3.
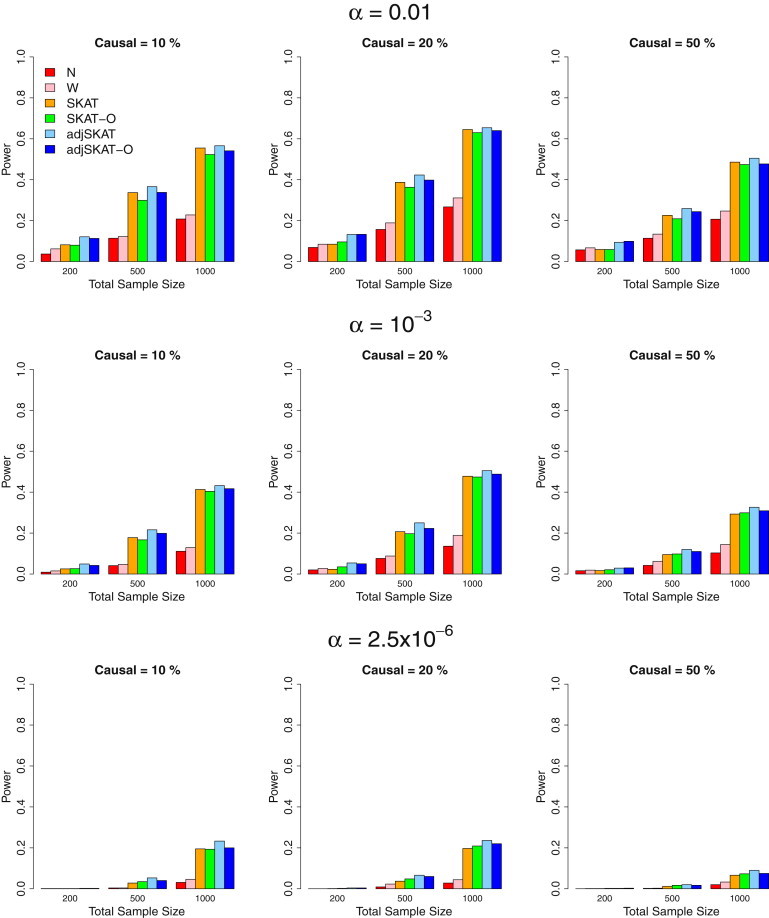
Power Estimates for the Six Competing Methods when 50%/50% of Causal Variants Were Protective/Deleterious
Empirical power of the six methods for randomly selected 3 kb regions wherein 50%/50% of causal variants were protective/deleterious. From top to bottom, the plots consider the significance levels 0.01, , and , respectively. From left to right, the plots consider settings in which 10% of rare variants were causal, 20% of rare variants were causal, and 50% of rare variants were causal, respectively. For causal variants, we assumed , where was the MAF of the variant. A different c was used for the three panels from left to right: for the percentage of causal variants being 10%, 20%, and 50%. Hence, the powers between the three panels from left to right are not comparable. Total sample sizes considered were 200, 500, and 1,000, and half were cases in case-control studies.
We present the optimal ρ values estimated by adjusted SKAT-O in Figure S5. It shows that SKAT-O generally selects large ρ values when the percentage of causal variants is high and all causal variants are deleterious, and selects small ρs when either the percentage of causal variants is low or some causal variants are protective. The estimated optimal ρ varies between different data sets as it accounts for sampling variation. We also conducted additional simulations for the extreme situation in which all rare variants in a region were causal and deleterious (Figure S6). In this scenario, the theoretical optimal . As expected, W has the highest power. The adjusted SKAT-O has a slightly smaller power than W, because it assumes ρ is unknown and searches for the optimal ρ in [0,1]. However, the power gap between W and adjusted SKAT-O is small.
The power simulation results show that the optimal unified test (SKAT-O) is robust to the proportion of rare variants that are causal and to the directions of the causal variant effects (relative to the other tests), it performs very well in a wide range of situations, and it outperforms SKAT and the burden tests. The proposed small-sample adjustment increases the power by properly controlling for type I error rate, especially when the sample size is small or α is very small.
Analysis of the NHLBI ALI Exome-Sequencing Data
We applied the six methods used in the simulation studies (burden tests, SKAT, the unified test [SKAT-O], and their small-sample adjustments) to analysis of the NHLBI ALI exome-sequencing data of 88 subjects to identify genes associated with ALI severity. We restricted our analysis to the genes with at least four variants with MAFs < 0.05. A total of 6,488 genes were analyzed (see Material and Methods).
Figure 4 gives the quantile-quantile (Q-Q) plots of the p values calculated with the use of all the six methods. Given the small sample size, no p value achieved the Bonferroni-adjusted genome-wide significance of . The Q-Q plots of the unadjusted SKAT and unified test (SKAT-O) were skewed downward, suggesting these tests were conservative. Interestingly, the Q-Q plots of the burden tests had a slightly anticonservative pattern. The Q-Q plots of the small-sample-adjusted SKAT and unified test (adjusted SKAT-O) were close to the 45 degree line, suggesting that the proposed small-sample adjustment methods worked well and properly controlled type I error rates. There were eight genes with p values < 10−3 by the adjusted SKAT-O. A total of 741 genes had the estimated optimal ρ values between 0.1 and 0.9.
Figure 4.
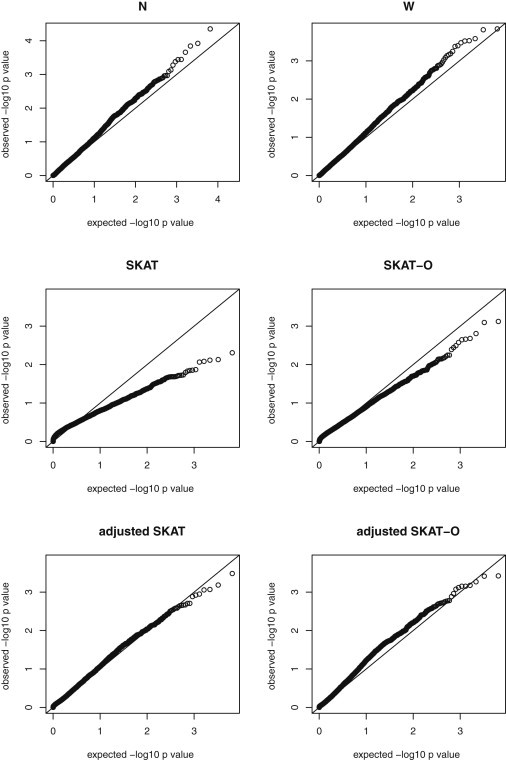
Analysis of the ALI Exome-Sequence Data
Q-Q plots of observed versus expected p values for the ALI exome-sequence data for the six methods: burden tests (N and W), SKAT, SKAT-O, adjusted SKAT, and adjusted SKAT-O. The x axis represents expected p values, and the y axis represents observed p values. A total of 6,488 genes with at least four rare variants were tested for associations with ALI severity.
We next restricted our analysis to the functional variants that are missense, nonsense, and splicing sites. Similar to the first analysis, we only considered genes that have at least four functional variants with MAF < 0.05. A total of 2,939 genes were used in the analysis. The Q-Q plots of the six methods are given in Figure S1. The patterns of these Q-Q plots are similar to those in Figure 4. There were five genes with p values < 10−3 by the adjusted SKAT-O. Myosin light chain kinase (MYLK [MIM 600922]), a gene that was previously found to be associated with susceptibility to ALI,36,37 was the second-most significant in the adjusted SKAT analysis and the fourth-most significant in the adjusted SKAT-O analysis.
We compared the p values obtained using small-sample-adjusted SKAT (adjusted SKAT) and the adjusted optimal unified test (adjusted SKAT-O) with those obtained using the burden test (W) (Figure S2). These comparisons show that the p values obtained with adjusted SKAT and W are quite different from each other, indicating that these two tests evaluate different aspects of association patterns. In contrast, the p values obtained with adjusted SKAT-O were more highly correlated with those obtained with either adjusted SKAT or W as p values declined, consistent with the expectation that the optimal unified test uses the data to adaptively choose an optimal test to maximize power.
Discussion
In this paper, we present a unified rare-variant test framework that includes both burden tests and the nonburden SKAT as special cases. The proposed optimal unified test (SKAT-O) procedure uses the data to adaptively select the best linear combination of the burden test and SKAT to maximize test power. Similar to SKAT, the proposed SKAT-O is computationally efficient and easily adjusts for covariates such as age, gender, and principal components for population stratifications. We show in simulation studies that SKAT and burden tests can both lose power when underlying assumptions are violated. However, the optimal unified test SKAT-O is more robust in a wide range of the circumstances we have considered. In the SKAT package, we also provide power and sample-size calculations using SKAT, SKAT-O, and their small-sample adjustments to help investigators design sequencing-association studies.
In whole-exome or whole-genome sequencing studies, one would expect that some genes or genomic regions have a high proportion of causal variants with the same association direction and that other regions have many noncausal variants or causal variants with different association directions. Applying only either a burden test or SKAT would decrease the chance of detecting all of those genes. However, the use of SKAT-O is more robust and will increase the chance of detecting these genes.
Although we have considered in this paper a wide range of simulation settings that are of practical interest, we note that simulation results depend on simulation settings. Thus, our results from comparing different methods should be interpreted within the context of the range of simulation settings we have considered. It would be useful to examine the generality of the results in other simulation settings in the future.
Due to high sequencing costs, many of the existing whole-exome sequencing studies have small sample sizes. As the second goal of this paper, we developed small-sample adjustment methods to correct p values for SKAT and SKAT-O to properly control the type I error rate and increase the power. Using extensive simulation studies and the NHLBI whole exomes from individuals who developed ALI, we demonstrated good performance of the proposed small-sample adjustment methods, both in terms of type I error control and power increase.
In this study, we only considered dichotomous traits. However, the application of SKAT-O to quantitative-trait data is straightforward using Equation 1 with a linear regression. Furthermore, we note that the small-sample adjustment is not necessary for continuous traits when the normality assumption is true, because the small-sample distributions of SKAT and SKAT-O are the same as their asymptotic distributions under normality.
We note that the proposed small-sample adjustment methods are still computationally efficient even though we estimate the kurtosis using resampling. It only requires 10,000 bootstrap samples to accurately estimate the kurtosis, which is a substantially smaller computational burden compared to obtaining permutation or bootstrap p values, which require 107 or 108 resampled phenotypes to accurately obtain p values in the 10−5–10−6 ranges.
In simulation and real-data analysis, we used a flexible beta weight to upweight the influence of rarer variants. Similar results are obtained with the use of logistic weight for the ALI exome-sequencing data (see Figures S3 and S4). In addition to the use of a function of the MAF of variants as weights, functional information can also be used for choosing variants to be tested or for constructing the weight. For example, only functional variants such as nonsense and missense variants can be used to test association, or functional information scores such as PolyPhen or SIFT scores24,25 can be used to construct a weight (an area under active study).
Recently, several adaptive methods have been proposed to increase the power. For example, the VT test11 tries to find the optimal MAF threshold of rare variants by varying the threshold, and EREC20 estimates a regression coefficient of each variant and uses them as the weight. Those approaches could improve the power compared to the burden tests. However, the VT test makes similar assumptions to those of the burden tests; i.e, it requires a majority of rare variants under the optimal threshold to be causal and have effects in the same direction. The EREC method requires estimation of regression coefficients, which are difficult to estimate stably for rare variants. Addition of a stabilizing constant in EREC can reduce the power relative to asymptotic calculations and make the test behave more like burden tests. Furthermore, these methods are computationally intensive when applied to large-scale sequencing studies, e.g., whole-exome and whole-genome sequencing studies, because they rely on a large number of permutation or bootstrap samples to compute p values and are difficult to control for covariates, such as population stratification. In contrast, SKAT-O and its small-sample adjustment compute p values efficiently and can be easily applied to whole-exome and whole-genome sequencing studies.
With the rapid advance of biotechonology, new biological knowledge will become available, and new sequencing technology and study designs will be developed. In the fast-moving next-generation-sequencing era, it is of significant importance to incorporate this new information to improve statistical and computational tools for detecting rare variants associated with complex diseases.
Acknowledgments
This work was supported by grants R37 CA076404 and PO1 CA134294 (S.L. and X.L.), RC2 HL101779 (D.C.C., S.L., X.L., and M.M.W.), R01HL060710 (D.C.C.), and UC2HL102923 (M.J.B., K.C.B., M.J.E., and M.M.W.). K.C.B. was supported in part by the Mary Beryl Patch Turnbull Scholar Program. The authors wish to acknowledge the support of the NHLBI and the contributions of the research institutions, study investigators, field staff, and study participants in creating this resource for biomedical research. Funding for GO ESP was provided by NHLBI grants RC2 HL-103010 (Heart GO), RC2 HL-102923 (Lung GO), and RC2 HL-102924 (Women’s Health Initiative Sequencing Project [WHISP]). The exome sequencing was performed through NHLBI grants RC2 HL-102925 (Broad GO) and RC2 HL-102926 (Seattle GO).
Appendix A. Mean and Variance of under the Null Hypothesis
Suppose , where . Then for all , and
| (Equation A.1) |
where is the element of , and is the element of . Therefore,
Now we calculate the first two moments of Q, given π, U, and Λ :
| (Equation A.2) |
Because , the elements in the second term in Equation A.2 can contribute to the overall sum only when (1) , (2) and , (3) , and (4) or and . Therefore
| (Equation A.3) |
We can calculate the second moment of by combining Equations A.2 and A.3.
Appendix B. Null Distribution of Small-Sample SKAT-O
Define and , where . Additionally, we let and
where is the column of Z. Following the same argument in Lee et al.,21 it can be shown that is equivalent as
| (Equation A.4) |
where
and
It can be shown that asymptotically follows the distribution, and is asymptotically the same as
where are nonzero eigenvalues of , are independent and identically distributed random variables, and ζ satisfies the following conditions:
We note that asymptotic p values can be obtained through the one-dimensional integration. When the sample size is small, however, the asymptotic moments of and can be larger than small-sample moments. Thus, we apply the same small-sample adjustment procedure to null distributions of and . We first compute the small-sample variance and kurtosis of and and apply the moment-matching approximation to obtain their adjusted asymptotic distribution. To obtain a p value, we apply the algorithm in Lee et al.21 with the adjusted null distribution and .
Supplemental Data
Web Resources
The URLs for data presented herein are as follows:
Implementation of SKAT and SKAT-O and their Small-Sample Adjustments and Power/Sample-Size Calculations in the R Language, http://www.hsph.harvard.edu/∼xlin/software.html
NHLBI Exome Project, http://www.nhlbi.nih.gov/resources/exome.htm
References
- 1.Shendure J., Ji H. Next-generation DNA sequencing. Nat. Biotechnol. 2008;26:1135–1145. doi: 10.1038/nbt1486. [DOI] [PubMed] [Google Scholar]
- 2.Mardis E.R. Next-generation DNA sequencing methods. Annu. Rev. Genomics Hum. Genet. 2008;9:387–402. doi: 10.1146/annurev.genom.9.081307.164359. [DOI] [PubMed] [Google Scholar]
- 3.Bodmer W., Bonilla C. Common and rare variants in multifactorial susceptibility to common diseases. Nat. Genet. 2008;40:695–701. doi: 10.1038/ng.f.136. [DOI] [PMC free article] [PubMed] [Google Scholar]
- 4.Schork N.J., Murray S.S., Frazer K.A., Topol E.J. Common vs. rare allele hypotheses for complex diseases. Curr. Opin. Genet. Dev. 2009;19:212–219. doi: 10.1016/j.gde.2009.04.010. [DOI] [PMC free article] [PubMed] [Google Scholar]
- 5.Cohen J.C., Kiss R.S., Pertsemlidis A., Marcel Y.L., McPherson R., Hobbs H.H. Multiple rare alleles contribute to low plasma levels of HDL cholesterol. Science. 2004;305:869–872. doi: 10.1126/science.1099870. [DOI] [PubMed] [Google Scholar]
- 6.Ahituv N., Kavaslar N., Schackwitz W., Ustaszewska A., Martin J., Hébert S., Doelle H., Ersoy B., Kryukov G., Schmidt S. Medical sequencing at the extremes of human body mass. Am. J. Hum. Genet. 2007;80:779–791. doi: 10.1086/513471. [DOI] [PMC free article] [PubMed] [Google Scholar]
- 7.Nejentsev S., Walker N., Riches D., Egholm M., Todd J.A. Rare variants of IFIH1, a gene implicated in antiviral responses, protect against type 1 diabetes. Science. 2009;324:387–389. doi: 10.1126/science.1167728. [DOI] [PMC free article] [PubMed] [Google Scholar]
- 8.Morgenthaler S., Thilly W.G. A strategy to discover genes that carry multi-allelic or mono-allelic risk for common diseases: a cohort allelic sums test (CAST) Mutat. Res. 2007;615:28–56. doi: 10.1016/j.mrfmmm.2006.09.003. [DOI] [PubMed] [Google Scholar]
- 9.Li B., Leal S.M. Methods for detecting associations with rare variants for common diseases: application to analysis of sequence data. Am. J. Hum. Genet. 2008;83:311–321. doi: 10.1016/j.ajhg.2008.06.024. [DOI] [PMC free article] [PubMed] [Google Scholar]
- 10.Madsen B.E., Browning S.R. A groupwise association test for rare mutations using a weighted sum statistic. PLoS Genet. 2009;5:e1000384. doi: 10.1371/journal.pgen.1000384. [DOI] [PMC free article] [PubMed] [Google Scholar]
- 11.Price A.L., Kryukov G.V., de Bakker P.I.W., Purcell S.M., Staples J., Wei L.J., Sunyaev S.R. Pooled association tests for rare variants in exon-resequencing studies. Am. J. Hum. Genet. 2010;86:832–838. doi: 10.1016/j.ajhg.2010.04.005. [DOI] [PMC free article] [PubMed] [Google Scholar]
- 12.Morris A.P., Zeggini E. An evaluation of statistical approaches to rare variant analysis in genetic association studies. Genet. Epidemiol. 2010;34:188–193. doi: 10.1002/gepi.20450. [DOI] [PMC free article] [PubMed] [Google Scholar]
- 13.Han F., Pan W. A data-adaptive sum test for disease association with multiple common or rare variants. Hum. Hered. 2010;70:42–54. doi: 10.1159/000288704. [DOI] [PMC free article] [PubMed] [Google Scholar]
- 14.Zawistowski M., Gopalakrishnan S., Ding J., Li Y., Grimm S., Zöllner S. Extending rare-variant testing strategies: analysis of noncoding sequence and imputed genotypes. Am. J. Hum. Genet. 2010;87:604–617. doi: 10.1016/j.ajhg.2010.10.012. [DOI] [PMC free article] [PubMed] [Google Scholar]
- 15.Neale B.M., Rivas M.A., Voight B.F., Altshuler D., Devlin B., Orho-Melander M., Kathiresan S., Purcell S.M., Roeder K., Daly M.J. Testing for an unusual distribution of rare variants. PLoS Genet. 2011;7:e1001322. doi: 10.1371/journal.pgen.1001322. [DOI] [PMC free article] [PubMed] [Google Scholar]
- 16.Basu S., Pan W. Comparison of statistical tests for disease association with rare variants. Genet. Epidemiol. 2011;35:606–619. doi: 10.1002/gepi.20609. [DOI] [PMC free article] [PubMed] [Google Scholar]
- 17.Wu M.C., Lee S., Cai T., Li Y., Boehnke M., Lin X. Rare-variant association testing for sequencing data with the sequence kernel association test. Am. J. Hum. Genet. 2011;89:82–93. doi: 10.1016/j.ajhg.2011.05.029. [DOI] [PMC free article] [PubMed] [Google Scholar]
- 18.Pan W. Asymptotic tests of association with multiple SNPs in linkage disequilibrium. Genet. Epidemiol. 2009;33:497–507. doi: 10.1002/gepi.20402. [DOI] [PMC free article] [PubMed] [Google Scholar]
- 19.Tzeng J.Y., Zhang D. Haplotype-based association analysis via variance-components score test. Am. J. Hum. Genet. 2007;81:927–938. doi: 10.1086/521558. [DOI] [PMC free article] [PubMed] [Google Scholar]
- 20.Lin D.Y., Tang Z.Z. A general framework for detecting disease associations with rare variants in sequencing studies. Am. J. Hum. Genet. 2011;89:354–367. doi: 10.1016/j.ajhg.2011.07.015. [DOI] [PMC free article] [PubMed] [Google Scholar]
- 21.Lee S., Wu M.C., Lin X. Optimal tests for rare variant effects in sequencing association studies. Biostatistics. 2012 doi: 10.1093/biostatistics/kxs014. Published online June 14, 2012. [DOI] [PMC free article] [PubMed] [Google Scholar]
- 22.Emond M.J., Louie T., Emerson J., Zhao W., Mathias R.A., Knowles M.R., Wright F.A., Rieder M.J., Tabor H.K., Nickerson D.A., National Heart, Lung, and Blood Institute (NHLBI) GO Exome Sequencing Project. Lung GO Exome sequencing of extreme phenotypes identifies DCTN4 as a modifier of chronic Pseudomonas aeruginosa infection in cystic fibrosis. Nat. Genet. 2012 doi: 10.1038/ng.2344. Published online July 8, 2012. [DOI] [PMC free article] [PubMed] [Google Scholar]
- 23.Lin X. Variance component testing in generalised linear models with random effects. Biometrika. 1997;84:309–326. [Google Scholar]
- 24.Ng P.C., Henikoff S. SIFT: Predicting amino acid changes that affect protein function. Nucleic Acids Res. 2003;31:3812–3814. doi: 10.1093/nar/gkg509. [DOI] [PMC free article] [PubMed] [Google Scholar]
- 25.Adzhubei I.A., Schmidt S., Peshkin L., Ramensky V.E., Gerasimova A., Bork P., Kondrashov A.S., Sunyaev S.R. A method and server for predicting damaging missense mutations. Nat. Methods. 2010;7:248–249. doi: 10.1038/nmeth0410-248. [DOI] [PMC free article] [PubMed] [Google Scholar]
- 26.Duchesne P., Lafaye De Micheaux P. Computing the distribution of quadratic forms: Further comparisons between the Liu-Tang-Zhang approximation and exact methods. Comput. Stat. Data Anal. 2010;54:858–862. [Google Scholar]
- 27.Davies R.B. Algorithm AS 155: The distribution of a linear combination of χ 2 random variables. Appl. Stat. 1980;29:323–333. [Google Scholar]
- 28.Liu H., Tang Y., Zhang H.H. A new chi-square approximation to the distribution of non-negative definite quadratic forms in non-central normal variables. Comput. Stat. Data Anal. 2009;53:853–856. [Google Scholar]
- 29.Wessel J., Schork N.J. Generalized genomic distance-based regression methodology for multilocus association analysis. Am. J. Hum. Genet. 2006;79:792–806. doi: 10.1086/508346. [DOI] [PMC free article] [PubMed] [Google Scholar]
- 30.Davison A.C., Hinkley D.V. Cambridge University Press; Cambridge: 1999. Bootstrap methods and their application. [Google Scholar]
- 31.Schaffner S.F., Foo C., Gabriel S., Reich D., Daly M.J., Altshuler D. Calibrating a coalescent simulation of human genome sequence variation. Genome Res. 2005;15:1576–1583. doi: 10.1101/gr.3709305. [DOI] [PMC free article] [PubMed] [Google Scholar]
- 32.Artigas A., Bernard G.R., Carlet J., Dreyfuss D., Gattinoni L., Hudson L., Lamy M., Marini J.J., Matthay M.A., Pinsky M.R. The American-European Consensus Conference on ARDS, part 2: Ventilatory, pharmacologic, supportive therapy, study design strategies, and issues related to recovery and remodeling. Acute respiratory distress syndrome. Am. J. Respir. Crit. Care Med. 1998;157:1332–1347. doi: 10.1164/ajrccm.157.4.ats2-98. [DOI] [PubMed] [Google Scholar]
- 33.Schoenfeld D.A., Bernard G.R., ARDS Network Statistical evaluation of ventilator-free days as an efficacy measure in clinical trials of treatments for acute respiratory distress syndrome. Crit. Care Med. 2002;30:1772–1777. doi: 10.1097/00003246-200208000-00016. [DOI] [PubMed] [Google Scholar]
- 34.McKenna A., Hanna M., Banks E., Sivachenko A., Cibulskis K., Kernytsky A., Garimella K., Altshuler D., Gabriel S., Daly M., DePristo M.A. The Genome Analysis Toolkit: a MapReduce framework for analyzing next-generation DNA sequencing data. Genome Res. 2010;20:1297–1303. doi: 10.1101/gr.107524.110. [DOI] [PMC free article] [PubMed] [Google Scholar]
- 35.Patterson N., Price A.L., Reich D. Population structure and eigenanalysis. PLoS Genet. 2006;2:e190. doi: 10.1371/journal.pgen.0020190. [DOI] [PMC free article] [PubMed] [Google Scholar]
- 36.Gao L., Grant A., Halder I., Brower R., Sevransky J., Maloney J.P., Moss M., Shanholtz C., Yates C.R., Meduri G.U. Novel polymorphisms in the myosin light chain kinase gene confer risk for acute lung injury. Am. J. Respir. Cell Mol. Biol. 2006;34:487–495. doi: 10.1165/rcmb.2005-0404OC. [DOI] [PMC free article] [PubMed] [Google Scholar]
- 37.Christie J.D., Ma S.F., Aplenc R., Li M., Lanken P.N., Shah C.V., Fuchs B., Albelda S.M., Flores C., Garcia J.G. Variation in the myosin light chain kinase gene is associated with development of acute lung injury after major trauma. Crit. Care Med. 2008;36:2794–2800. doi: 10.1097/ccm.0b013e318186b843. [DOI] [PubMed] [Google Scholar]
Associated Data
This section collects any data citations, data availability statements, or supplementary materials included in this article.