

Abstract
Women with anorexia nervosa (AN) have elevated marrow fat mass despite low visceral and subcutaneous fat depots, which is inversely associated with bone mineral density (BMD). Whether marrow fat mass remains persistently elevated or decreases with recovery from AN is currently unknown. In this study, we investigated changes in marrow fat with recovery from AN and the relationship between preadipocyte factor (Pref)-1 -- a member of the EGF-like family of proteins and regulator of adipocyte and osteoblast differentiation -- and fat depots and BMD in women who have recovered from AN (AN-R) compared to women with AN and healthy controls (HC). We studied 29 women: 14 with active or recovered AN (30.7 + 2.2 years (mean ± SEM)) and 15 normal-weight controls (27.8 ± 1.2 years). We measured marrow adipose tissue (MAT) of the L4 vertebra and femur by 1H-magnetic resonance spectroscopy, BMD of the spine, hip and total body by DXA and serum Pref-1 and leptin levels. We found that MAT of the L4 vertebra was significantly lower in AN-R as compared to AN (p = 0.03) and was comparable to levels in HC. Pref-1 levels were also significantly lower in AN-R as compared to AN (p = 0.02) and comparable to levels in healthy controls. Although Pref-1 was positively associated with MAT of the L4 vertebra in AN (R = 0.94; p = 0.002), we found that it was inversely associated with MAT of the L4 vertebra in HC (R = −0.71; p = 0.004). Therefore, we have demonstrated that MAT and Pref-1 levels decrease with recovery from AN. Our data suggest that Pref-1 may have differential effects in states of nutritional deprivation as compared to nutritional sufficiency.
Keywords: Marrow Adiposity, Anorexia Nervosa, Pref-1, Bone mineral density, Adipose depots
Introduction
Anorexia nervosa (AN) is a primary psychiatric disorder, characterized by extreme self-imposed starvation affecting 0.5–1% of college aged women in the U.S. (1, 2). Among the many significant medical complications and co-morbidities associated with the disease, bone loss is the most common. Occurring at both trabecular and cortical sites, an estimated 50% of women with AN have bone mineral density values more than one standard deviation below the mean of a population of young, healthy women and an additional 35% have bone density values more than two-and-a-half standard deviations below the mean (3).
Low bone mass in individuals with AN occurs in the setting of low subcutaneous and visceral fat depots (4). However, despite low peripheral and visceral fat stores, we have shown that bone marrow adipose tissue (MAT) is increased in AN and inversely associated with bone mineral density (BMD) (5). Previous studies have demonstrated the clinical significance of elevated levels of MAT and its relationship to bone density and bone strength. Adipose tissue volume is increased in aging patients with osteoporosis (6) and has been shown to be inversely associated with BMD in healthy Caucasian women (7) as well as obese women (8). Schellinger et al also showed that individuals with evidence of vertebral bone weakness, as assessed by magnetic resonance findings of Schmorl’s nodes, endplate depression, vertebral wedging and vertebral compression fractures, had increased amounts of vertebral MAT compared to those without such evidence (9). Profound suppression of bone formation is an established mechanism of bone loss in adolescents and adult women with AN (10–12). As osteblasts and adipocytes originate from a common progenitor, the human mesenchymal stem cell (hMSC), understanding the factors that potentially regulate the differentiation process of hMSCs into bone and fat may be of great importance in understanding clinical states of low bone mass and how nutritional deprivation affects bone metabolism.
Currently, little is known about the hormonal determinants of MAT. Preadipocyte factor (Pref)-1, a member of the epidermal growth factor-like family of proteins, is expressed in progenitor cell types including hMSCs and preadipocytes and is known to suppress adipocyte and osteoblast differentiation. How Pref-1 acts to suppress adipocyte and osteoblast differentiation remains unknown. We have previously shown that Pref-1 levels are elevated in AN and positively associated with MAT and inversely associated with BMD (13). In order to elucidate further the regulation of MAT in humans, we studied women with active AN, women who have recovered from AN (AN-R) and healthy controls. We hypothesized that AN-R would have decreased levels of MAT as compared to women with active AN and that in a nutritionally replete state, Pref-1 levels would be comparable to normal controls.
Materials and Methods
Subjects
29 women were studied: 14 women with active or recovered AN (30.7 ± 2.2 years (mean ± SEM)) and 15 normal-weight controls of comparable age, (28.8 ± 1.2 years). Data from 10 of the healthy controls were previously published (5). Women with AN were recruited through referrals from local eating disorder providers and on-line advertisements, and AN-R subjects and normal-weight controls were recruited through on-line advertisements. Subjects with AN met DSM-IV weight and psychiatric criteria. None of the subjects received estrogen within 3 months of the study. AN-R subjects were > 85% ideal body weight and had regular menses for at least 3 months. All control subjects had a normal BMI, a history of regular menstrual cycles and were receiving no medications known to affect bone mass. Control subjects did not have a past or present history of an eating disorder. Subjects with abnormal thyroid function tests, chronic diseases known to affect bone mineral density (other than AN) or diabetes mellitus were excluded from participation.
All subjects were examined and blood was drawn for laboratory studies at a study visit at our Clinical Translational Science Center. Height was measured as the average of 3 readings on a single stadiometer, and subjects were weighed on an electronic scale while wearing a hospital gown. BMI was calculated using the formula [weight (kg)/height (meter)2] and percent ideal body weight (%IBW) was calculated based on 1983 Metropolitan Life Height and Weight Tables (14).
The study was approved by the Partners Institutional Review Board and complied with the Health Insurance Portability and Accountability Act guidelines. Written informed consent was obtained from all subjects.
Biochemical Assessment
Pref-1 was measured with the Quantikine Human Pref-1 immunoassay (ELISA) (R&D Systems, Minneapolis, MN) with a mean minimum detectable level of 0.012 ng/mL and intra-assay coefficient of variation (CV) of 3.1–4.3%. Leptin was measured using an ELISA (Millipore, Billerica, MA) with a minimum detectable level of 0.5 ng/mL and intra-assay CV of 2.6–4.6% and an inter-assay CV of 2.6–6.2%.
Radiologic Imaging
All subjects underwent 1H-magnetic resonance spectroscopy (1H-MRS) of bone marrow of the L4 vertebral body, the proximal femoral epiphysis, metaphysis and mid-diaphysis to determine lipid content using a 3.0T MR imaging system (Siemens Trio, Siemens Medical Systems, Erlangen, Germany). For lumbar 1H-MRS a voxel measuring 15 × 15 × 15 mm (3.4 mL) was placed within the L4 vertebral body. Single-voxel 1H-MRS data was acquired using point-resolved spatially localized spectroscopy (PRESS) pulse sequence without water suppression with the following parameters: TE of 30 ms, TR of 3,000 ms, 8 acquisitions, 1024 data points, and receiver bandwidth of 2000 Hz. For femoral 1H-MRS a voxel measuring 12 × 12 × 12 mm (1.7 mL) was positioned within the proximal femoral epiphysis and single voxel 1H-MRS using the same non-water suppressed PRESS pulse sequence was performed. This process was repeated with voxel placement in the metaphysis at the inter-trochanteric region, and the mid-diaphysis. Automated procedures for optimization of gradient shimming and transmit and receive gain were used. The coefficient of variation (cv) for marrow fat quantification is 3%. This was determined by scanning 5 subjects twice.
Fitting of the 1H-MRS data was performed using LCModel software (version 6.1-4A) (Stephen Provencher, Oakville, ON, Canada). Data were transferred from the scanner to a Linux workstation and metabolite quantification was performed using eddy current correction and water scaling. A customized fitting algorithm for bone marrow analysis provided estimates for all lipid signals combined (0.9, 1.3, and 2.3 ppm). LCModel bone marrow lipid estimates were automatically scaled to unsuppressed water peak (4.7 ppm) and expressed as lipid to water ratio (LWR) (Figure 1).
Figure 1.
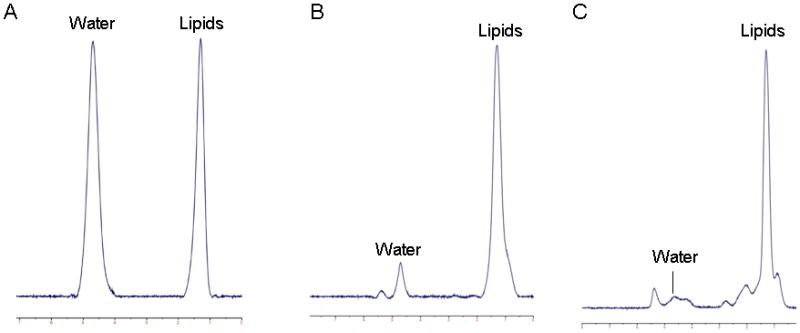
1H-magnetic resonance spectra of bone marrow in a subject with anorexia nervosa. Panel A: L4 vertebral body, 0.99 lipid to water ratio (LWR); Panel B: proximal femoral metaphysis, 5.7 LWR; Panel C: mid femoral diaphysis, 10.4 LWR.
A single axial MR imaging slice through the abdomen at the level of L4 and a single slice through the mid-thigh were obtained (Siemens Trio, 3T, Siemens Medical Systems, Erlangen, Germany) to determine abdominal subcutaneous adipose tissue (SAT), visceral adipose tissue (VAT) and total adipose tissue as well as SAT of the thigh. In addition, total cross-sectional area, cortical and marrow areas of the femur at the level of the mid-diaphysis were determined.
All subjects underwent dual energy x-ray absorptiometry (DXA) to measure BMD of the PA lumbar spine (L1–L4), lateral spine (L2–L4), total hip, total body and body composition including fat mass (kg), lean mass (kg), and % body fat using a Hologic Discovery A densitometer (Hologic Inc., Waltham, MA). Coefficients of variation of DXA have been reported as <1% for bone (15), 1.1% for lean body mass and 2.7% for fat mass (16).
Statistical Analysis
Statistical analysis was performed using JMP 8.0 (SAS Institute, Carry, NC) software. Means and standard error of the mean (SEM) measurements are reported. The means were compared using the Student’s t-test with Tukey-Kramer adjustment for multiple comparisons. A p-value of < 0.05 was used to indicate significance. Non-normal distributions were compared using the Wilcoxon test and adjusting for multiple comparisons using the Bonferroni correction, in which case a p-value of < 0.017 was used to indicate significance. Correlations are for the group as a whole unless otherwise noted.
Results
Clinical characteristics
Clinical characteristics of the study subjects are listed in Table 1. The AN, AN-R and HC groups were of similar age (p=0.2). BMI, % IBW and BMD of the hip, spine and total body were lower in AN as compared to both AN-R and HC. Percent body fat and total fat mass as measured by DXA were significantly lower in AN as compared to HC. SAT, total adipose tissue, and SAT of the thigh were also significantly lower in AN as compared to HC. There were no significant differences between AN and AN-R with respect to percent body fat, total fat mass, SAT, VAT, total adipose tissue, thigh SAT, total cross-sectional area, cortical area or marrow area of the diaphysis or leptin levels.
Table 1.
Clinical characteristics of study subjects
| AN (n=7) | AN-R (n=7) | HC (n=15) | |
|---|---|---|---|
| Age (years) | 33.1 ± 2.8 | 27.6 ± 2.2 | 27.8 ± 1.2 |
| BMI (kg/m2) | 18.2 ± 0.6*⊥ | 20.8 ± 0.6 | 21.9 ± 0.4 |
| % IBW | 80.6 ± 2.2*⊥ | 94 ± 3.2 | 99.6 ± 1.3 |
| Months of amenorrhea | 80.9 ± 24.8 | ------------ | ------------ |
| Months since recovery | ------------ | 44.1 ± 17.3 | ------------ |
| PA Spine BMD (g/cm2) | 0.83 ± 0.05^⊥ | 0.96 ± 0.02 | 1.02 ± 0.02 |
| Lat Spine BMD (g/cm2) | 0.62 ± 0.03*# | 0.79 ± 0.05 | 0.79 ± 0.02 |
| Total Hip BMD (g/cm2) | 0.74 ± 0.03*⊥ | 0.94 ± 0.03 | 0.95 ± 0.03 |
| Total Body BMD (g/cm2) | 0.97 ± 0.03*# | 1.08 ± 0.01 | 1.13 ± 0.03 |
| Fat Mass by DXA (g) | 10.7 ± 1.3# | 13.8 ± 1.3 | 17 ± 1.1 |
| Lean Mass by DXA (g) | 40.6 ± 1.5 | 40 ± 1.4 | 43.5 ± 1.2 |
| % Body Fat by DXA | 19.8 ± 1.9∞ | 24.6 ± 2.1 | 26.9 ± 1.3 |
| SAT of Abdomen (cm2) | 86.1 ± 14.7∞ | 98 ± 19.8 | 157.8 ± 17.3 |
| VAT of Abdomen (cm2) | 12.6 ± 1.4± | 14.2 ± 3.4 | 34.1 ± 6.4 |
| TAT of Abdomen (cm2) | 98.7 ± 15.7∞ | 112.1 ± 21.7 | 191.9 ± 21.8 |
| SAT of Thigh (cm2) | 50.6 ± 5.8∞ | 76.6 ± 8.5 | 83.6 ± 6.3 |
| Total cross-sectional area of mid-diaphysis of femur (cm2) | 5.43 ± 0.32 | 5.34 ± 0.21 | 5.35 ± 0.15 |
| Cortical area of mid-diaphysis of femur (cm2) | 3.53 ± 0.20 | 4.02 ± 0.10 | 3.88 ± 0.13 |
| Marrow area of mid-diaphysis of femur (cm2) | 1.90 ± 0.25 | 1.32 ± 0.19 | 1.47 ± 0.09 |
| Leptin (ng/mL) | 3.7 ± 1.4 | 5.6 ± 1.6 | 7.8 ± 1.5 |
AN: anorexia nervosa; AN-R: women recovered from anorexia nervosa; HC: healthy controls;
p ≤ 0.03 as compared to AN-R;
p < 0.04 as compared to AN-R;
p ≤ 0.0005 as compared to HC;
p ≤ 0.005 as compared to HC;
p < 0.02 as compared to HC;
p < 0.08 as compared to HC
Marrow Adipose Tissue
MAT of the L4 vertebra was significantly higher in AN (1.01 ± 0.22 LWR) as compared to AN-R (0.42 ± 0.05 LWR; p = 0.03) and HC (0.58 ± 0.07 LWR; p = 0.048) (Figure 2). MAT of the epiphysis, diaphysis and metaphysis was comparable in all groups (p = 0.99, p = 0.40 and p = 0.57, respectively).
Figure 2.
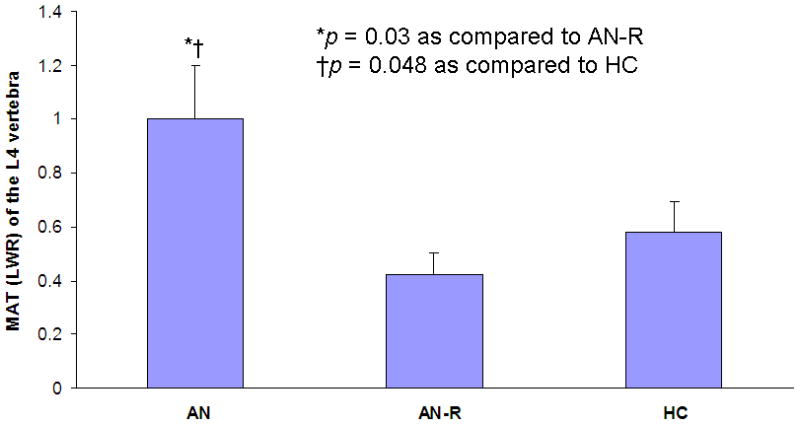
Marrow adipose tissue (MAT) of the L4 vertebra is significantly greater in anorexia nervosa (AN) as compared to women who have recovered from anorexia nervosa (AN-R) (p = 0.03) and as compared to healthy controls (HC) (p = 0.048).
MAT and Body Composition
MAT of the diaphysis was inversely associated with SAT (Spearman’s rho = −0.44; p < 0.04) (Figure 3a), total adipose tissue (Spearman’s rho = −0.44; p < 0.04) (Figure 3b) and thigh SAT (R = −0.46; p < 0.03). Thigh SAT was also inversely associated with MAT at L4 (Spearman’s rho = −0.41; p=0.047). MAT of the epiphysis was positively associated with percent body fat as measured by DXA (R = 0.50; p < 0.02) and total fat mass as measured by DXA (R = 0.42; p = 0.04).
Figure 3.
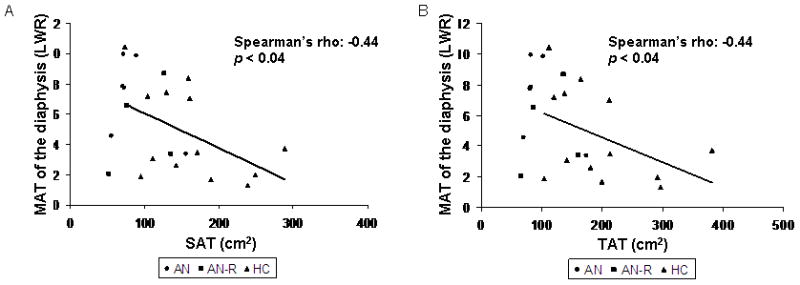
Marrow adipose tissue (MAT) of the diaphysis is inversely associated with subcutaneous adipose tissue (SAT) (Spearman’s rho = −0.44; p < 0.04) (Panel A) and total adipose tissue (TAT) (Spearman’s rho = −0.44; p < 0.04) (Panel B). AN: women with anorexia nervosa; AN-R: women who have recovered from anorexia nervosa; HC: healthy controls.
MAT and Bone Mineral Density
In HC, there was a positive association between MAT of the diaphysis and lateral spine BMD (Spearman’s rho = 0.59; p = 0.03) as well as MAT of the diaphysis and total body BMD (Spearman’s rho = 0.68; p = 0.007).
Cross-Sectional Area of the Femoral Diaphysis
There were no associations between MAT at the diaphysis and total cross-sectional area (p=0.56), cortical area (p=0.40) or marrow area (p=0.38) at the diaphysis in the group as a whole. There was a significant inverse association between cortical area and MAT of the metaphysis (R=−0.53; p<0.01) and between cortical area and MAT at L4 (Spearman’s rho: −0.49; p=0.01). In the individual groups, there were no significant associations between MAT at the diaphysis and any of the cross-sectional areas.
There were no significant associations between total cross-sectional area, cortical area or marrow area of the diaphysis and SAT, TAT or thigh SAT in the group as a whole. In AN-R, there was a significant inverse association between marrow area and thigh SAT (R=−0.97; p=0.03).
Pref-1
Pref-1 was significantly higher in AN as compared to AN-R (p < 0.02) and HC (p = 0.004) (Figure 4). Pref-1 levels in AN-R and HC were comparable (Figure 4).
Figure 4.
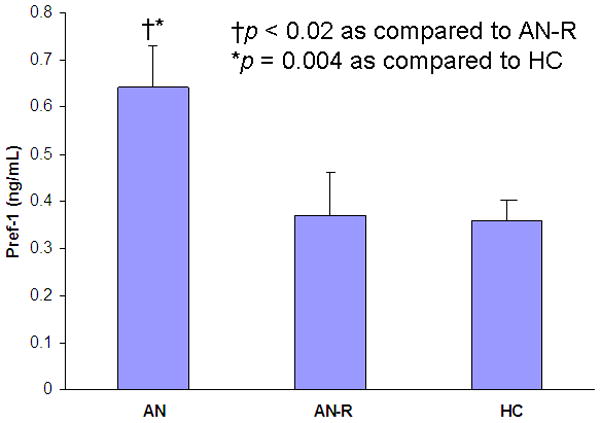
Preadipocyte factor (Pref)-1 levels are significantly greater in anorexia nervosa (AN) as compared to women who have recovered from anorexia nervosa (AN-R) (p < 0.02) and healthy controls (HC) (p = 0.004).
Pref-1 and MAT
Pref-1 was inversely associated with MAT of the metaphysis in the group as a whole (Spearman’s rho = −0.41; p = 0.047). Pref-1 was positively associated with MAT of the L4 vertebra in AN (R=0.94; p = 0.002) (Figure 5a). In HC, Pref-1 was inversely associated with MAT of the L4 vertebra (R = −0.71; p = 0.004) (Figure 5b).
Figure 5.
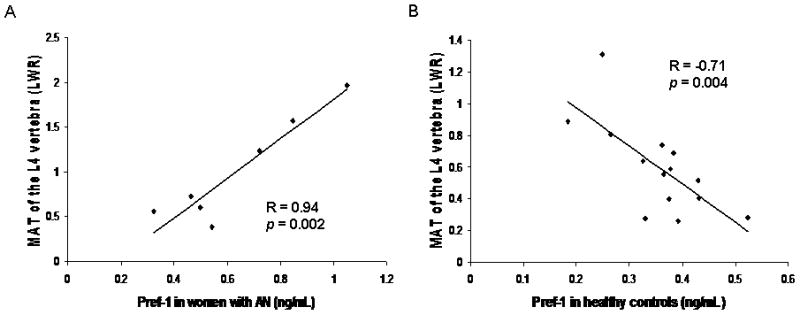
Marrow adipose tissue (MAT) of the L4 vertebra is positively associated with preadipocyte factor (Pref)-1 in women with anorexia nervosa (AN) (R = 0.94; p = 0.002) (Panel A) and inversely associated with Pref-1 in healthy controls (HC) (R = −0.71; p = 0.004) (Panel B).
Pref-1 and Body Composition
There was an inverse association between Pref-1 and percent body fat as measured by DXA (Spearman’s rho = −0.46; p = 0.01). There was also a trend towards an inverse association between Pref-1 and total body fat mass as measured by DXA (Spearman’s rho = −0.33; p = 0.08).
Pref-1 and BMD
Pref-1 was inversely associated with total body BMD (Spearman’s rho = −0.50; p = 0.006) (Figure 6). There was a trend towards an inverse association between Pref-1 and BMD of the hip (Spearman’s rho = −0.35; p < 0.07).
Figure 6.
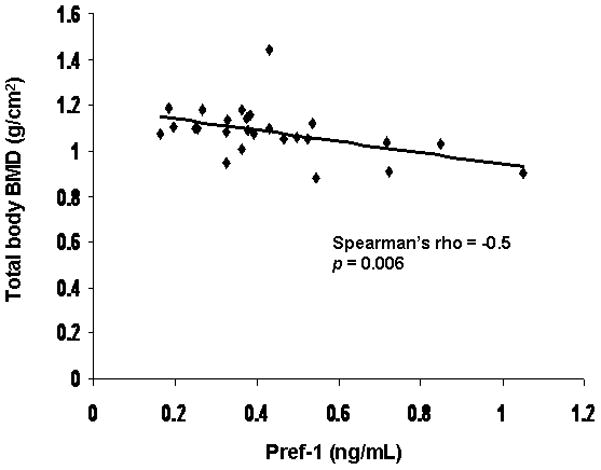
Total body BMD is inversely associated with preadipocyte factor (Pref)-1 (Spearman’s rho = -0.5; p = 0.006).
Pref-1 and Leptin
There was a positive association between leptin and total adipose tissue (Spearman’s rho = 0.63; p = 0.001), SAT (Spearman’s rho = 0.68; p = 0.0003) and thigh SAT (Spearman’s rho= 0.73; p < 0.0001). There was a positive association between leptin and femoral neck BMD (Spearman’s rho = 0.54; p = 0.02). There was an inverse association between Pref-1 and leptin (Spearman’s rho = −0.49; p < 0.01) (Figure 7).
Figure 7.
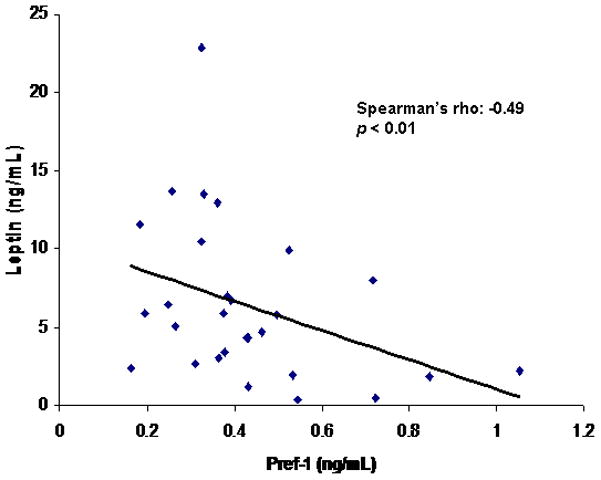
Pref-1 is inversely associated with leptin (Spearman’s rho = −0.49; p < 0.01).
Discussion
We have shown that in patients who have recovered from AN, MAT of the L4 vertebra and Pref-1 levels are similar to levels in healthy controls. In all patients, Pref-1 was inversely associated with total body BMD. These data support the hypothesis that elevated Pref-1 levels and MAT in women with active AN is due to their extreme low weight and further establishes a potential link between nutritional status and bone marrow adipocyte differentiation.
AN is a disease which affects approximately 0.5–1% of college-aged women in the US (1, 2). It is characterized by extremely low body weight, low bone mineral density and decreased amounts of peripheral fat. AN is characterized by significant bone loss, which is associated with a significantly increased fracture risk. A prospective study of 27 women with AN demonstrated a 7-fold increased risk of non-vertebral fracture during a mean two-year follow-up (17). Similarly, in a retrospective, population-based study, a 3-fold increased risk of fracture was found many years after the initial diagnosis of AN, with the long-term cumulative incidence of fracture being 57% (18). Therefore, gaining a better understanding of the mechanisms of bone loss in AN is especially important.
How fat depots change in response to weight gain in individuals with AN depends on the length of time since the weight gain. Adults with AN who have undergone acute weight-recovery have increased total trunk fat and VAT as compared to healthy controls of comparable weight (4), whereas subcutaneous fat in both groups is similar (4). With prolonged weight-recovery in AN, we have shown that the % trunk fat: % extremity fat ratio is elevated as compared to controls (19). Therefore, in adults, peripheral fat depots do not fully normalize even with prolonged weight recovery. How marrow fat depot changes with weight recovery in adults is unknown.
We have previously shown that women with active AN have increased levels of MAT which are inversely associated with bone mineral density and SAT (5). A potential mediator between bone mineral density and fat, Pref-1, has also been shown to be elevated in AN (5, 13). Pref-1 is a member of the EGF-like family of proteins and is a trans-membrane protein highly expressed in pre-adipocytes, osteoblastic cell lines and hMSCs (20). Pref-1 has been shown to be an important negative regular of adipocyte and osteoblast differentiation. Over-expression of osteoblast-specific Pref-1 in mouse models results in mice with low body weights and significantly reduced BMD (21). Pref-1 has also been shown to be a potentially important metabolic regulator. Over-expression of Pref-1 in a mouse model leads to lower adipose tissue mass, as compared to wild-type mice but to increased insulin resistance (22). In humans, Pref-1 has recently been shown to be associated with the metabolic profile of obese individuals (23). A cross-sectional study of metabolically healthy obese subjects – defined by the absence of dyslipidemia, impaired fasting glucose and hypertension -- and metabolically unhealthy obese subjects demonstrated that those that were metabolically healthy had lower Pref-1 levels in subcutaneous and omental fat as compared to the metabolically unhealthy and these levels were correlated with inflammatory markers (23). Our data also demonstrate that in low-weight and normal weight women, Pref-1 levels are inversely associated with leptin -an important indicator of nutritional stores in low-weight individuals. Therefore, Pref-1 may be an important mediator between an individual’s energy balance and the ability to form bone.
Our data support the role of Pref-1 as a negative regulator of osteoblast differentiation as Pref-1 was inversely associated with BMD of the total body. In AN, Pref-1 was also positively associated with vertebral MAT of the L4 but in HC, Pref-1 was inversely associated with vertebral MAT. It is possible that Pref-1 functions differently in varying metabolic milieus and therefore may behave differently in states of nutritional sufficiency as compared to nutritional deficiency. Similarly it is likely that Pref-1 is only one of multiple factors that plays a role in adipocyte differentiation. Further, the role of circulating Pref-1 in humans is currently unknown. While it may seem counterintuitive that Pref-1, a negative regulator of adipocyte differentiation is positively associated with MAT in AN, it may be that with the differentiation of pre-adipocytes into adipocytes, Pref-1 is cleaved and released into the circulation resulting in elevated circulating Pref-1 levels in individuals with elevated levels of MAT. The role of circulating Pref-1 on the varying adipose tissue depots is also currently not known and future studies will be necessary to delineate the effects of Pref-1 on marrow adipose tissue as compared to visceral adipose tissue and subcutaneous adipose tissue.
We have previously shown that MAT of the L4 vertebra and metaphysis was inversely associated with BMD at the spine, hip and total body in women with AN and healthy controls (5). In this study, we found a positive association between MAT of the diaphysis and BMD of the lateral spine and total body. These disparate data illustrate that it is likely that the relationship between osteoblast and adipocyte differentiation is complex and unlikely to be fully explained as an inverse relationship. For example, there are periods during development such as puberty during which both MAT and osteoblasts increase suggesting that this differentiation process does not always occur in an inverse manner. Post et al also demonstrated the presence of independent pre-osteoblastic and pre-adipocytic cell populations providing further evidence that the relationship between osteoblasts and adipocytes is not solely an inverse one (24).
We have also previously shown that women with AN have significantly more MAT in the femoral metaphysis and diaphysis as compared to HC (5). In this study, we found that women with AN had significantly more MAT in the L4 vertebra as compared to both AN-R and HC but similar levels of MAT in the femoral epiphysis, metaphysis and diaphysis. As the present study was powered to detect a difference in L4 marrow fat, it is possible that we did not have sufficient power to detect this difference in the femur. The fact that we were able to detect a difference in the lumbar spine but not in the femur in a small group of subjects suggests that marrow fat may accumulate preferentially in the lumbar spine, a site composed of predominantly trabecular bone, as compared to the femur, a site which contains a higher percentage of cortical bone as compared to the spine and may provide us with more insight into the role of marrow fat in bone mineral metabolism.
Because this is a cross-sectional study, we cannot determine causation based on our data. However, the fact that we saw such a significant decrease in MAT and Pref-1 levels in a small group of women who have recovered from AN suggests that MAT and Pref-1 may be strongly influenced by nutritional factors. MAT is normal in women who have recovered from AN, despite the fact that their SAT is still comparable to that of the AN group, suggesting that MAT may be more sensitive to nutritional changes as compared to the other fat depots. Further understanding of factors that influence osteoblast and adipocyte differentiation, including Pref-1, may therefore be of great clinical importance.
Acknowledgments
We would like to that the nurses and bionutritionists of the MGH Clinical Research Center for their expert care. The project described was supported by grant number UL1 RR025758, Harvard Clinical and Translational Science Center, from the National Center for Research Resources, the KL2 Medical Research Investigator Training (MeRIT) program of Harvard Catalyst, Harvard Clinical and Translational Science Center UL1 RR025758 and NIH grant R24 DK084970. The content is solely the responsibility of the authors and does not necessarily represent the official views of the National Center for Research Resources or the National Institutes of Health.
Footnotes
Disclosures:
All authors state that they have no conflicts of interest.
Authors’ roles: Dr. Fazeli worked on the concept and design of the study; acquisition, analysis, and interpretation of data; the writing of the manuscript; and approved the final version of the submitted manuscript. Dr. Bredella worked on the concept and design of the study; acquisition and analysis of data; revised the submitted manuscript for intellectual content; and approved the final version of the submitted manuscript. Ms. Freedman, Dr. Thomas, Dr. Breggia and Ms. Meenaghan worked on data acquisition for this study, revised the submitted manuscript for intellectual content, and approved the final version of the submitted manuscript. Dr. Rosen worked on the concept and design of the study, revised the submitted manuscript for intellectual content, and approved the final version of the submitted manuscript. Dr. Klibanski worked on the concept and design of the study; acquisition, analysis, and interpretation of data; revised the submitted manuscript for intellectual content; and approved the final version of the submitted manuscript. Dr. Fazeli and Dr. Klibanski accept responsibility for the integrity of the data analysis.
References
- 1.Lucas AR, Beard CM, O’Fallon WM, Kurland LT. 50-year trends in the incidence of anorexia nervosa in Rochester, Minn.: a population-based study. Am J Psychiatry. 1991 Jul;148(7):917–22. doi: 10.1176/ajp.148.7.917. [DOI] [PubMed] [Google Scholar]
- 2.Pope HGJH, Yurgelun-Todd D, Hudson MS. Prevalence of Anorexia Nervosa and Bulimia in Three Student Populations. International Journal of Eating Disorders. 1984;3(3):45–51. [Google Scholar]
- 3.Miller KK, Grinspoon SK, Ciampa J, Hier J, Herzog D, Klibanski A. Medical findings in outpatients with anorexia nervosa. Arch Intern Med. 2005 Mar 14;165(5):561–6. doi: 10.1001/archinte.165.5.561. [DOI] [PubMed] [Google Scholar]
- 4.Mayer L, Walsh BT, Pierson RN, Jr, Heymsfield SB, Gallagher D, Wang J, Paides MK, Leibel RL, Warren MP, Killory E, Glasofer D. Body fat redistribution after weight gain in women with anorexia nervosa. Am J Clin Nutr. 2005 Jun;81(6):1286–91. doi: 10.1093/ajcn/81.6.1286. [DOI] [PubMed] [Google Scholar]
- 5.Bredella MA, Fazeli PK, Miller KK, Misra M, Torriani M, Thomas BJ, Ghomi RH, Rosen CJ, Klibanski A. Increased bone marrow fat in anorexia nervosa. J Clin Endocrinol Metab. 2009 Jun;94(6):2129–36. doi: 10.1210/jc.2008-2532. [DOI] [PMC free article] [PubMed] [Google Scholar]
- 6.Justesen J, Stenderup K, Ebbesen EN, Mosekilde L, Steiniche T, Kassem M. Adipocyte tissue volume in bone marrow is increased with aging and in patients with osteoporosis. Biogerontology. 2001;2(3):165–71. doi: 10.1023/a:1011513223894. [DOI] [PubMed] [Google Scholar]
- 7.Shen W, Chen J, Punyanitya M, Shapses S, Heshka S, Heymsfield SB. MRI-measured bone marrow adipose tissue is inversely related to DXA-measured bone mineral in Caucasian women. Osteoporos Int. 2007 May;18(5):641–7. doi: 10.1007/s00198-006-0285-9. [DOI] [PMC free article] [PubMed] [Google Scholar]
- 8.Bredella MA, Torriani M, Ghomi RH, Thomas BJ, Brick DJ, Gerweck AV, Rosen CJ, Klibanski A, Miller KK. Vertebral bone marrow fat is positively associated with visceral fat and inversely associated with IGF-1 in obese women. Obesity (Silver Spring) 2011 Jan;19(1):49–53. doi: 10.1038/oby.2010.106. [DOI] [PMC free article] [PubMed] [Google Scholar]
- 9.Schellinger D, Lin CS, Hatipoglu HG, Fertikh D. Potential value of vertebral proton MR spectroscopy in determining bone weakness. AJNR Am J Neuroradiol. 2001 Sep;22(8):1620–7. [PMC free article] [PubMed] [Google Scholar]
- 10.Grinspoon S, Baum H, Lee K, Anderson E, Herzog D, Klibanski A. Effects of short-term recombinant human insulin-like growth factor I administration on bone turnover in osteopenic women with anorexia nervosa. J Clin Endocrinol Metab. 1996 Nov;81(11):3864–70. doi: 10.1210/jcem.81.11.8923830. [DOI] [PubMed] [Google Scholar]
- 11.Stefanis N, Mackintosh C, Abraha HD, Treasure J, Moniz C. Dissociation of bone turnover in anorexia nervosa. Ann Clin Biochem. 1998 Nov;35( Pt 6):709–16. doi: 10.1177/000456329803500602. [DOI] [PubMed] [Google Scholar]
- 12.Soyka LA, Grinspoon S, Levitsky LL, Herzog DB, Klibanski A. The effects of anorexia nervosa on bone metabolism in female adolescents. J Clin Endocrinol Metab. 1999 Dec;84(12):4489–96. doi: 10.1210/jcem.84.12.6207. [DOI] [PubMed] [Google Scholar]
- 13.Fazeli PK, Bredella MA, Misra M, Meenaghan E, Rosen CJ, Clemmons DR, Breggia A, Miller KK, Klibanski A. Preadipocyte factor-1 is associated with marrow adiposity and bone mineral density in women with anorexia nervosa. J Clin Endocrinol Metab. 2010 Jan;95(1):407–13. doi: 10.1210/jc.2009-1152. [DOI] [PMC free article] [PubMed] [Google Scholar]
- 14.Company MLI. Height and weight tables. J Nutr Elderly. 1983;3:23–6. [Google Scholar]
- 15.Barthe N, Braillon P, Ducassou D, Basse-Cathalinat B. Comparison of two Hologic DXA systems (QDR 1000 and QDR 4500/A) Br J Radiol. 1997 Jul;70(835):728–39. doi: 10.1259/bjr.70.835.9245885. [DOI] [PubMed] [Google Scholar]
- 16.Johnson J, Dawson-Hughes B. Precision and stability of dual-energy X-ray absorptiometry measurements. Calcif Tissue Int. 1991 Sep;49(3):174–8. doi: 10.1007/BF02556113. [DOI] [PubMed] [Google Scholar]
- 17.Rigotti NA, Neer RM, Skates SJ, Herzog DB, Nussbaum SR. The clinical course of osteoporosis in anorexia nervosa. A longitudinal study of cortical bone mass. JAMA. 1991 Mar 6;265(9):1133–8. [PubMed] [Google Scholar]
- 18.Lucas AR, Melton LJ, 3rd, Crowson CS, O’Fallon WM. Long-term fracture risk among women with anorexia nervosa: a population-based cohort study. Mayo Clin Proc. 1999 Oct;74(10):972–7. doi: 10.4065/74.10.972. [DOI] [PubMed] [Google Scholar]
- 19.Grinspoon S, Thomas L, Miller K, Pitts S, Herzog D, Klibanski A. Changes in regional fat redistribution and the effects of estrogen during spontaneous weight gain in women with anorexia nervosa. Am J Clin Nutr. 2001 May;73(5):865–9. doi: 10.1093/ajcn/73.5.865. [DOI] [PubMed] [Google Scholar]
- 20.Abdallah BM, Jensen CH, Gutierrez G, Leslie RG, Jensen TG, Kassem M. Regulation of human skeletal stem cells differentiation by Dlk1/Pref-1. J Bone Miner Res. 2004 May;19(5):841–52. doi: 10.1359/JBMR.040118. [DOI] [PubMed] [Google Scholar]
- 21.Abdallah BM, Ditzel N, Traustadottir GA, Schilling AF, Amling M, Kassem M. Dlk1/FA1 Is a Novel Factor Enhancing Osteoclastogenesis and Inhibiting Bone Formation in vitro and in vivo. 30th ASBMR Annual Meeting; 2008. p. Abstract 1007. [Google Scholar]
- 22.Villena JA, Choi CS, Wang Y, Kim S, Hwang YJ, Kim YB, Cline G, Shulman GI, Sul HS. Resistance to high-fat diet-induced obesity but exacerbated insulin resistance in mice overexpressing preadipocyte factor-1 (Pref-1): a new model of partial lipodystrophy. Diabetes. 2008 Dec;57(12):3258–66. doi: 10.2337/db07-1739. [DOI] [PMC free article] [PubMed] [Google Scholar]
- 23.O’Connell J, Lynch L, Hogan A, Cawood TJ, O’Shea D. Preadipocyte Factor-1 Is Associated with Metabolic Profile in Severe Obesity. J Clin Endocrinol Metab. 2011 Apr;94(4):E680–4. doi: 10.1210/jc.2010-2026. [DOI] [PubMed] [Google Scholar]
- 24.Post S, Abdallah BM, Bentzon JF, Kassem M. Demonstration of the presence of independent pre-osteoblastic and pre-adipocytic cell populations in bone marrow-derived mesenchymal stem cells. Bone. 2008 Jul;43(1):32–9. doi: 10.1016/j.bone.2008.03.011. [DOI] [PubMed] [Google Scholar]