

Introduction
Though the broad outlines of retinal networks have been known for decades, no total subnetwork is known for any retinal neuron. New electron imaging technologies now have the potential to build complete networks: connectomes. This article addresses connectome completeness and advances in imaging, data management, data navigation and validation in connectomics.
The Motivation for Connectomics
Why can’t we infer networks from physiology or modeling? Graph theory [1, 2••] provides the answer. Retinal and brain networks are multi-edge digraphs (directed graphs): collections of vertices (cells or cell compartments) connected by directed (synaptic) edges. The number of possible graphs Nn constructed from n vertices is extremely large even with aggressive constraints (Fig. 1). Even the simplest 3-vertex labeled digraph admits N3 = 64 networks. The human retina has ≈ 70 classes of cells [3], and the human brain has no fewer than 250 regions ( ≈ 200 for cortex alone [4]) and likely >1000 classes of neurons. Topologic complexities such as diverse cell copy numbers and coverages [5], molecular connection types, and synaptic weights exponentially expand this universe of possible networks. Inference based on inverse solutions for such high complexity systems is untenable as provable mappings of physiologic transfer functions onto unique graph topologies do not exist [6]. Graph theory also clarifies the limits of modeling since discovering network motifs is one of the most intractable of computational problems: the subgraph isomorphism or clique decision [7]. The solution space is likely not computable and computational proof of a motif’s biological role is impossible. The same problems afflict analyses of genomic, proteomic and metabolic networks [8]. The solution lies in network ground truth [9•], not inference. Despite heroic efforts, anatomy has built only small fragments of real networks [10, 11•,12, 13•, 14–17]. The way forward is connectomics, now feasible because (1) electron microscope platforms have been repurposed for high throughput data acquisition and (2) large-scale storage / imaging is affordable.
Fig. 1. Network Enumeration.

Graph enumeration for networks. A three vertex (n=3) network (ABC) can form different numbers of motifs if the connections are undirected U(n), directed D(n) (solid arrows), or directed with re-entrant loops R(n) (dotted arrows). Networks can be limited to vertex clusters of size k [C(n,k)]. Directed (D) and combinatoric (C) networks in retina (n=70), brain regions (n=250) and brain neurons (n=1000) were calculated using the Wolfram Alpha engine (www.wolframalpha.com).
Connectomics
A connectome is the complete graph (the adjacency matrix) of a neural volume that describes all partners and non-partners. Connectomics includes macroscopic analyses such as the Human Connectome Project [18] and other large-scale initiatives [19, 20] as well as microscopic analyses of synaptic networks in delimited structures like the vertebrate retina [21••,22•]. Molecular markers, synapse numbers and synapse sizes can also be used to weight the adjacency matrix and preselect candidate cells for analysis. Though only physiology can correctly parameterize the matrix, the key is creating the matrix. The stages of any synaptic connectome project are sample treatment, sectioning, electron imaging, tagging, tiling, navigation, annotation, analysis and data sharing.
Sample treatment and molecular tags
Connectomics samples are chemically derivatized for electron imaging, and often augmented with molecular or functional segmentations inserted by physical or optical methods. Anderson et al. [9,21] used excitation mapping with organic actions to embed small molecule light response histories into a retinal sample. Briggmann et al. [22] and Bock et al. [23••] used registration of optical calcium imaging onto ultra-structural datasets to pre-identify functional neuron classes. Glutaraldehyde-based fixation followed by metallization steps are ideal for visualization of neural connectivity by transmission electron microscope (TEM) imaging, and other marker strategies based on genetically modified organisms [24–26] are possible. The new “miniSOG” method, an electron-imaging analogue of GFP labeling, is particularly promising [27••]. In contrast, ablation imaging (see below) permits only en bloc staining to generate tissue contrast and currently has limited marker options. Molecular markers are essential for connectomics. Only TEM has proven capable of incorporating them into routine connectome datasets via small molecules and some proteins immunoprobed optically on intercalated ultrathin sections, with clustering to classify cells [9, 28–30]. Another variant of this is array tomography, which uses re-probing methods to build molecular data volumes into which ultrastructural data can be inserted [31••,32–33].
Sectioning
Ultrastructural connectome datasets are formed by ablation or slicing. Ablation includes in vacuo serial block-face (SBF) sectioning [34,35] or ion beam surface milling [36], followed by SEM or scanning TEM (STEM) imaging of surface-backscattered electrons. SEM/STEM systems only image surfaces. Slicing is dominated by manual ultramicrotomy [9,37] onto electron-transparent film supports followed by conventional staining and automated TEM (ATEM) imaging [9]. Primary electron transmission imaging generates projection images of the section thickness, optimally at 50–70 nm. Manual ultramicrotomy is fast, inexpensive, and compatible with an extensive repertoire of stains and molecular markers. Automated sectioning onto electron-opaque supports can also be used, followed by STEM imaging [38], but these platforms are not widely available. Though ablation methods benefit from coarse pre-registration of image fields, SEM/STEM imaging imposes limits in resolution, speed, and molecular tagging. Slicing requires additional computational registration of image tiles, but that is a solved problem [39].
Electron Imaging, Tiling and Registration
Connectomics requires tens to hundreds of terabytes of data depending on resolution and volume subtended [9,21]. In retina, TEM volumes are collections of slices imaged at >1000 overlapping tiles (Fig. 2). Robust detection of gap junctions and synapses requires ≈ 2 nm resolution, and validation requires re-imaging at finer resolutions with goniometric tilt, which is only possible with TEM [9, 21,37]. Typical SEM platforms usually cannot acquire data at better than 10 nm, suited to coarse-grained connectomics only, and cannot prove completeness. A recent review of connectome methods by Kleinfield et al. [38], inexplicably ignored any work with resolutions better than 10 nm, though 2 nm resolution is essential for completeness [9] and synaptic weighting [37]. As they are based on commercial electron-imaging cameras and automated acquisition [40••], ATEM platforms can be implemented by many existing TEM facilities. A more advanced TEM design uses reconfigured columns, custom phosphor plates, and custom camera arrays [23], producing the fastest connectome imaging architecture. This approach requires a dedicated TEM and skilled staff. Different schemes have been used to generate navigable ultrastructural data-sets. Preserving the slice as a 2D page simplifies data navigation, distribution and sharing [41•]. Fully automated precision mosaicking and slice-to-slice registrations developed by Tasdizen et al. [39] exploits image Fourier shift to compute net displacement vectors. Resampled slice-to-slice alignments, refined by nonrigid grid alignment, are then used to automatically build 2 nm resolution volumes. These strategies and their derivatives are also applicable to large scale optical atlases [42].
Fig. 2. Connectome RC1 slice 001.
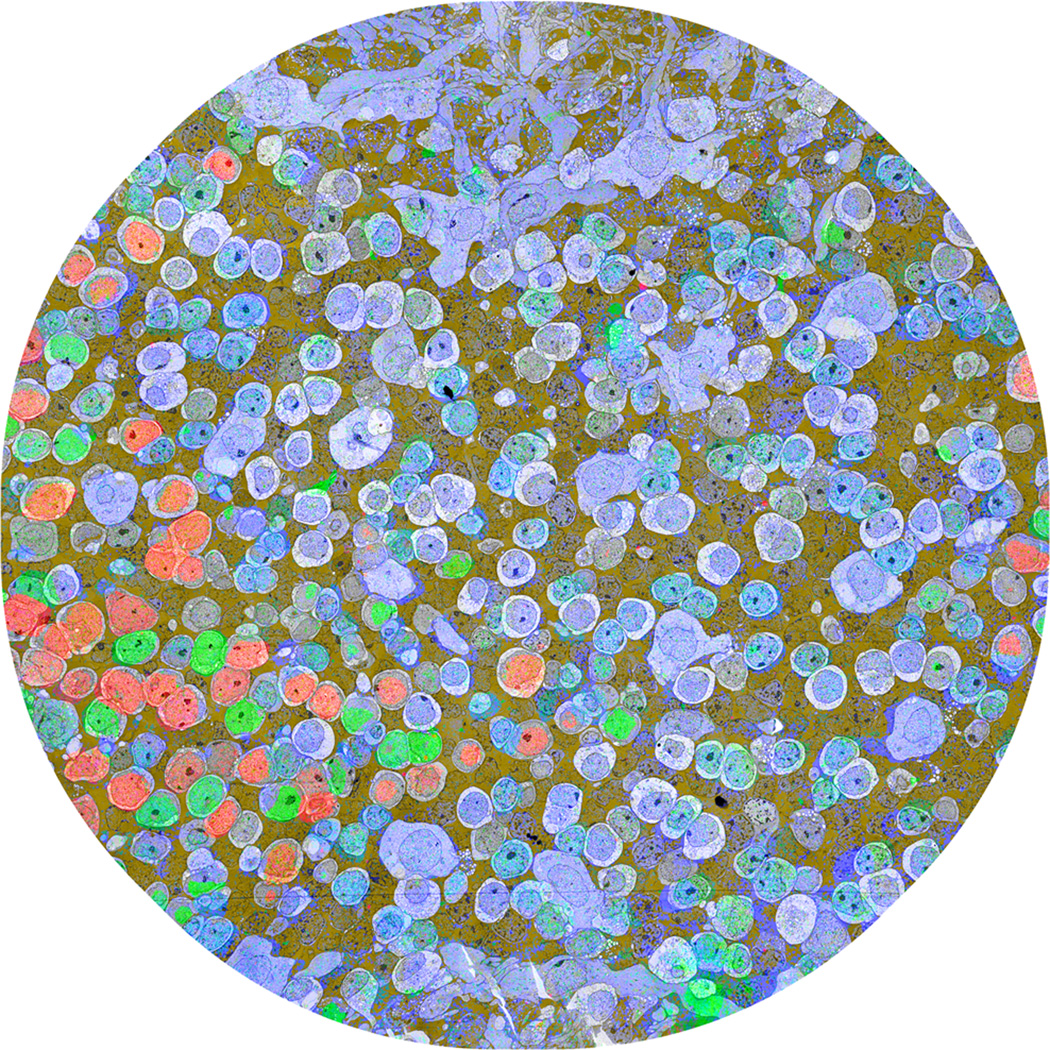
Connectome RC1 slice 001 composed of >1000 high-resolution TEM tiles. The slice is augmented with a multispectral transparency mapping simultaneously displaying GABA (red), glycine (green, glutamate (blue), and a logical AND of glutamine and taurine signals as a dark gold alpha channel. GABA+ (red) neurons are amacrine cells, while glycine+ (green) neurons are either amacrine or an ON cone bipolar cell subset. Glutamate+ (blue) neurons are largely bipolar cells. Image width, 243 µm. From Anderson et al., 2011, Molecular Vision 17:355–379 by permission of the authors.
Navigation, Annotation & Analysis
Terabyte-scale imagery cannot be explored with conventional imaging tools and new tools are required [41, 43,44]. Several groups have successfully used image pyramids as a data delivery architecture [41,45]. The open-source Viking environment [41] allows multiuser remote visualization by converting datasets to web-optimized tiles and delivering volume transforms to client devices via conventional internet connections. Generation of 3D cell renderings and mapping of synaptic networks requires integrated annotation and database architectures. In Viking, disc markers are used to approximate convex hulls and linked to build 3D representations (Fig. 3) with accurate size scaling for modeling. Relational structures (presynaptic complexes, postsynaptic densities, gap junctions, adherens junctions) are located, sized and linked to build adjacency matrices. Annotations also store metadata and permits bookmarked web-tours of networks. Analysis requires rendering, graphing, network touring, and informatics. The open-source Viz web services for Viking allow cell renderings at higher resolutions than optical methods, automated network graphs, navigation between ultrastructural data and network motifs, and automated statistical summaries. While significant efforts have been made to achieve automated tracing [43, 46–48], all connectomes must presently be validated by human annotation [41] and none are currently practical for connectomics of complex neuropil. Correcting annotation errors has proved rather straightforward. Completeness ultimately purges errors and metadata parsing can detect early errors. Errors such as skipping between processes in tracing are flagged as forbidden switches in molecular signatures, associated synapse type, targets or inputs. One of the best methods is parsing network graphs for violations.
Fig. 3. Stereo pair rendering.

A stereo pair of 3D volumetric constructions. AII amacrine cell 476 (dark red) is shown with all of the rod bipolar cells that drive it and an adjacent microglial cell (5016). Each of the bipolar cells is numbered with the total number of ribbon synapses it makes with cell 476 in parentheses. The cells were rendered using the Vikingplot application, calling the open-access RC1 database.
Sharing
Connectomics datasets must be shared [41, 43,49], but distributing raw datasets is impractical. The solution is open-access via web services. The Viking strategy involves open source tools and common file formats to accommodate other widely used applications, e.g. Blender (www.blender.org). Such open-access approaches minimize the overhead for journals as data gatekeepers, but poses problems of intellectual ownership. We have opted for full public sharing of our datasets and tools as proposed by Jeong et al. [43]. The next critical stage is integrating annotated datasets and summary networks with large informatics frameworks [50, 51].
Examples of Connectomics Discovery
Ultimately, hypotheses addressing retinal signal processing, network development, network evolution, and visual behavior will only yield to mapping at resolutions sufficient for completeness: 2nm or better. Validation involves several levels. First, do connectome datasets replicate previous reconstructions? An exceptional test case is the AII amacrine cell (AC), a critical interneuron in mammalian scotopic vision, previously reconstructed by several different groups [11, 13,52,53]. Fig. 3 shows a stereo pair of AII AC 476 from the RC1 rabbit retinal connectome and every rod bipolar cell (BC) associated with it. Connectomics extracts all previously reported features of this cell in over 30 instances, corrects prior errors and omissions, and extends the network [21] by characterizing previously undiscovered synaptic partners including wide-field ON cone BCs and unique sets of GABAergic ACs. A higher level of validation involves building navigable network graphs with synaptic weighting data such as postsynaptic density areas (http://connectomes.utah.edu/viz). Such graphs show that scotopic operations are, unexpectedly, a minor facet of the AII connectome. This suggests that AII cells are central elements in the evolution of photopic ON → OFF crossover networks later repurposed to serve rod vision. Fig. 4 displays a condensed 1-hop connectome for the AII AC, showing the minimum partner set. There may be subclasses within some GABAergic groups. Such analyses can be applied to every retinal cell class, including glia, microglia and vascular elements, enabling accurate volumetric adjacency analyses in the retina of every species. Connectomics at 2 nm resolution also provides insights to important associations [21] such as heterocellular and homocellular gap junctions [54•,55], fasciculation and glomerular associations via adherens junctions, new architectures for intercellular contacts, nanoscale synaptic assemblies, synaptic and gap junction turnover by endocytosis, synaptic ribbon transport, postsynaptic density assembly, as well as glial and microglial intercalations by fins as thin as 20 nm, and more. At a coarser resolution, connectomics analysis supports the preferential association of starburst AC dendrites with the corresponding directional bias of ON directionally selective ganglion cells [22]. Whether high resolution connectomics of complete networks will affirm this remains to be seen.
Fig. 4. Summary network.

The complete connectome for class AII glycinergic ACs in the mammalian retina. The connectome shows four modes of excitation (solid arrows), three modes of coupling (lines), five modes of GABA inhibitory input (open arrows), and four glycine inhibitory output modes (double arrows). CBa, OFF cone BCs; CBb, ON cone BCs; WF, wide field ON cone BCs; RB, rod BCs; TH1, class 1 dopaminergic axonal cells; α, alpha GCs; δ, delta GCs; pAC, peptidergic GABAergic AC; OFF AC1, dominant monostratified OFF cone AC population; OFF AC2, minor monostratified OFF cone AC population; ON AC, dominant monostratified ON cone AC population; ON SAC, ON starburst amacrine cell; AI-S2 subclass S2 class AI rod-dominated GABAergic AC. Some of the groups can be further weighted. For example, though ON cone BCs classes (there are at least five) are coupled to AII cells via gap junctions, they differ in their gap junction areas and one class (WF ON cone BCs) is also pre-synaptic via ribbon synapses.
Towards completeness
Completeness requires mapping all contacts and contact patterns across multiple instances of a cell class. The variance of some metric should be minimized when sampling approaches completeness, but we are still discovering those metrics. For example, the mean rod BC ribbon synapse count for four adjacent AII ACs in RC1 is 74 ± 5 (1 SD) with coefficient of variation (CV) 0.066. The same cells have a mean rod BC contact count of 11.5 ± 3.7 (CV = 0.32), suggesting that neurons normalize synapse number despite varying neurite overlap geometries. Completeness is also gauged by edge density in network graphs where submotifs can be extracted and quantitatively compared.
Conclusion
Completeness in connectomics involves three key issues. (1) Resolution at 2 nm or better to unambiguously mark synapses and gap junctions is absolutely critical for completely mapping any network [37, 54,55] and, at present, TEM is optimal for such investigations. (2) Molecular [21, 27] or optical [22, 23] tagging to pre-select cells of interest in complex neural populations is also essential as an independent test of identity and as a segmentation strategy. (3) Increasing the number of platforms available to investigators and sharing them is the only practical way forward for synaptic connectomics [9]. Building artisanal tools is an important strategy, but inexpensive, high resolution commercial systems must be developed, mirroring commercial fMRI systems that support macroscale connectomics. The next generation of tools should facilitate the emergence of comparative connectomics to explore the evolution and development of retinal networks and pathoconnectomics of retinal neurodegenerations [28, 29].
Highlights.
Complete retinal networks must be mapped by connectomics and cannot be inferred
Transmission electron microscope imaging provides optimal synaptic resolution
Many existing electron microscopes can be converted to connectomics imaging
Ultrastructurally compliant molecular tags are required for fast connectome assembly
Retinal neurons thought to be well-understood are proving to be unexpectedly complex
Acknowledgements
We thank the National Institutes of Health (EY02576, EY015128, and EY014800), the National Science Foundation (0941717), the Calvin and JeNeal Hatch Presidential Endowed Chair, and Research to Prevent Blindness for support. Funding for the JEOL JEM-1400 was generously provided by Martha Ann Healy.
Footnotes
Publisher's Disclaimer: This is a PDF file of an unedited manuscript that has been accepted for publication. As a service to our customers we are providing this early version of the manuscript. The manuscript will undergo copyediting, typesetting, and review of the resulting proof before it is published in its final citable form. Please note that during the production process errors may be discovered which could affect the content, and all legal disclaimers that apply to the journal pertain.
Disclosure Statement
Robert E. Marc is a principal of Signature Immunologics, Inc., manufacturer of antibodies against small molecules used in some of the work described.
Contributor Information
Robert E. Marc, Email: robert.marc@hsc.utah.edu.
Bryan W. Jones, Email: bryan.jones@m.cc.utah.edu.
J. Scott Lauritzen, Email: jscottlauritzen@gmail.com.
Carl B. Watt, Email: carl.watt@hsc.utah.edu.
James R. Anderson, Email: James.R.Anderson@utah.edu.
References and annotations
- 1.Diestel R. Graph Theory. edn 3rd. Heidelberg: Springer-Verlag; 2005. [Google Scholar]
- 2. Harary F, Palmer EM. Graphical Enumeration. New York: Academic Press; 1973. . •• This is a classic collection of analytic and numerical solutions for network graph attributes. Many are difficult to compute and have been tabulated in a critical mathematics resource: the On-Line Encyclopedia of Integer Sequences (OEIS, https://oeis.org/). In addition, the Wolfram Alpha Engine provides computation of numbers exceeding the capacities of conventional processors (www.wolframalpha.com)
- 3.Marc RE. Synaptic Organization of the Retina. In: Levin LA, Nilsson SFE, Ver Hoeve J, Wu SM, Kaufman PL, Alm A, editors. Adler's Physiology of the Eye. Elsevier; 2010. pp. 443–458. [Google Scholar]
- 4.Van Essen DC, Glasser MF, Dierker DL, Harwell J, Coalson T. Parcellations and Hemispheric Asymmetries of Human Cerebral Cortex Analyzed on Surface-Based Atlases. Cerebral Cortex. 2011 doi: 10.1093/cercor/bhr291. [DOI] [PMC free article] [PubMed] [Google Scholar]
- 5.Reese BE. Mosaics, Tiling and Coverage by Retinal Neurons. In: Masland RH, Albright T, editors. The Senses. Volume 1. Academic Press; 2008. pp. 439–456. [Google Scholar]
- 6.Aster R, Borchers B, Thurber C. Parameter Estimation and Inverse Problems. NY: Academic Press; 2005. [Google Scholar]
- 7.Karp RM. Reducibility Among Combinatorial Problems. In: Miller RE, Thatcher JW, editors. Complexity of Computer Computations. Plenum; 1972. pp. 85–103. [Google Scholar]
- 8.Wong E, Baur B, Quader S, Huang C-H. Biological network motif detection: principles and practice. Briefings in Bioinformatics. doi: 10.1093/bib/bbr033. [DOI] [PMC free article] [PubMed] [Google Scholar]
- 9. Anderson JR, Jones BW, Yang J-H, Shaw MV, Watt CB, Koshevoy P, Spaltenstein J, Jurrus E, UV K, Whitaker R, et al. A computational framework for ultrastructural mapping of neural circuitry. PLoS Biol. 2009;7:e1000074. doi: 10.1371/journal.pbio.1000074.. • This paper provides a detailed description of every workflow stage in building a connectome or any large ultrastructural dataset. The key developments presented here are software solutions that can be adopted by existing TEM facilities and include repurposing SerialEM developed by David Mastronarde (see below), the fusion of optical small molecule immunocytochemistry and TEM imaging via the ir-tweak application, automatic registration assembly of TEM data volumes with the NCRToolkit, and early navigational tools. In addition, the authors show that the precision of mosaicking using these tools is better than a fraction of synaptic vesicle over a 0.25 mm range, an error of less than 0.003%. The key point is that hardware tools for connectomics are already abundant and the pivotal developments are software.
- 10.Stevens JK, Davis TL, Friedman N, Sterling P. A systematic approach to reconstructing microcircuitry by electron microscopy of serial sections. Brain Res. 1980;2:265–293. doi: 10.1016/0165-0173(80)90010-7. [DOI] [PubMed] [Google Scholar]
- 11. Kolb H, Famiglietti EVJ. Rod and cone pathways in the retina of the cat. Invest Ophthal. 1974;15:935–946.. • This landmark paper began the true analysis of networks in the retina, despite earlier attempts to use serial section reconstruction. This achievement was realized was partially because large portions of narrow field cells such as the AII AC could be encompassed in manual TEM series annotated on paper prints.
- 12.Kolb H, Nelson R. OFF-alpha and OFF-beta ganglion cells in cat retina: II. Neural circuitry as revealed by electron microscopy of HRP stains. J Comp Neurol. 1993;329:85–110. doi: 10.1002/cne.903290107. [DOI] [PubMed] [Google Scholar]
- 13. Strettoi E, Raviola E, Dacheux RF. Synaptic connections of the narrow-field, bistratified rod amacrine cell (AII) in the rabbit retina. J Comp Neurol. 1992;325:152–168. doi: 10.1002/cne.903250203.. • This is a classic in the serial section analysis of the AII AC and presaged larger scale connectomics in its use of digital tools for data review. The quality of preservation and use of ferricyanide metallization to achieve high membrane contrast remains the gold standard in TEM. We now know that iron-based metallization space-fills the atomic grid of biological specimens as deeply as osmium, but, unlike osmium, is not easily removable by oxidation and that it masks epitopes critical for molecular tagging. Strettoi et al. provided baseline quantification of many cellular features. The key limitation was that most of the lateral partners, such as wide-field BCs, were unidentifiable. Similar to prior reconstructions this was due the lack of coverage (1 cell) and the absence of a multiuser annotation environment like Viking. These incredible efforts were severely hampered by impoverished computational resources.
- 14.Calkins DJ, Tsukamoto Y, Sterling P. Microcircuitry and mosaic of a blue-yellow ganglion cell in the primate retina. Journal of Neuroscience. 1998;18:3373–3385. doi: 10.1523/JNEUROSCI.18-09-03373.1998. [DOI] [PMC free article] [PubMed] [Google Scholar]
- 15.Calkins DJ, Sterling P. Absence of spectrally specific lateral inputs to midget ganglion cells in primate retina. Nature. 1996;381:613–615. doi: 10.1038/381613a0. [DOI] [PubMed] [Google Scholar]
- 16.Calkins DJ, Sterling P. Microcircuitry for two types of achromatic ganglion cell in primate fovea. J Neurosci. 2007;27:2646–2653. doi: 10.1523/JNEUROSCI.4739-06.2007. [DOI] [PMC free article] [PubMed] [Google Scholar]
- 17.Klug K, Herr S, Ngo IT, Sterling P, Schein S. Macaque retina contains an S-cone OFF midget pathway. J Neurosci. 2003;23:9881–9887. doi: 10.1523/JNEUROSCI.23-30-09881.2003. [DOI] [PMC free article] [PubMed] [Google Scholar]
- 18.Marcus DS, Harwell J, Olsen T, Hodge M, Glasser MF, Prior F, Jenkinson M, Laumann T, Curtiss SW, Van Essen DC. Informatics and Data Mining Tools and Strategies for the Human Connectome Project. Front Neuroinform. 2011;5 doi: 10.3389/fninf.2011.00004. [DOI] [PMC free article] [PubMed] [Google Scholar]
- 19.Sporns O, Tononi G, Kötter R. The Human Connectome: A structural description of the human brain. PLoS Computational Biology. 2005;1:e42. doi: 10.1371/journal.pcbi.0010042. [DOI] [PMC free article] [PubMed] [Google Scholar]
- 20.van den Heuvel MP, Sporns O. Rich-Club Organization of the Human Connectome. The Journal of Neuroscience. 2011;31:15775–15786. doi: 10.1523/JNEUROSCI.3539-11.2011. [DOI] [PMC free article] [PubMed] [Google Scholar]
- 21. Anderson JR, Jones BW, Watt CB, Shaw MV, Yang J-H, DeMill D, Lauritzen JS, Lin Y, Rapp KD, Mastronarde D, et al. Exploring the retinal connectome. Molecular Vision. 2011;17:355–379.. •• This is the first large scale connectomics dataset in the public domain. The authors describe the assembly, molecular tagging and functional tagging, and visualization of critical reference neurons such as rod BCs, ON and OFF cone BCs, and the AII AC, assembly of extended networks and validation of re-imaging. In addition the authors introduce open-access tools (Connectome Viz, Vikingplot) that allow users to independently explore and render data from RC1.
- 22. Briggman KL, Helmstaedter M, Denk W. Wiring specificity in the direction-selectivity circuit of the retina. Nature. 2011;471:138–188. doi: 10.1038/nature09818.. • The authors demonstrate large-scale reconstructions of ON directionally selective ganglion cells visualized by calcium imaging and registered to the SBF dataset. While the quality of synaptic visualization was limited by SEM imaging, the authors were able to trace the preferential alignment of single oriented dendritic domains of starburst amacrine cells with the nominal bias direction of an associated ganglion cell. Such ganglion cells likely have inputs from other, yet unknown, amacrine cell classes and it remains unclear how much of the directionally selective bias can be attributed exclusively to starburst amacrine cells. Higher resolution datasets will be essential.
- 23. Bock DD, Lee W-CA, Kerlin AM, Andermann ML, Hood G, Wetzel AW, Yurgenson S, Soucy ER, Kim HS, Reid RC. Network anatomy and in vivo physiology of visual cortical neurons. Nature. 471:177–182. doi: 10.1038/nature09802.. •• In this tour-de-force, Bock and colleagues describe using their state-of-the art TEM camera array (TEMCA) system to reconstruct the ultrastructure of a set of calcium imaged orientation-selective cortical neurons. The TEMCA system is based on an elevated column with increased projection length, custom vacuum chamber and phosphor scintillation plate and a 2×2 camera array with a capture speed of 5–8 megapixels/sec. Custom LabView software was used for stage control. The 10 TB volume was a 50 µm thick vertical slice of mouse primary visual cortex 350 µm tall (spanning all cortical layers) and 450 µm wide. While this was an exceptional effort, the resolution was still slightly poorer (< 5nm) than completeness will require in neuropil containing gap junctions and small synapses. The key finding was the unexpected convergence of orientation-tuned neurons onto shared nearby inhibitory cells. Indeed it appears that survey of larger networks will be critical to understand the synaptic graphs underlying tuning.
- 24.Hoffmann C, Gaietta G, Zürn A, Adams SR, Terrillon S, Ellisman MH, Tsien RY, Lohse MJ. Fluorescent labeling of tetracysteine-tagged proteins in intact cells. Nat Protoc. 2010;5:1666–1677. doi: 10.1038/nprot.2010.129. [DOI] [PMC free article] [PubMed] [Google Scholar]
- 25.Gaietta G, Deerinck TJ, Adams SR, Bouwer J, Tour O, Laird DW, Sosinsky GE, Tsien RY, Ellisman MH. Multicolor and electron microscopic imaging of connexin trafficking. Science. 2002;296:503–507. doi: 10.1126/science.1068793. [DOI] [PubMed] [Google Scholar]
- 26.Lichtman JW, Smith SJ. Seeing circuits assemble. Neuron. 2008;60:441–448. doi: 10.1016/j.neuron.2008.10.040. [DOI] [PMC free article] [PubMed] [Google Scholar]
- 27. Shu X, Lev-Ram V, Deerinck TJ, Qi Y, Ramko EB, Davidson MW, Jin Y, Ellisman MH, Tsien RY. A genetically encoded tag for correlated light and electron microscopy of intact cells, tissues, and organisms. PLoS Biol. 2011;9:e1001041. doi: 10.1371/journal.pbio.1001041.. •• Green fluorescent protein transformed optical analysis of protein distribution in cells, but has not easily translated to TEM use. This paper describes a major advance in genetic models by using a plant flavoprotein (termed miniSOG) that generates single oxygen upon photoactivation (after glutaraldehyde fixation) that oxidizes diaminobenzidine to an osmiophilic polymer, forming a high-resolution, highly focal optical and electron dense target. The miniSOG method requires photoconversion prior to osmication but has exceptionally high substantivity and does not diffuse significantly from the conversion site.
- 28.Jones BW, Watt CB, Frederick JM, Baehr W, Chen CK, Levine EM, Milam AH, LaVail MM, Marc RE. Retinal remodeling triggered by photoreceptor degenerations. Journal of Comparative Neurology. 2003;464:1–16. doi: 10.1002/cne.10703. [DOI] [PubMed] [Google Scholar]
- 29.Jones BW, Kondo M, Terasaki H, Watt CB, Rapp K, Anderson J, Lin Y, Shaw MV, Yang J-H, Marc RE. Retinal degenerative disease and remodeling in a large eye model. J Comp Neurol. 2011;19:2713–2733. doi: 10.1002/cne.22703. [DOI] [PMC free article] [PubMed] [Google Scholar]
- 30.Marc RE, Liu W. Fundamental GABAergic amacrine cell circuitries in the retina: nested feedback, concatenated inhibition, and axosomatic synapses. Journal of Comparative Neurology. 2000;425:560–582. doi: 10.1002/1096-9861(20001002)425:4<560::aid-cne7>3.0.co;2-d. [DOI] [PubMed] [Google Scholar]
- 31. Micheva KD, Busse B, Weiler NC, O’Rourke N, Smith SJ. Single-synapse analysis of a diverse synapse population: proteomic imaging methods and markers. Neuron. 2010;68:639–653. doi: 10.1016/j.neuron.2010.09.024.. •• Molecular markers for segmenting TEM imagery is a critical aspect of speeding analysis. While small molecule immunocytochemistry is robust for TEM, few proteins have proven to be expressed at both high enough levels and have detectable epitopes to be compliant with electron imaging. Further, classical protein immunocytochemistry involves thick sections and penetration strategies such as freeze-thaw fracturing and detergents. Based on their earlier work, Micheva and co-workers demonstrate that serial probing/reprobing methods using ultrathin sections and optical capture can multiplex extremely high-density datasets into nanoscale structures like synapses. The use of clustering tools then richly segments the densely labeled dataset. Ultimately, as immunoprobes for proteins are engineered or opportunistically discovered to be glutaraldehyde and osmium tolerant, this technology will become the standard rather than the exception.
- 32.Micheva KD, Bruchez MP. The gain in brain: novel imaging techniques and multiplexed proteomic imaging of brain tissue ultrastructure. Current Opinion in Neurobiology. 2011 doi: 10.1016/j.conb.2011.08.004. [DOI] [PMC free article] [PubMed] [Google Scholar]
- 33.Micheva KD, Smith SJ. Array tomography: A new tool for imaging the molecular architecture and ultrastructure of neural circuits. Neuron. 2007;55:25–36. doi: 10.1016/j.neuron.2007.06.014. [DOI] [PMC free article] [PubMed] [Google Scholar]
- 34.Briggman KL, Denk W. Towards neural circuit reconstruction with volume electron microscopy techniques. Current Opinion in Neurobiology. 2006;16:562–570. doi: 10.1016/j.conb.2006.08.010. [DOI] [PubMed] [Google Scholar]
- 35.Denk W, Horstmann H. Serial block-face scanning electron microscopy to reconstruct three-dimensional tissue nanostructure. PLoS Biol. 2004;2:e329. doi: 10.1371/journal.pbio.0020329. [DOI] [PMC free article] [PubMed] [Google Scholar]
- 36.Knott G, Marchman H, Wall D, Lich B. Serial section scanning electron microscopy of adult brain tissue using focused ion beam milling. J Neurosci. 2008;28:2959–2964. doi: 10.1523/JNEUROSCI.3189-07.2008. [DOI] [PMC free article] [PubMed] [Google Scholar]
- 37.Bourne JN, Harris KM. Nanoscale analysis of structural synaptic plasticity. Current Opinion in Neurobiology. 2011;22:1–11. doi: 10.1016/j.conb.2011.10.019. [DOI] [PMC free article] [PubMed] [Google Scholar]
- 38.Kleinfeld D, Bharioke A, Blinder P, Bock DD, Briggman KL, Chklovskii DB, Denk W, Helmstaedter M, Kaufhold JP, Lee WC, et al. Large-Scale Automated Histology in the Pursuit of Connectomes. J Neurosci. 2011;31:16125–16138. doi: 10.1523/JNEUROSCI.4077-11.2011. [DOI] [PMC free article] [PubMed] [Google Scholar]
- 39.Tasdizen T, Koshevoy P, Grimm B, Anderson JR, Jones BW, Whitaker R, Marc RE. Automatic mosaicking and volume assembly for high-throughput serial-section transmission electron microscopy. J Neuroscience Methods. 2010;193:132–144. doi: 10.1016/j.jneumeth.2010.08.001. [DOI] [PMC free article] [PubMed] [Google Scholar]
- 40. Mastronarde DN. Automated electron microscope tomography using robust prediction of specimen movements. J Struct Biol. 2005;152:36–51. doi: 10.1016/j.jsb.2005.07.007.. •• SerialEM is one of the most effective, flexible and widely used software applications for electron microscopy. Originally part of a suite of tools for electron tomography, SerialEM was designed to control stage translation, stage tilt, specimen focus and image acquisition on both JEOL and FEI TEMs fitted with a wide range of phosphorimagingand some new electron-sensitive CCD cameras. Using predictive and computed sample position, SerialEM can be scripted to acquire many thousands of focused, overlapping image tiles daily. Importantly, it enables multi-use systems where connectomics projects do not prevent other users from using the same platform for other advanced imaging projects. It is freely available from the Boulder Laboratory for 3-D Electron Microscopy of Cells (http://bio3d.colorado.edu/SerialEM/).
- 41. Anderson JR, Grimm B, Mohammed S, Jones BW, Spaltenstein J, Koshevoy P, Tasdizen T, Whitaker R, Marc RE. The Viking Viewer: Scalable multiuser annotation and summarization of large connectomics datasets. J Microscopy. 2011;241:13–28. doi: 10.1111/j.1365-2818.2010.03402.x.. • Among the various data viewers for TEM data, Viking stands apart in ease of installation, use, flexibility and its capacity to rapidly populate databases for graphical and statistical queries. Viking delivers connectome imagery over the internet using HTTP and scales to large volume sizes for connectomics, and applies image transformations in real-time to that many different viewing strategies are possible. It readily intercalates optical molecular imagery onto TEM imagery. With an easily extensible user interface, Viking allows insertion of various visualization and morphometrics tools and readily passes data between network graph applications (Connectome Viz) and the ultrastructural volume.
- 42.Berlanga ML, Phan S, Bushong EA, Wu S, Kwon O, Phung BS, Lamont S, Terada M, Tasdizen T, Martone ME, et al. Three-dimensional reconstruction of serial mouse brain sections: Solution for flattening high-resolution large-scale mosaics. Frontiers in Neuroanatomy. 2011;5 doi: 10.3389/fnana.2011.00017. [DOI] [PMC free article] [PubMed] [Google Scholar]
- 43.Jeong WBJ, Hadwiger M, Blue R, Law C, Vazquez A, Reid C, Lichtman J, Pfister H IEEE Computer Graphics and Applications V. SSECRETT and NeuroTrace: Interactive Visualization and Analysis Tools for Large-Scale Neuroscience Datasets. IEEE Computer Graphics and Applications. 2010;30:58–70. doi: 10.1109/MCG.2010.56. p.58–70, (2010) [DOI] [PMC free article] [PubMed] [Google Scholar]
- 44.Fiala JC. Reconstruct: a free editor for serial section microscopy. J Microsc. 2005;218:52–61. doi: 10.1111/j.1365-2818.2005.01466.x. [DOI] [PubMed] [Google Scholar]
- 45.Mikula S, Trotts I, Stone JM, Jones EG. Internet-enabled high-resolution brain mapping and virtual microscopy. Neuroimage. 2007;35:9–15. doi: 10.1016/j.neuroimage.2006.11.053. [DOI] [PMC free article] [PubMed] [Google Scholar]
- 46.Jurrus E, Paiva ARC, Watanabe S, Jorgensen EM, Anderson J, Jones B, Whitaker R, Marc R, Tasdizen T. Detection of neuron membranes in electron microscopy images using auto-context. Medial Image Analysis. 2010;14:770–783. doi: 10.1016/j.media.2010.06.002. [DOI] [PMC free article] [PubMed] [Google Scholar]
- 47.Narayanaswamy A, Wang Y, Roysam B. 3-D image pre-processing algorithms for improved automated tracing of neuronal arbors. Neuroinformatics. 2011;9:219–231. doi: 10.1007/s12021-011-9116-z. [DOI] [PubMed] [Google Scholar]
- 48.Luisi J, Narayanaswamy A, Galbreath Z, Roysam B. The FARSIGHT trace editor: an open source tool for 3-D inspection and efficient pattern analysis aided editing of automated neuronal reconstructions. Neuroinformatics. 2011;9:305–315. doi: 10.1007/s12021-011-9115-0. [DOI] [PubMed] [Google Scholar]
- 49.Amari SI, Beltrame F, Bjaalie JG, Dalkara T, Schutter ED, Egan GF, Goddard NH, Gonzalez C, Grillner S, Herz A, et al. Neuroinformatics: The integration of shared databases and tools towards integrative neuroscience. Journal of Integrative Neuroscience. 2002;1:117–128. doi: 10.1142/s0219635202000128. [DOI] [PubMed] [Google Scholar]
- 50.Akil H, Martone ME, Van Essen DC. Challenges and opportunities in mining neuroscience data. Science. 2011;331:708–712. doi: 10.1126/science.1199305. [DOI] [PMC free article] [PubMed] [Google Scholar]
- 51.Martone ME, Tran J, Wong WW, Sargis J, Fong L, Larson S, Lamont SP, Gupta A, Ellisman MH. The cell centered database project: an update on building community resources for managing and sharing 3D imaging data. J Struct Biol. 2008;161:220–231. doi: 10.1016/j.jsb.2007.10.003. [DOI] [PMC free article] [PubMed] [Google Scholar]
- 52.Famiglietti EVJ, Kolb H. A bistratified amacrine cell and synaptic circuitry in the inner plexiform layer of the retina. Brain Res. 1975;84:293–300. doi: 10.1016/0006-8993(75)90983-x. [DOI] [PubMed] [Google Scholar]
- 53.Tsukamoto Y, Morigiwa K, Ueda M, Sterling P. Microcircuits for night vision in mouse retina. J Neurosci. 2001;21:8616–8623. doi: 10.1523/JNEUROSCI.21-21-08616.2001. [DOI] [PMC free article] [PubMed] [Google Scholar]
- 54. Kamasawa N, Furman CS, Davidson KG, Sampson JA, Magnie AR, Gebhardt BR, Kamasawa M, Yasumura T, Zumbrunnen JR, Pickard GE, et al. Abundance and ultrastructural diversity of neuronal gap junctions in the OFF and ON sublaminae of the inner plexiform layer of rat and mouse retina. Neuroscience. 2006;142:1093–1117. doi: 10.1016/j.neuroscience.2006.08.020.. • In this definitive and elegant freeze-fracture analysis, Rash and his colleagues show that many gap junctions in the mammalian retinal inner plexiform layer are suboptical and that linear gap junctions are prevalent as well. This means that any technology that lacks the ability to resolve gap junctions and permit extremely high resolution re-imaging (e.g. ablation methods) will be unable to fully build retinal networks. This is a critical issue as virtually every superclass of retinal cell displays members with either homocellular or heterocellular coupling, especially many ganglion cell classes [55]. But these findings also challenge high-throughput TEM which will not detect linear junctions except in very rare, fortuitous orientations with optimized goniometric imaging. The appropriate solution will be to characterize the partners in such junctions by freeze-fracture immunolabeling: a challenging and low throughput method.
- 55.Massey SC. Circuit Functions of Gap Junctions in the Mammalian Retina. In: Masland RH, Albright T, editors. The Senses. Volume 1. Academic Press; 2008. pp. 457–472. [Google Scholar]