

Abstract
BACKGROUND AND PURPOSE
Neuropilin-1 (NRP1) is a VEGF receptor that is widely expressed in normal tissues and is involved in tumour angiogenesis. MNRP1685A is a rodent and primate cross-binding human monoclonal antibody against NRP1 that exhibits inhibition of tumour growth in NPR1-expressing preclinical models. However, widespread NRP1 expression in normal tissues may affect MNRP1685A tumour uptake. The objective of this study was to assess MNRP1685A biodistribution in tumour-bearing mice to understand the relationships between dose, non-tumour tissue uptake and tumour uptake.
EXPERIMENTAL APPROACH
Non-tumour-bearing mice were given unlabelled MNRP1685A at 10 mg·kg−1. Tumour-bearing mice were given 111In-labelled MNRP1685A along with increasing amounts of unlabelled antibody. Blood and tissues were collected from all animals to determine drug concentration (unlabelled) or radioactivity level (radiolabelled). Some animals were imaged using single photon emission computed tomography – X-ray computed tomography.
KEY RESULTS
MNRP1685A displayed faster serum clearance than pertuzumab, indicating that target binding affected MNRP1685A clearance. I.v. administration of 111In-labelled MNRP1685A to tumour-bearing mice yielded minimal radioactivity in the plasma and tumour, but high levels in the lungs and liver. Co-administration of unlabelled MNRP1685A with the radiolabelled antibody was able to competitively block lungs and liver radioactivity uptake in a dose-dependent manner while augmenting plasma and tumour radioactivity levels.
CONCLUSIONS AND IMPLICATIONS
These results indicate that saturation of non-tumour tissue uptake is required in order to achieve tumour uptake and acceptable exposure to antibody. Utilization of a rodent and primate cross-binding antibody allows for translation of these results to clinical settings.
Keywords: neuropilin-1, antibody, dose escalation, biodistribution
Introduction
Neuropilin-1 (NRP1) is a 130–140 kDa transmembrane protein with a prominent role in regulating angiogenesis (Bagri et al., 2009) and contains three structural motifs: (i) an extracellular structure containing two CUB homology domains (a1, a2), two coagulation factor V/VIII homology domains (b1, b2) and a MAM domain (c); (ii) a transmembrane domain; and (iii) a short cytoplasmic domain (Soker et al., 1998). NRP1 acts as a co-receptor for semaphorins and members of the VEGF family. NRP1 binds to VEGF165 to enhance its binding to VEGF receptor 2, increasing endothelial cell chemotaxis (Soker et al., 1998; Bielenberg et al., 2006). Mice with targeted NRP1 deletion have severe defects in vascular remodelling (Bagri et al., 2009). NRP1 is expressed by vascular endothelial and epithelial cells of numerous normal adult human tissues, including heart, placenta, breast, endometrium, kidneys, lungs, liver, pancreas and skeletal muscle (Soker et al., 1998; Bielenberg et al., 2006). Over-expression of NRP1 occurs on some tumour cells, including those of prostate, mammary, bladder, kidney, colon, pancreas, skin, ovary and lung carcinomas (Bielenberg et al., 2006).
A rodent and primate cross-reactive human IgG1 with similar binding affinity across species was generated against the b1b2 domain, VEGF165 binding domain (Mamluk et al., 2002), of NRP1 that slowed tumour growth in xenograft models (Liang et al., 2007). This anti-NRP1 antibody, MNRP1685A, blocked tumour growth in HM7-tumours, a model with very little tumour epithelial cell NRP1 expression, but with endothelial cell expression, suggesting that MNRP1685A mediates its effect through blocking the angiogenesis necessary to support tumour growth (Liang et al., 2007). In addition, in select xenograft models, MNRP1685A therapy coupled with concomitant anti-VEGF treatment enhanced the effect of slowing tumour growth compared with that of anti-VEGF treatment alone (Pan et al., 2007), pointing to MNRP1685A's promise as a potential anti-tumour biotherapeutic agent.
Numerous monoclonal antibodies are being developed against various tumour targets with the goal of suppressing tumour growth (Sliwkowski et al., 1999; Herbst et al., 2001; Buchsbaum et al., 2003; Ferrara et al., 2004; Adams and Weiner, 2005). A thorough understanding of the pharmacokinetics (PK) and biodistribution of such molecules would inform their clinical development. Fast clearance or non-linear plasma PK profiles of antibody therapeutics can often be attributed to target-mediated clearance (Lammerts van Bueren et al., 2006) and, in such cases, biodistribution data can identify the tissue in which the target is located (Baxter et al., 1995; Lobo et al., 2004; Lammerts van Bueren et al., 2006). Tissue distribution studies can also reveal non-antigen-dependent, off-target binding, which may also influence plasma PK (Jain, 1999; Bumbaca et al., 2011). Targets having widespread non-tumour tissue expression may affect tumour uptake of a target therapeutic and vice versa. Additionally, attributes of the antibody such as size, molecular weight and target affinity (Adams et al., 2001; Minchinton and Tannock, 2006) as well as tumour physiology, including degree of vascularity, antigen density and necrosis (Jain, 1999; Minchinton and Tannock, 2006; Thurber et al., 2008; Tabrizi et al., 2010) can influence antibody distribution to and within the tumour, so it is understandable that all tumour-associated target antigens may not be accessible to the antibody. The implications of these limitations on therapeutic efficacy warrant a detailed understanding of the relationship between antibody PK, biodistribution and tumour uptake.
Although NRP1 has widespread distribution in normal adult tissues, little is known about the level of expression on the surface of cells, and therefore, it was unclear how the NRP1 expression level in normal tissues would affect MNRP1685A biodistribution to tumour tissue, if at all. Thus, this work sought to evaluate the biodistribution of MNRP1685A by exploring the relationship between dose, non-tumour tissue uptake and tumour uptake to support its clinical development. First, MNRP1685A serum concentrations were determined in non-tumour-bearing mice and compared with those of pertuzumab, a humanized anti-HER2 antibody that does not cross-react with murine HER2 antigen and therefore does not have target-mediated clearance in mice (Adams et al., 2006). Furthermore, pertuzumab and MNRP1685A use the same consensus frameworks of IgG1 and have the same molecular weight (150 kDa), making pertuzumab a suitable control. This comparison should ascertain what effect, if any, normal tissue NRP1 expression had on antibody PK. Subsequently, a biodistribution study was conducted in tumour-bearing mice, with dose escalation of unlabelled antibody and a fixed dose of radiolabelled antibody. This competitive binding approach should determine the degree of saturation in each tissue at each dose, delineating the relationship between dose, non-tumour tissue uptake and tumour uptake. In addition, the results were complemented with non-invasive live animal imaging and ex vivo assays evaluating blood cell and tumour binding.
Methods
DOTA conjugation and 111In incorporation
Aliquots containing 5 mg of MNRP1685A (Genentech, South San Francisco, CA, USA) or an IgG1 control antibody (Genentech) were exchanged from their respective formulation buffers (proprietary) into aqueous 50 mM sodium borate, pH 8.5 using illustra NAP5™ columns (GE Healthcare Life Sciences, Piscataway, NJ, USA). Exactly 5 molar equivalents of the N-hydroxysuccinimidyl ester of 1,4,7,10-tetraazacyclododecane-N,N′,N′′,N′′′-tetraacetic acid (DOTA-NHS) in 0.68 µL of dimethyl formamide was added to 600 µL borate-buffered protein solutions. Reaction mixtures were gently agitated for 1 h at 37°C. The reaction was terminated by promptly applying the mixtures to NAP5™ columns pre-equilibrated in aqueous 0.3 M ammonium acetate buffer, pH 7.0.
111In was incorporated into DOTA through the addition of a 3 µL (30.3 MBq) aliquot of 111InCl (MDS Nordion, Ottawa, ON, Canada) to a 17 µL aliquot of the ammonium acetate-buffered DOTA-MNRP1685A (59.4 µg) or DOTA-control antibody conjugate (70.2 µg). Reaction mixtures were gently agitated for 1 h at 37°C. A 5 µL aliquot of 50 mM aqueous EDTA challenge solution was added, followed by an additional 75 µL aliquot of aqueous 0.3 M ammonium acetate buffer, pH 7.0. The mixture was applied to a NAP5 ™ column, from which the radiolabelled protein eluted in a 500-µL fraction of PBS. The specific activity of [111In]-DOTA-MNRP1685A and [111In]-DOTA-control antibody were 0.177 and 0.284 MBq·µg−1 respectively. The radiolabelled antibodies were shown to maintain ∼80% antigen binding to their unmodified counterparts by elisa and were shown to be intact by size-exclusion HPLC.
Radioiodination
MNRP1685A and control antibody were radioiodinated with 125I using the indirect iodogen addition method as previously described (Chizzonite et al., 1991). The radiolabelled proteins were purified using NAP5™ columns pre-equilibrated in PBS. The specific activities of [125I]-MNRP1685A and [125I]-control antibody were 0.132 and 0.123 MBq·µg−1 respectively. The radiolabelled antibodies were shown to maintain ∼90% antigen binding to their unmodified counterparts by elisa and were shown to be intact by size-exclusion HPLC.
PK study
All in vivo protocols, housing, and anaesthesia were approved by the Institutional Animal Care and Use Committees of Genentech Laboratory Animal Resources, in compliance with the Association for Assessment and Accreditation of Laboratory Animal Care regulations. Female athymic nude mice (nu/nu) (n= 3) within the age range of 6–8 weeks (Charles River Laboratories, Hollister, CA, USA) were given 10 mg·kg−1 MNRP1685A i.v., as a bolus. Serum samples were collected at 5 min; 1, 4 and 8 h; and 1, 1.5, 2, 3, 4, 7, 10, 14, 21, and 28 days post dose and analysed by elisa for antibody concentration.
The concentration–time data were used to estimate PK parameters with WinNonlin Enterprise, Version 5.1.1 (Pharsight Corporation, Mountain View, CA, USA). A naïve pooled approach was used to provide one estimate for the treatment group. Non-compartmental analysis (NCA) [WinNonlin Model 201; i.v. Bolus input using uniform weighting and linear trapezoidal (linear interpolation) rule] was used to estimate area under the antibody serum concentration versus time curve (AUC). Clearance (CL) was calculated using the following equation: CL = Dose/AUC. The PK results from this study with MNRP1685A were compared with those obtained from a separate study conducted with pertuzumab, as previously described (Adams et al., 2006).
Ex vivo blood cell binding
[125I]-MNRP1685A or [125I]-control antibody with or without 100 µg·mL−1 excess unlabelled antibody was introduced into human whole blood (Bioreclamation LLC, Hicksville, NY, USA). Six 0.5 mL aliquots of blood were incubated for 1 h at 37°C. Three of the six aliquots were centrifuged at 12,800×g for 5 min at 4°C to separate the plasma from the cell pellets, after which the cell pellets were washed with 0.5 mL cold PBS. To re-calcify the blood, calcium chloride was added to the remaining three aliquots of whole blood at a final concentration of 25 mM, immediately inverted and then further incubated at ambient temperature for 30 min until the blood had completely clotted. The samples were centrifuged as above to separate serum from the clots, which were washed once with 0.5 mL cold PBS. All samples were counted for radioactivity on a gamma counter (Wallac 1480 Wizard 3″, EC&G Wallac. Turku, Finland). The data are presented as the percent of total radioactivity. Significance was assessed using a one-way anova followed by the Tukey post test (GraphPad Prism v5.04, La Jolla, CA, USA).
In vivo biodistribution in tumour bearing mice
Female mice of the same strain and weight range as the PK study were inoculated s.c. with 5 x 10⁶ HM7 cells (human colon carcinoma, ATCC, Manassas, VA, USA) suspended in HBSS in their right flanks 7 days before receiving the radiolabelled material. When the tumours were between 100 and 200 mm3, the mice were co-dosed with 7.4 MBq·kg−1[111In]-DOTA-MNRP1685A (0.05 mg·kg−1) along with unlabelled antibody at 0, 0.1, 0.3, 0.5, 1, 2.5, 5, 7.5, 10, 15, 20, 25, 40 or 80 mg·kg−1 via i.v. bolus (multiple studies). At 15 min and 6, 24, 48 and 120 h post dose, blood (processed for plasma), tumour, lungs, liver, kidneys and muscle (gastrocnemius) were collected (n= 4). The radioactivity level in each sample was calculated and expressed as percentage of injected dose per gram or millilitre of sample (%ID·g−1 or %ID·mL−1). Significance was assessed using a one-way anova followed by the Tukey's post test (GraphPad Prism). Plasma samples were also analysed by size-exclusion HPLC.
Size-exclusion HPLC separation was carried out on a Phenomenex™ BioSep-SEC-S 3000, 300 × 7.8 mm, 5 µm column (Torrance, CA). The mobile phase was PBS, and the flow rate was 0.5 mL·min−1 (isocratic) for 30 min. The ChemStation analogue-to-digital converter was set to 25 000 units per mV, peak width 2 s, slit 4 nM (Agilent Technologies, Santa Clara, CA, USA). [111In] was detected with a raytest Ramona 90 (Raytest USA, Inc., Wilmington, NC, USA) in line with a standard Agilent 1100 HPLC module system. The data were collected using ChemStation for LC 3D Systems (revision B.01.03[204]).
Single photon emission computed tomography – X-ray computed tomography (SPECT-CT)
Non-tumour-bearing mice of the same strain and weight range as the biodistribution study received an i.v. bolus consisting of [111In]-DOTA-MNRP1685A (3.69 MBq) or [111In]-DOTA-control antibody (4.03 MBq) in 200 µL of saline (n= 1). Initiation of non-invasive SPECT-CT (Gamma-Medica, Northridge, CA, USA) imaging was executed 24 h from the time of tracer injection. Image acquisition times for CT and SPECT were an average of 2 and 45 min, respectively, with approximately 20 000 counts per projection (20 s per projection) for the latter. The SPECT and CT data was transferred to 256 × 256 matrix and fused using AMIRA® graphics software (TGS, San Diego, CA, USA), allowing the achievement of simultaneous scintigraphic and anatomic information in all tomographic scans in the three different spatial axes.
Ex vivo tumour binding
Female mice of the same strain and weight range as the biodistribution study were inoculated with HM7 cells as described above. When the tumours were 100–200 mm3, the mice received an i.v. bolus of unlabelled MNRP1685A at 0, 1, 2, 5, 10, 20 and 40 mg·kg−1. Tumours were collected at 120 h post dose (n= 3). Each tumour was placed inside a culture dish and diced in 2 mL of RPMI-1640/10% FBS/10 µg·mL−1 non-specific IgG (media). The diced tumours were carefully transferred to 4 mL cryovials. The culture dish was rinsed with 1 mL media to remove any residual cells, and the rinse was combined with the rest of the tumour pieces. Samples were gently agitated for 30 min at room temperature to block non-specific binding. Tumour sections were washed once by centrifugation at 1000×g for 3 min at 4°C and re-suspended in fresh media, containing [125I]-MNRP1685A at 1 × 10⁶ counts per minute (cpm)·mL−1. Following gentle agitation for 4 h at 4°C to allow for specific binding of the radiolabelled antibody, the tumour sections were washed twice by centrifugation, saving both the media and wash. All fractions were counted for total radioactivity in a gamma counter. The radioactivity level in each sample was calculated and expressed as a percentage of total radioactivity per gram (%Total·g−1).
Results
PK in non-tumour-bearing mice
Following 10 mg·kg−1 i.v. administration to athymic nude mice, MNRP1685A cleared much faster than pertuzumab (Figure 1), an IgG1 antibody with no target-mediated clearance in mice. The clearance for MNRP1685A at 10 mg·kg−1 was about 70 mL·day−1·kg−1, whereas that for pertuzumab, over the dose range 3–90 mg·kg−1 was 5.6–9.2 mL·day−1·kg−1 (Adams et al., 2006).
Figure 1.
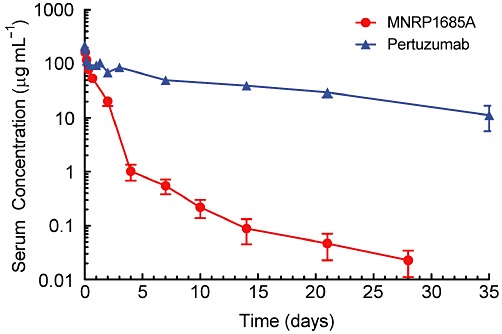
Serum PK of MNRP1685A and pertuzumab. Serum concentration versus time profile of MNRP1685A following i.v. administration at 10 mg·kg−1 in athymic nude mice. Pertuzumab was administered at 30 mg·kg−1 in the same mouse strain and the serum concentration versus time profile presented in the figure was normalized to a 10 mg·kg−1 dose based on its linear PK profile (Adams et al., 2006).
Ex vivo blood cell binding
The plasma fraction of whole blood contained most of the radioactivity (∼99%), for both MNRP1685A and the isotype-matched control antibody whether in the absence or presence of excess unlabelled antibody (Table 1). In the whole blood samples, processed for serum and blood clot, a majority of the radioactivity (80–90%) was detected in the serum fraction for both antibodies, regardless of unlabelled antibody levels, but was generally lower that was detected in the plasma. The difference in radioactivity between the plasma and serum fractions is an artefact of the differing ability to separate the plasma from the cell pellets and the serum from the blood clots. There was no statistical difference between MNRP1685A and control antibody plasma (P= 0.465 and 0.308 for the tracer and tracer + unlabelled antibody, respectively) and serum radioactivity levels (P= 0.189 and 0.262 for the tracer and tracer + unlabelled antibody, respectively). These data demonstrate minimal or no binding to blood cells.
Table 1.
Percent recovery of [125I]-MNRP1685A or [125I]-control IgG1 ± unlabelled antibody following incubation in human whole blood (average ± SD)
| Matrix | Antibody | [125I]-antibody | [125I]-antibody + 100 µg·mL−1 unlabelled antibody |
|---|---|---|---|
| Plasma | MNRP1685A | 99.1 ± 0.200 | 98.9 ± 0.200 |
| Control IgG1 | 99.9 ± 0.0360 | 99.9 ± 0.220 | |
| Cell pellet | MNRP1685A | 0.900 ± 0.200 | 1.10 ± 0.200 |
| Control IgG1 | 0.0853 ± 0.0360 | 0.0949 ± 0.0220 | |
| Serum | MNRP1685A | 86.5 ± 6.30 | 83.5 ± 7.60 |
| Control IgG1 | 92.6 ± 2.03 | 90.1 ± 4.30 | |
| Blood clot | MNRP1685A | 13.5 ± 6.30 | 16.5 ± 7.60 |
| Control IgG1 | 7.43 ± 2.03 | 9.92 ± 4.30 |
There were no statistically significant differences between the MNRP1685A radioactivity levels and those of the control antibody or between the tracer radioactivity levels and those of the tracer + unlabelled antibody (P > 0.05).
Biodistribution in tumour-bearing mice
The tumour-bearing mice received tracer amounts of [111In]-DOTA-MNRP1685A along with 0, 5, 10, 20, 40 and 80 mg·kg−1 unlabelled MNRP1685A. For all dose groups, the plasma radioactivity levels decreased in a biphasic manner, with a rapid decrease in radioactivity during the first 6 h of the study and a more gradual decrease for the remainder of the study (Figure 2A). Only a single peak corresponding to the retention time of the intact MNRP1685A was detected by size-exclusion HPLC, and it decreased over time (Figure 2B). The plasma fraction of whole blood contained a majority of the radioactivity, with 99% of the injected dose compared to 1% in the cell pellet (Figure 2C).
Figure 2.
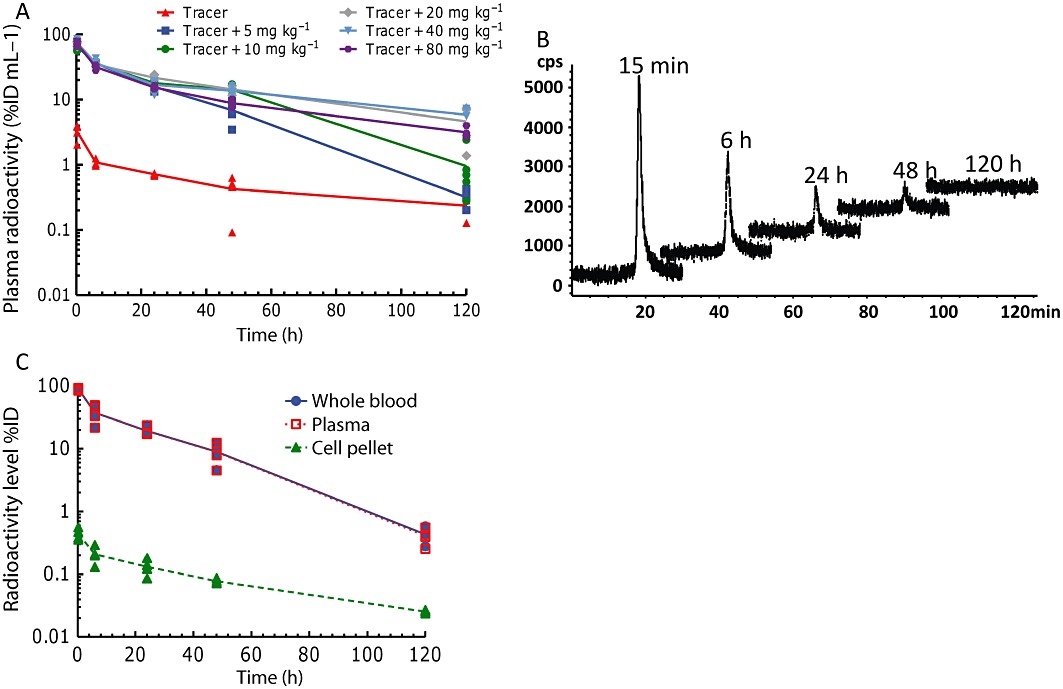
In vivo radioactive plasma and whole blood characterization following i.v. administration of [111In]-DOTA-MNRP1685A at 7.4 MBq·kg−1 (0.05 mg·kg−1) along with 0, 5, 10, 20, 40, and 80 mg·kg−1 unlabelled MNRP1685A to female athymic nude HM7-tumour-bearing mice (n= 4). (A) Plasma radioactivity levels represented as percentage of injected dose per millilitre of plasma (%ID·mL−1). (B) Representative size-exclusion HPLC radiochromatograms of the plasma samples. (C) Whole blood, plasma and cell pellet radioactivity levels represented as %ID.
Animals receiving only the tracer had lower plasma radioactivity levels than those that received both tracer and unlabelled antibody (Figure 2A). During the first 24 h of the study, radioactivity levels among the dose groups receiving tracer and unlabelled antibody overlapped. Beyond 24 h, the plasma radioactivity, in terms of %ID·mL−1, from the 5 mg·kg−1 dose group decreased significantly more than the groups given 20, 40 or 80 mg·kg−1 (P < 0.05), and that of the 10 mg·kg−1 dose decreased significantly more than the groups given 40 or 80 mg·kg−1 (P < 0.05). There was no statistical difference amongst the groups given 20, 40 or 80 mg·kg−1 (P > 0.05).
At 24 h post-tracer dose, the lungs and liver comprised the majority of radioactivity per gram of tissue (Figure 3A). The kidneys had the next highest amount of radioactivity, followed by the tumour and then muscle. When the tracer was administered with 5 mg·kg−1 unlabelled antibody, radioactivity in the lungs and liver dramatically decreased, while that in the tumour and blood increased. As the amount of unlabelled MNRP1685A was increased, the radioactivity in the lungs and kidneys continued to decrease. The muscle radioactivity levels remained relatively constant as the amount of antibody increased.
Figure 3.
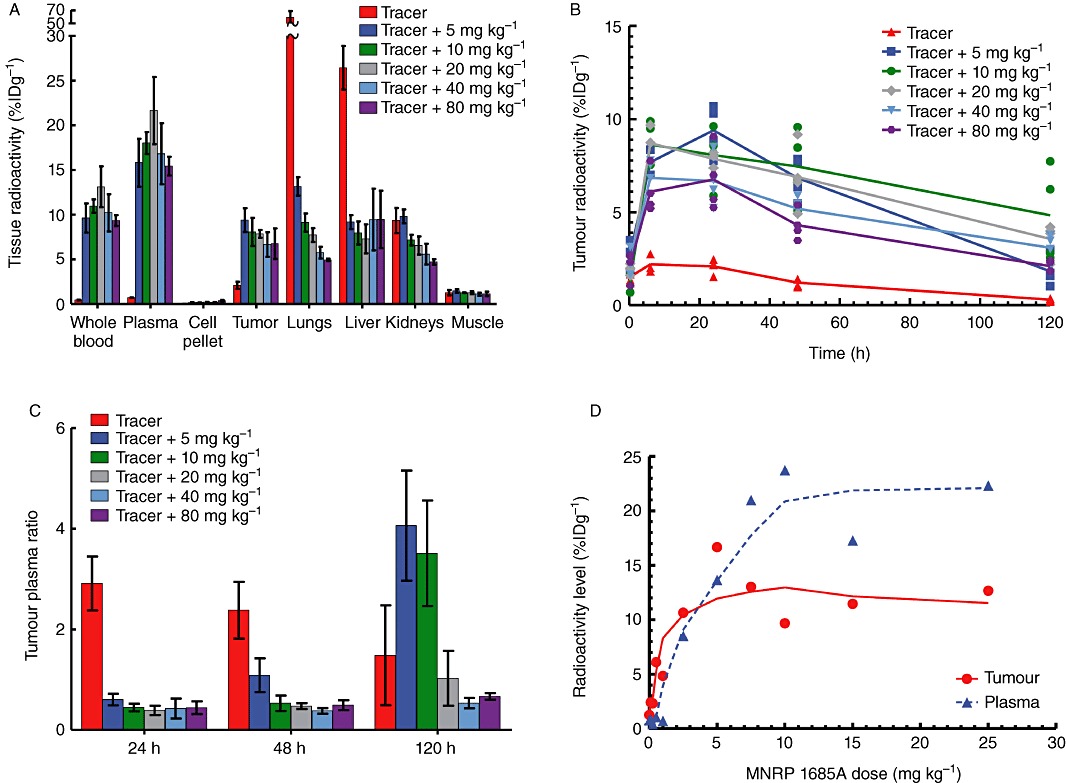
In vivo tissue radioactivity levels and tumour : plasma ratios following i.v. administration of [111In]-DOTA-MNRP1685A at 7.4 MBq·kg−1 (0.05 mg·kg−1) along with 0, 5, 10, 20, 40 and 80 mg·kg−1 unlabelled MNRP1685A to female athymic nude HM7 tumour-bearing mice (n= 4). (A) Tissue radioactivity levels at 24 h post dose, represented as percentage of injected dose per gram of tissue (%ID·g−1). (B) Tumour radioactivity levels over time represented as %ID·g−1. (C) Average tumour : plasma radioactivity levels over time. (D) Plasma and tumour radioactivity levels following an i.v. administration of [111In]-DOTA-MNRP1685A at 7.4 MBq·kg−1 (0.05 mg·kg−1) along with 0, 0.1, 0.3, 0.5, 1, 2.5, 5, 7.5, 10, 15 and 25 mg·kg−1 unlabelled MNRP1685A at 24 h post dose (n= 1), represented as %ID·g−1.
In the tumour, the radioactivity levels for all groups peaked between the 6 and 24 h time points and then decreased for the remainder of the 120 h study (Figure 3B). The tumour radioactivity levels of the animals receiving only tracer were much lower than those that were dosed with the tracer combined with unlabelled antibody. Overall, the groups dosed with both tracer and unlabelled antibody had similar radioactivity levels. Although not statistically significant, aside from the 5 mg·kg−1 dose groups, there appeared to be a dose-dependent decrease in tumour radioactivity levels (P > 0.05). At 24 h post dose, except for the tracer dose, there was no difference in tumour : plasma ratios between the dose groups (P > 0.05; Figure 3C). The dose groups higher than 5 mg·kg−1 had similar tumour : plasma ratios at 48 h post dose (P > 0.05) and at the 120 h time point, there was no difference among the 20, 40 and 80 mg·kg−1 dose groups (P > 0.05). In a separate study, when the radiolabelled antibody was co-dosed with 0, 0.1, 0.3, 0.5, 1, 2.5, 5, 7.5, 10, 15 and 25 mg·kg−1 unlabelled antibody, at 24 h post dose, a dose-dependent increase in radioactivity was observed in the tumours up to about 2.5–5 mg·kg−1, after which the radioactivity appeared to reach a plateau (Figure 3D). The tumour : plasma ratios also increased with dose before reaching a plateau starting with the 2.5 mg·kg−1 dose.
SPECT-CT imaging
Qualitatively, the radioactivity in the [111In]-DOTA-MNRP1685A dosed mouse was more localized in the lungs and liver, while that of the [111In]-DOTA-control antibody-dosed mouse was more diffuse throughout the animal, consistent with presence in the blood pool (Figure 4).
Figure 4.
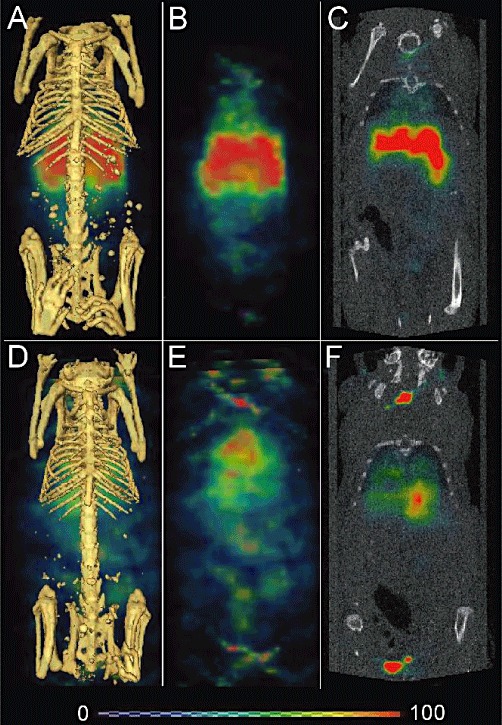
SPECT-CT images of [111In]-DOTA-MNRP1685A (3.69 MBq; 25 µg) and [111In]-DOTA-control antibody dosed mice (4.03 MBq; 27 µg). Twenty-four-hour post-dose reconstructed three-dimensional volume rendered SPECT-CT fusion images of [111In]-DOTA-MNRP1685A (A) and [111In]-DOTA-control antibody (D) respectively (n= 1). False-coloured SPECT images in arbitrary uptake units are fused onto the X-ray CT images. The three-dimensional volume rendered SPECT image without the CT image for [111In]-DOTA-MNRP1685A and [111In]-DOTA-control antibody are shown in panels B and E respectively. The two-dimensional coronal view of SPECT-CT fusion image for [111In]-DOTA-MNRP1685A and [111In]-DOTA-control antibody are shown in panels C and F respectively.
Ex vivo tumour binding
In general, at the 120 h time point, the radioactivity associated with the tumours decreased as the amount of unlabelled antibody dose increased, with tumour binding reaching a plateau at the 10 mg·kg−1 dose (Figure 5). This indicates that saturation of antibody uptake in the tumour was reached with a minimal dose of 10 mg kg−1.
Figure 5.
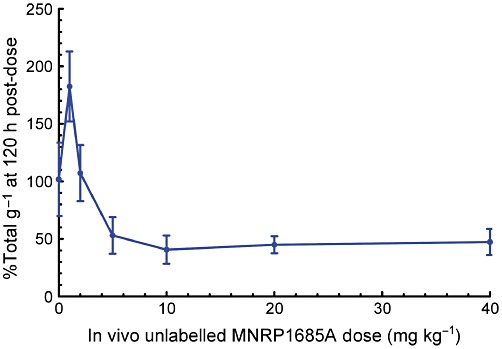
Radioactivity associated with the tumours following ex vivo incubation with [125I]-MNRP1685A. HM7-tumour-bearing mice were given i.v. 0, 1, 2, 5, 10, 20 or 40 mg·kg−1 unlabelled MNRP1685A 120-h before tumour harvest (n= 3). The radioactivity is represented as percentage of total per gram of tissue (%Total·g−1).
Discussion and conclusions
This work assessed the biodistribution of MNRP1685A to understand the relationship between dose, non-tumour tissue uptake and tumour uptake. First, plasma concentrations of MNRP1685A were determined in non-tumour-bearing mice to ascertain the effect, if any, on antibody PK of NRP1 expression in normal tissue. Then, MNRP1685A biodistribution was evaluated in tumour-bearing mice utilizing a fixed radiolabelled antibody dose along with increasing amounts of unlabelled antibody. This competitive binding approach should determine the degree of saturation in each tissue at each dose.
MNRP1685A displayed fast serum clearance in mice compared with that of pertuzumab (Figure 1), an antibody without target-mediated clearance in mice, suggesting that widespread NRP1 expression in non-tumour tissues was likely to affect antibody clearance. Both an ex vivo blood cell binding assay (Table 1) and in vivo whole blood fractionation (Figure 2C) indicated that there was little or no binding of MNRP1685A to either human or mouse blood cells respectively. These data suggest that blood cell binding is not responsible for the apparent fast clearance of the antibody. Furthermore, no evidence of antibody degradation, aggregation or complex formation in plasma was detected by size-exclusion HPLC that could have affected the antibody clearance rate (Figure 2B). However, target-mediated distribution to the lungs, liver and kidneys was likely to contribute, in part, to the rapid plasma clearance of MNRP1685A (Figure 3A). At the tracer dose, 5- to 10-fold less control IgG1 was detected in the liver and lungs, respectively, supporting the specificity of MNRP1685A distribution to these tissues (Figure S1). SPECT-CT imaging also confirmed the specific localization of MNRP1685A in the lungs and liver, in contrast to the more diffuse distribution of the control antibody (Figure 4). Increasing the antibody dose from tracer to 5 mg·kg−1 prompted a marked decrease in radioactivity in the lungs and liver (Figure 3A). A further decrease was noted in the lungs and kidneys as the MNRP1685A dose increased. As target-mediated biodistribution did not account for the fast plasma clearance of the antibody at higher doses of MNRP1685A, further investigation is warranted to determine other contributing factors. As NRP1 is a vascular target expressed in several adult non-tumour tissues (Bielenberg et al., 2006), the lungs and liver appear to be acting as antigenic sinks for MNRP1685A. Given that the lungs, with 235 ± 111 µL blood per gram of tissue, and the liver, with 42.0 ± 7.71 µL·g−1 (Boswell et al., 2010) are much more perfused relative to the tumour (∼20 µL·g−1; in-house data), MNRP1685A would have more opportunity to bind to its target in these well perfused tissues, thereby decreasing observed levels in the tumour. Alternatively, the NRP1 expression level in these tissues may be higher than that of the tumour. Whatever the explanation, a sufficiently high dose of MNRP1685A was required to satisfy the lungs and liver uptake, making the antibody available for tumour uptake. This phenomenon of a normal tissue antigenic sink has previously been observed in non-Hodgkin's lymphoma patients in whom anti-CD20 antibodies cleared quickly from blood at low protein doses due to specific splenic uptake (Kaminski et al., 1993; Press et al., 1993). Higher doses elevated circulating antibody levels, leading to enhanced tumour antibody concentrations. The benefit of utilizing a rodent and primate cross-reactive antibody in our study allowed us to demonstrate this sink effect preclinically and use this information to guide the clinical development of MNRP1685A.
Although normal tissues were identified as antigenic sinks for MNRP1685A, this antibody was well tolerated in preclinical toxicology studies conducted in rat and cynomolgus monkeys, with no gross or microscopic pathology observed after up to nine weekly doses at 100 mg·kg−1 (de Zafra et al., 2010). MNRP1685A was also well tolerated in a phase IA single-agent dose escalation study up to a 30 mg·kg−1 dose every 3 weeks (Weekes et al., 2010). The most frequently reported drug-related adverse events were grade 1 and 2 acute infusion site reactions, which were controlled by premedication with dexamethasone.
The xenograft model used in this analysis, HM7cells, is a model with very low NRP1 expression on tumour epithelial cells, but with vascular endothelial cell expression (Liang et al., 2007), and was chosen precisely for that characteristic as the desired mechanism of action of MNRP1685A is anti-angiogenesis. Initial studies with the antibody indicated that at unlabelled antibody doses lower than 5 mg·kg−1, there was a dose-dependent increase in tumour radioactivity (Figure 3D), and this increase was not simply due to increased blood radioactivity levels but was due to specific binding of the antibody in the tumour, as observed by the high tumour : plasma radioactivity ratios at these lower doses. The tumour : plasma ratio, a specificity ratio relating specific binding in the tumour to unbound antibody in plasma (Fujimori et al., 1989; 1990; Thurber et al., 2008), was calculated with the purpose of comparing the relative tumour exposures at each dose. Conceptually, a plateau in tumour : plasma ratio versus dose indicates that no additional specific binding at higher doses occurred and therefore no additional benefit of those higher doses (Fujimori et al., 1989). Based on the results of the initial study, doses of 5–80 mg·kg−1 were chosen to determine how long this exposure could be maintained as no statistically significant differences in tumour radioactivity levels were observed over time (Figure 3B), probably due to contributions from both receptor-bound and unbound radiolabelled antibody in the tumour interstitium. At 24 h post dose, doses ≥5 mg·kg−1 had similar tumour : plasma ratios; however, doses ≥10 and ≥20 mg·kg−1 had similar tumour : plasma ratios at 48 and 120 h post dose, respectively (Figure 3C), illustrating that different doses maximize specific binding for different lengths of time. Avoiding a change in MNRP1685A tumour : plasma ratio for a given duration requires a dose that not only satisfies uptake in non-tumour antigenic tissue sinks but also overcomes antibody clearance in the tumour during that time period. The 20 mg·kg−1 dose appeared to be the lowest dose that maximized tumour exposure for the 5 day study.
In order to confirm the effect of dose on tumour exposure observed in vivo, an ex vivo tumour binding assay was employed to assess the binding of radiolabelled antibody to unoccupied receptors in the tumour ex vivo, thereby removing the limitations present in the in vivo system. Such limitations in the tumour are the degree of vascularity, permeability of the vessel walls, heterogeneity of blood flow rate, antigen density, interstitial fluid pressure and necrosis (Jain, 1999; Minchinton and Tannock, 2006; Thurber et al., 2008; Tabrizi et al., 2010). Additionally, antibody target binding affinity, molecular charge, molecular weight and PK could further limit penetration of the tumour by the antibody (Fujimori et al., 1989; 1990; Adams et al., 2001; Minchinton and Tannock, 2006; Dennis et al., 2007). There was a dose-dependent decrease in radioactivity in the assay (Figure 5) with maximum exposure reached with the 10 mg·kg−1 dose, indicating that there were fewer unoccupied receptors at the higher doses. This is consistent with the trend observed in vivo. The fact that maximum binding was observed at the 10 mg·kg−1 dose rather than the 20 mg·kg−1 dose is most likely an artefact of the tumour processing, potentially making more receptors available ex vivo than the antibody can reach in vivo.
The characterization of the relationship between tumour uptake and MNRP1685A dose provided additional information for clinical development. It is well established in the field of oncology therapeutics that finding a balance between efficacy and toxicity is crucial for selecting the optimal phase II clinical dose and regimen (Wolf et al., 2004; Jain et al., 2010; Rubin and Anderson, 2010). Traditionally, the phase I maximum tolerated dose (MTD) determines the phase II dose (Jain et al., 2010; Rubin and Anderson, 2010), but this may not necessarily be the best dose. It is possible, especially for targeted therapeutics, that a dose lower than the MTD results in the maximum biological effect, and so dosing at the MTD serves to increase toxicity while not improving efficacy (Wolf et al., 2004; Jain et al., 2010; Rubin and Anderson, 2010). Additionally, it has been suggested that phase II doses should be based on the minimum effective dose (Haines, 2008) or optimum biological dose (Wolf et al., 2004). Theoretically, the dose that maintained saturating levels in the tumour for the desired dosing interval should be the highest dose that would need to be administered, assuming equivalent efficacy at all doses. However, there are challenges in using preclinical data to help predict clinical success, such as potential differences among animals and humans in terms of antibody disposition, tumour growth and/or physiology (Morgan, 2001; Kerbel, 2003; Bleeker et al., 2008). Nevertheless, some positive correlations have been found between preclinical efficacy in xenografts and clinical efficacy in human tumours (Boven et al., 1992; Johnson et al., 2001; Kerbel, 2003; Peterson and Houghton, 2004). As such, understanding antibody absorption, distribution and clearance in a preclinical model aids in predicting the optimal dose and regimen for patients (Morgan, 2001; Bleeker et al., 2008). For instance, Luo and colleagues showed that mouse plasma concentrations of cetuximab were fairly comparable with the concentrations in patients at the dose they identified to be the highest needed to achieve maximum efficacy (Luo et al., 2005). The data from our study was translated into a clinically relevant dose by determining the trough plasma concentration at 5 days and identifying the dose and regimen from the phase I clinical trial that maintains the plasma concentrations (based on inter-species scaling) at or above this level (11 mg·kg−1 every other week or 18 mg·kg−1 every 3 weeks). These results were corroborated with other preclinical and clinical data (data not shown).
In conclusion, this work has demonstrated that widespread expression of NRP1 in non-tumour tissue did limit distribution of MNRP1685A to tumour tissue, in a dose-dependent manner, because of the influence of non-tumour tissue antigenic sinks. The use of a rodent and primate cross-binding antibody allowed for the translation of these findings from the preclinical to clinical setting, indicating that a higher than expected clinical dose would need to be administered to achieve acceptable tumour exposure.
Acknowledgments
The authors would like to thank Michelle Schweiger, Elizabeth Torres, Mike Reiche, Amy Oldendorp, Misia Howell, Kirsten Messick and Noore Kadri for excellent animal studies support; Yanmei Lu for elisa support; Amy Gilbert for help with the PK studies; and Yan Xin and Enzo Palma for helpful discussion.
Glossary
- AUC
area under the antibody serum concentration versus time curve
- CL
clearance
- CPM
counts per minute
- CUB domain
complement C1r/C1s, Uegf, and Bmf1 domain
- DOTA
1,4,7,10-tetraazacyclododecane-N,N′,N′′,N′′′-tetraacetic acid
- ID
injected dose
- MAM domain
Meprin, A5-protein, and protein-tyrosine phosphatase-Mu domain
- MTD
maximum tolerated dose
- NRP1
neuropilin-1
- PK
pharmacokinetics
- SPECT-CT
single photon emission computed tomography – X-ray computed tomography
Conflicts of interest
All authors are employees of Genentech, Inc., a member of the Roche Group, or Roche, and hold financial interest in Roche.
Supporting information
Additional Supporting Information may be found in the online version of this article:
Figure S1 Tissue distribution at 24 h post dose following i.v. administration of [111In]-DOTA-MNRP1685A or [111In]-DOTA-control IgG1 at 7.4 MBq·kg−1 (0.05 mg·kg−1) (n = 4). The radioactivity is represented as percentage of injected dose per gram of tissue (%ID·g−1).
Please note: Wiley-Blackwell are not responsible for the content or functionality of any supporting materials supplied by the authors. Any queries (other than missing material) should be directed to the corresponding author for the article.
References
- Adams CW, Allison DE, Flagella K, Presta L, Clarke J, Dybdal N, et al. Humanization of a recombinant monoclonal antibody to produce a therapeutic HER dimerization inhibitor, pertuzumab. Cancer Immunol Immunother. 2006;55:717–727. doi: 10.1007/s00262-005-0058-x. [DOI] [PMC free article] [PubMed] [Google Scholar]
- Adams GP, Weiner LM. Monoclonal antibody therapy of cancer. Nat Biotechnol. 2005;23:1147–1157. doi: 10.1038/nbt1137. [DOI] [PubMed] [Google Scholar]
- Adams GP, Schier R, McCall AM, Simmons HH, Horak EM, Alpaugh RK, et al. High affinity restricts the localization and tumor penetration of single-chain fv antibody molecules. Cancer Res. 2001;61:4750–4755. [PubMed] [Google Scholar]
- Bagri A, Tessier-Lavigne M, Watts RJ. Neuropilins in tumor biology. Clin Cancer Res. 2009;15:1860–1864. doi: 10.1158/1078-0432.CCR-08-0563. [DOI] [PubMed] [Google Scholar]
- Baxter LT, Zhu H, Mackensen DG, Butler WF, Jain RK. Biodistribution of monoclonal antibodies: scale-up from mouse to human using a physiologically based pharmacokinetic model. Cancer Res. 1995;55:4611–4622. [PubMed] [Google Scholar]
- Bielenberg DR, Pettaway CA, Takashima S, Klagsbrun M. Neuropilins in neoplasms: expression, regulation, and function. Exp Cell Res. 2006;312:584–593. doi: 10.1016/j.yexcr.2005.11.024. [DOI] [PubMed] [Google Scholar]
- Bleeker WK, Munk ME, Mackus WJ, van den Brakel JH, Pluyter M, Glennie MJ, et al. Estimation of dose requirements for sustained in vivo activity of a therapeutic human anti-CD20 antibody. Br J Haematol. 2008;140:303–312. doi: 10.1111/j.1365-2141.2007.06916.x. [DOI] [PubMed] [Google Scholar]
- Boswell CA, Ferl GZ, Mundo EE, Schweiger MG, Marik J, Reich MP, et al. Development and evaluation of a novel method for preclinical measurement of tissue vascular volume. Mol Pharm. 2010;7:1848–1857. doi: 10.1021/mp100183k. [DOI] [PubMed] [Google Scholar]
- Boven E, Winograd B, Berger DP, Dumont P, Braakhuis B, Fodstad O, et al. Phase II preclinical drug screening in human xenografts: a first European multicenter collaborative study. Cancer Res. 1992;52:5940–5947. [PubMed] [Google Scholar]
- Buchsbaum DJ, Zhou T, Grizzle WE, Oliver PG, Hammond CJ, Zhang S, et al. Antitumor efficacy of TRA-8 anti-DR5 monoclonal antibody alone or in combination with chemotherapy and/or radiation therapy in a human breast cancer model. Clin Cancer Res. 2003;9(10 Pt 1):3731–3741. [PubMed] [Google Scholar]
- Bumbaca D, Wong A, Drake E, Reyes AE, 2nd, Lin BC, Stephan JP, et al. Highly specific off-target binding identified and eliminated during the humanization of an antibody against FGF receptor 4. MAbs. 2011;3:376–386. doi: 10.4161/mabs.3.4.15786. [DOI] [PMC free article] [PubMed] [Google Scholar]
- Chizzonite R, Truitt T, Podlaski FJ, Wolitzky AG, Quinn PM, Nunes P, et al. IL-12: monoclonal antibodies specific for the 40-kDa subunit block receptor binding and biologic activity on activated human lymphoblasts. J Immunol. 1991;147:1548–1556. [PubMed] [Google Scholar]
- Dennis MS, Jin H, Dugger D, Yang R, McFarland L, Ogasawara A, et al. Imaging tumors with an albumin-binding Fab, a novel tumor-targeting agent. Cancer Res. 2007;67:254–261. doi: 10.1158/0008-5472.CAN-06-2531. [DOI] [PubMed] [Google Scholar]
- Ferrara N, Hillan KJ, Gerber HP, Novotny W. Discovery and development of bevacizumab, an anti-VEGF antibody for treating cancer. Nat Rev Drug Discov. 2004;3:391–400. doi: 10.1038/nrd1381. [DOI] [PubMed] [Google Scholar]
- Fujimori K, Covell DG, Fletcher JE, Weinstein JN. Modeling analysis of the global and microscopic distribution of immunoglobulin G, F(ab')2, and Fab in tumors. Cancer Res. 1989;49:5656–5663. [PubMed] [Google Scholar]
- Fujimori K, Covell DG, Fletcher JE, Weinstein JN. A modeling analysis of monoclonal antibody percolation through tumors: a binding-site barrier. J Nucl Med. 1990;31:1191–1198. [PubMed] [Google Scholar]
- Haines IE. Dose selection in phase I studies: why we should always go for the most effective. J Clin Oncol. 2008;26:3650–3652. doi: 10.1200/JCO.2008.17.6719. author reply 3652–3653. [DOI] [PubMed] [Google Scholar]
- Herbst RS, Kim ES, Harari PM. IMC-C225, an anti-epidermal growth factor receptor monoclonal antibody, for treatment of head and neck cancer. Expert Opin Biol Ther. 2001;1:719–732. doi: 10.1517/14712598.1.4.719. [DOI] [PubMed] [Google Scholar]
- Jain RK. Transport of molecules, particles, and cells in solid tumors. Annu Rev Biomed Eng. 1999;1:241–263. doi: 10.1146/annurev.bioeng.1.1.241. [DOI] [PubMed] [Google Scholar]
- Jain RK, Lee JJ, Hong D, Markman M, Gong J, Naing A, et al. Phase I oncology studies: evidence that in the era of targeted therapies patients on lower doses do not fare worse. Clin Cancer Res. 2010;16:1289–1297. doi: 10.1158/1078-0432.CCR-09-2684. [DOI] [PMC free article] [PubMed] [Google Scholar]
- Johnson JI, Decker S, Zaharevitz D, Rubinstein LV, Venditti JM, Schepartz S, et al. Relationships between drug activity in NCI preclinical in vitro and in vivo models and early clinical trials. Br J Cancer. 2001;84:1424–1431. doi: 10.1054/bjoc.2001.1796. [DOI] [PMC free article] [PubMed] [Google Scholar]
- Kaminski MS, Zasadny KR, Francis IR, Milik AW, Ross CW, Moon SD, et al. Radioimmunotherapy of B-cell lymphoma with [131I]anti-B1 (anti-CD20) antibody. N Engl J Med. 1993;329:459–465. doi: 10.1056/NEJM199308123290703. [DOI] [PubMed] [Google Scholar]
- Kerbel RS. Human tumor xenografts as predictive preclinical models for anticancer drug activity in humans: better than commonly perceived-but they can be improved. Cancer Biol Ther. 2003;2(4 Suppl.1):S134–S139. [PubMed] [Google Scholar]
- Lammerts van Bueren JJ, Bleeker WK, Bogh HO, Houtkamp M, Schuurman J, van de Winkel JG, et al. Effect of target dynamics on pharmacokinetics of a novel therapeutic antibody against the epidermal growth factor receptor: implications for the mechanisms of action. Cancer Res. 2006;66:7630–7638. doi: 10.1158/0008-5472.CAN-05-4010. [DOI] [PubMed] [Google Scholar]
- Liang WC, Dennis MS, Stawicki S, Chanthery Y, Pan Q, Chen Y, et al. Function blocking antibodies to neuropilin-1 generated from a designed human synthetic antibody phage library. J Mol Biol. 2007;366:815–829. doi: 10.1016/j.jmb.2006.11.021. [DOI] [PubMed] [Google Scholar]
- Lobo ED, Hansen RJ, Balthasar JP. Antibody pharmacokinetics and pharmacodynamics. J Pharm Sci. 2004;93:2645–2668. doi: 10.1002/jps.20178. [DOI] [PubMed] [Google Scholar]
- Luo FR, Yang Z, Dong H, Camuso A, McGlinchey K, Fager K, et al. Correlation of pharmacokinetics with the antitumor activity of Cetuximab in nude mice bearing the GEO human colon carcinoma xenograft. Cancer Chemother Pharmacol. 2005;56:455–464. doi: 10.1007/s00280-005-1022-3. [DOI] [PubMed] [Google Scholar]
- Mamluk R, Gechtman Z, Kutcher ME, Gasiunas N, Gallagher J, Klagsbrun M. Neuropilin-1 binds vascular endothelial growth factor 165, placenta growth factor-2, and heparin via its b1b2 domain. J Biol Chem. 2002;277:24818–24825. doi: 10.1074/jbc.M200730200. [DOI] [PubMed] [Google Scholar]
- Minchinton AI, Tannock IF. Drug penetration in solid tumours. Nat Rev Cancer. 2006;6:583–592. doi: 10.1038/nrc1893. [DOI] [PubMed] [Google Scholar]
- Morgan P. The use of preclinical pharmacokinetic and pharmacodynamic data to predict clinical doses: current and future perspectives. Int Congr Ser. 2001;1220:1–12. [Google Scholar]
- Pan Q, Chanthery Y, Liang WC, Stawicki S, Mak J, Rathore N, et al. Blocking neuropilin-1 function has an additive effect with anti-VEGF to inhibit tumor growth. Cancer Cell. 2007;11:53–67. doi: 10.1016/j.ccr.2006.10.018. [DOI] [PubMed] [Google Scholar]
- Peterson JK, Houghton PJ. Integrating pharmacology and in vivo cancer models in preclinical and clinical drug development. Eur J Cancer. 2004;40:837–844. doi: 10.1016/j.ejca.2004.01.003. [DOI] [PubMed] [Google Scholar]
- Press OW, Eary JF, Appelbaum FR, Martin PJ, Badger CC, Nelp WB, et al. Radiolabeled-antibody therapy of B-cell lymphoma with autologous bone marrow support. N Engl J Med. 1993;329:1219–1224. doi: 10.1056/NEJM199310213291702. [DOI] [PubMed] [Google Scholar]
- Rubin EH, Anderson KM. Finding the right dose for cancer therapeutics–can we do better? Clin Cancer Res. 2010;16:1085–1087. doi: 10.1158/1078-0432.CCR-09-3246. [DOI] [PubMed] [Google Scholar]
- Sliwkowski MX, Lofgren JA, Lewis GD, Hotaling TE, Fendly BM, Fox JA. Nonclinical studies addressing the mechanism of action of trastuzumab (Herceptin) Semin Oncol. 1999;26(4 Suppl.12):60–70. [PubMed] [Google Scholar]
- Soker S, Takashima S, Miao HQ, Neufeld G, Klagsbrun M. Neuropilin-1 is expressed by endothelial and tumor cells as an isoform-specific receptor for vascular endothelial growth factor. Cell. 1998;92:735–745. doi: 10.1016/s0092-8674(00)81402-6. [DOI] [PubMed] [Google Scholar]
- Tabrizi M, Bornstein GG, Suria H. Biodistribution mechanisms of therapeutic monoclonal antibodies in health and disease. AAPS J. 2010;12:33–43. doi: 10.1208/s12248-009-9157-5. [DOI] [PMC free article] [PubMed] [Google Scholar]
- Thurber GM, Schmidt MM, Wittrup KD. Factors determining antibody distribution in tumors. Trends Pharmacol Sci. 2008;29:57–61. doi: 10.1016/j.tips.2007.11.004. [DOI] [PMC free article] [PubMed] [Google Scholar]
- Weekes CD, Hedge P, Xin Y, Yu R, Xiang H, Beeram M, et al. A first-in-human phase I study to evaluate the fully human monoclonal antibody MNRP1685A (anti-NRP1) administered intravenously every three weeks in patients with advanced solid tumors (Abstract) 2010. 2010 ASCO Annual Meeting, Chicago, IL. J Clin Oncol 28: 15s, 2010 (Suppl.; abstr 3014)
- Wolf M, Swaisland H, Averbuch S. Development of the novel biologically targeted anticancer agent gefitinib: determining the optimum dose for clinical efficacy. Clin Cancer Res. 2004;10:4607–4613. doi: 10.1158/1078-0432.CCR-04-0058. [DOI] [PubMed] [Google Scholar]
- de Zafra CLZ, Allamneni K, Kennedy D, Cain G, Xiang H, Auyeung-Kim DL, et al. Nonclinical toxicology evaluation of a monoclonal antibody against the VEGF co-receptor neuropilin-1 (Abstract) 2010. 49th Annual Meeting of the Society of Toxicology; Salt Lake City, UT. Toxicologist 2010.
Associated Data
This section collects any data citations, data availability statements, or supplementary materials included in this article.