

Abstract
Directionality in populations of replicating organisms can be parametrized in terms of a statistical concept: evolutionary entropy. This parameter, a measure of the variability in the age of reproducing individuals in a population, is isometric with the macroscopic variable body size. Evolutionary trends in entropy due to mutation and natural selection fall into patterns modulated by ecological and demographic constraints, which are delineated as follows: (i) density-dependent conditions (a unidirectional increase in evolutionary entropy), and (ii) density-independent conditions, (a) slow exponential growth (an increase in entropy); (b) rapid exponential growth, low degree of iteroparity (a decrease in entropy); and (c) rapid exponential growth, high degree of iteroparity (random, nondirectional change in entropy). Directionality in aggregates of inanimate matter can be parametrized in terms of the statistical concept, thermodynamic entropy, a measure of disorder. Directional trends in entropy in aggregates of matter fall into patterns determined by the nature of the adiabatic constraints, which are characterized as follows: (i) irreversible processes (an increase in thermodynamic entropy) and (ii) reversible processes (a constant value for entropy). This article analyzes the relation between the concepts that underlie the directionality principles in evolutionary biology and physical systems. For models of cellular populations, an analytic relation is derived between generation time, the average length of the cell cycle, and temperature. This correspondence between generation time, an evolutionary parameter, and temperature, a thermodynamic variable, is exploited to show that the increase in evolutionary entropy that characterizes population processes under density-dependent conditions represents a nonequilibrium analogue of the second law of thermodynamics.
The latter half of the 19th century witnessed in both physics and biology the emergence of a new paradigm—a mechanistic analysis of macroscopic behavior. In physics, the new viewpoint was advanced by Boltzmann who proposed a mechanistic model of macroscopic phenomena based on the radically new notion of molecular heterogeneity: the molecules in any large sample of inanimate matter differ in terms of their energy levels. In biology, the revolution was inspired by Darwin who developed a mechanistic explanation of evolutionary trends based on the analogous notion of organismic heterogeneity: the individuals in any large population of replicating organisms differ in terms of their fecundity and mortality.
The theories of Boltzmann (1), and Darwin (2) each invoke these equivalent notions of heterogeneity: the former, with its basis in quantum mechanics; the latter, with its basis in developmental biology, to provide an account of time asymmetric behavior of inanimate and living matter in terms of interactions at elementary levels—molecular and organismic, respectively. The two theories, however, embody different conceptual and analytical structures that reflect the profound rift that existed in the mathematical development of physics and biology at that time.
Boltzmann’s work, set in the strong mathematical tradition of 19th century physics, drew from this heritage to express the qualitative property of molecular heterogeneity in terms of a statistical measure called entropy. This concept has two equivalent expressions; the first, introduced by Boltzmann, and given by
 |
1 |
where W denotes the number of energy levels available to the system at a given temperature, and k the Boltzmann constant. The second, introduced by Gibbs, is given by
 |
2 |
where pi denotes the probability that a randomly chosen particle is in the energy state (i).
Macroscopic behavior of inanimate matter can now be understood in terms of the temporal changes of a well-defined analytic function of the microscopic states. Boltzmann’s theory is in essence a quantitative theory that gives a mechanistic explanation of the evolution of macroscopic behavior in physical systems.
Thermodynamic theory distinguishes between adiabatic processes according to the magnitude of their relaxation time—that is, the time it takes the system to reach its equilibrium state: processes in which the reactions proceed rapidly relative to the relaxation time are called irreversible; whereas processes that occur in times long compared with the relaxation time are called reversible. This distinction between irreversible and reversible processes is central in the two fundamental tenets of the theory: A(1) irreversible adiabatic processes (a unidirectional increase in entropy) and A(2) reversible adiabatic processes (a constant value for entropy).
The coherence and logical completeness of statistical thermodynamics, as developed in the works of Gibbs and Boltzmann, derives in large measure from the fact that molecular heterogeneity—one of its basic elements—is a purely geometric concept that could be analytically expressed within the mathematical framework of 19th century physics.
Darwin’s theory, by contrast, was developed within the naturalistic tradition of 19th century biology; a tradition that was close to its empirical roots and devoid of any mathematical constructs. The theory of evolution by natural selection, in sharp contrast to statistical thermodynamics, is in essence a qualitative theory, which provides a conceptual rather than an analytic framework for understanding evolutionary dynamics in populations of living organisms.
The issue of developing an analytical theory of evolution comparable in explanatory power to the Boltzmann theory gradually emerged with the rediscovery of Mendel’s laws of inheritance in 1910, as a important topic in evolutionary studies. Fisher’s “Genetical Theory of Natural Selection” (3) represents the first mathematical synthesis of Darwin’s theory and the Mendelian laws and provided the dominant paradigm for subsequent analytical studies of evolutionary processes. The cornerstone of this work is embodied in the “fundamental theorem of natural selection,” which asserts: The rate of increase in the mean fitness at any time of any organism is equal to its genetic variance in fitness.
It is now generally conceded that Fisher’s theorem and its manifold extensions bear no consequence on understanding macroevolutionary changes such as adaptation and extinction (4–6). The fundamental theorem, and a large body of work in classical population genetics (7–9), is concerned primarily with changes in gene frequencies within a population due to differential viability of the genotypes. The concept mean fitness, a keystone of the Fisherian theory, describes the average viability of the genotypes, a property that need not be related to persistence or stability of the population. Such properties are in no sense determined by mean viability, but have now been shown to be functions of demographic variability, the heterogeneity in fecundity and mortality of individuals in the population (10–12).
Demographic variability has its origin in the processes that underlie the ontogeny of the individual. In cellular systems, it results from the random inequalities between cells, such as unequal distribution of metabolic components, which occur at cell division. In multicellular and higher organisms, demographic variability now derives from the small variations in the sequence of developmental events that transform the zygote into an adult. Accordingly, any genetically homogeneous population of organisms will be characterized by demographic heterogeneity, a condition that much be considered in any theory which purports to explain the persistence and stability of populations under different environmental conditions.
Variability in net-reproductive rates in a population of replicating organisms, in sharp contrast to the variability in energy levels in an aggregate of inanimate matter, has a dynamic rather than a purely geometric character. The Boltzmann entropy and the related concept due to Gibbs are essentially measures of geometric complexity, and as such, are unable to represent the dynamic nature of heterogeneity inherent in biopopulations.
A dynamical notion of entropy, a far reaching generalization of the indices due to Boltzmann and Gibbs was introduced in the context of ergodic theory by Kolmogorov and Sinai in 1950 (see ref. 13). Ergodic theory studies the statistical properties of mechanical systems in terms of an abstract mathematical object called a measure preserving transformation of a measure space (13).
This mathematical object is characterized by a mapping that assigns to each point in the measure space another point in a one-to-one, onto, way, so that each measurable set is transformed onto a measurable set of the same measure. The metric or dynamical entropy associates with this abstract dynamical system, a number that reflects the degree to which the mapping disorganizes the measure space. Two measure preserving transformations are said to be isomorphic if we can find a one-to-one correspondence between all (but a set of measure 0) of the points in each measure space, so that corresponding sets have the same measure, and corresponding points are transformed in the same way. The metric entropy constitutes an isomorphism invariant of measure preserving transformations and consequently it reflects a fundamental statistical property of the dynamical system.
The work initiated in Demetrius (14) exploited this isomorphism invariant of measure preserving transformations to provide a mathematical model of the heterogeneity in birth and death rates that characterizes biopopulations. In later studies, this model was exploited to develop an evolutionary analogue of the Boltzmann theory.
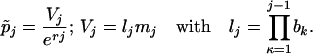
Individual birth and death rates are a function of the physiological state of the organism—a property that can be parametrized by metabolic energy, size, or age. Of these three variables, age constitutes the most accessible and reliable index of physiological condition. Accordingly, in the population models we consider, the state of an individual in a population will be parametrized in terms of its age.
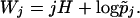
Evolutionary entropy H, derived by computing the Kolmogorov–Sinai invariant for a particular measure-preserving transformation associated with an age-dependent population process (14), is given by H = S̃/T̃, where
 |
3 |
Here p̃j now denotes the probability that the ancestor of a randomly chosen newborn is in age-class j.
The expression S̃, which we will also call evolutionary entropy (the reference to the nondimensional quantity S̃ and the dimensional variable H will be clear from the context) is a measure of the variability in the age of reproduction. The function T̃ denotes the generation time, the mean age of parents at the birth of their offspring. Evolutionary entropy, H, which has the dimension of inverse time, is a measure of population stability (10, 11, 15)—that is, the rate of decay of fluctuations in population numbers due to small variations in the individual birth and death rates.
The mathematical theory of evolutionary dynamics developed in refs. 16–20 considers evolution as a dual process. The first phase, which acts on a short time scale, consists of the production of genetic variability through mutation. The second phase, which proceeds on a much longer time scale, refers to natural selection, which induces changes in the frequency of the ancestral and mutant types due to differences in their net-reproductive rates. Our model thus considers a population at demographic equilibrium, defined by an entropy H. Mutation introduces new types and thus perturbs the equilibrium state. The selective interaction between the ancestral and mutant types drives the combined population to some new equilibrium state with entropy H′. We are concerned with the global change in entropy, Δ̃H = H′ − H, as the population moves from one equilibrium state to the next.
A central point in our analysis of this model is a classification of populations based on ecological and demographic constraints. Ecological conditions impose constraints on population growth. We distinguish between density-dependent growth, in which individual net-reproductive rates are decreasing functions of density; and density-independent growth, where no such constraints prevail. Under density-dependent constraints, the equilibrium state, defined by a stable age distribution, will be characterized by a constant population size. Under density-independence, the equilibrium state will now be characterized by exponential increase in population numbers. Populations subject to density-independent conditions may be further classified according to the relation between (i) the relaxation time—that is, the recovery time after a random perturbation of the age-distribution, and (ii) the generation time. Growth rate is said to be slow if the generation time exceeds the relaxation time; fast, if the generation time is inferior to the relaxation time.
Demographic properties impose constraints on the shape of the net-reproductive function. We distinguish between low iteroparity, with reproduction concentrated at either the earlier or the later stages in the life cycle, and high iteroparity with reproduction distributed over most stages of the life cycle.
These distinctions based on ecological and demographic constraints provide a characterization of trends in evolutionary entropy as one population replaces another under the dual forces of mutation and selection. The following relations were derived between the demographic–ecological constraints and trends in evolutionary entropy (17, 20): B(1) Density-dependent condition (a unidirectional increase in entropy) and B(2) density-independent condition: (i) slow exponential growth (a unidirectional increase in entropy); (ii) rapid exponential growth, low iteroparity (decrease in entropy); and (iii) rapid exponential growth, high iteroparity (random, nondirectional change in entropy).
We should emphasize at this juncture that the directionality theorems expressed in B(1) and B(2) are different in character from Fisher’s theorem. Fisher is concerned with changes within populations of average fitness properties, fitness being measured by viability, an individual property. Evolution, in these models, is considered as due to a single process, natural selection. The “fundamental” theorem is a statement about variations in mean viability as gene frequencies in the population change due to differences in viability of the genotypes. The directionality theorems, by constrast, describe changes between populations of average fitness properties, fitness now being measured by entropy, a population property. Evolution in these models is now considered a dual process: mutation and natural selection. Entropy is defined at demographic equilibrium. The directionality theorems are statements that pertain to global changes in entropy, as mutation perturbs the equilibrium state and selection drives the perturbed population to a new equilibrium state.
Evolutionary entropy is a measure of both the complexity of the life cycle as described by the variability in age of reproduction, and population stability as measured by the decay rate of fluctuations in population numbers due to perturbations in individual net-reproductive rates. The theory predicts: (i) an increase in complexity and stability under conditions of stationary or slow population growth, (ii) a decrease in complexity and stability under conditions of rapid exponential growth and a low degree of iteroparity, and (iii) random, nondirectional changes in complexity and demographic stability under the conditions of rapid exponential growth and a high degree of iteroparity.
This article has three main aims. First, I provide an account of the main ideas that underlie the statistical mechanics formalism and its application to evolutionary dynamics. Second, I consider an energetics-life history population model and show that the entropy S̃ defined by Eq. 3 is isometric to the macroscopic variable, body size,
 |
4 |
where a denotes a constant. I then exploit the scaling relation (Eq. 4) to predict evolutionary trends in body size under different ecological constraints. Finally, I restrict this analysis to cellular populations and invoke a phenomenological model to derive an analytic relation between generation time T̃, the mean cycle time of replicating cells, and temperature T, namely,
 |
5 |
Here h is Planck’s constant; k, Boltzmann’s constant; and ρ = exp(−ΔF#/RT), where ΔF# is an effective free energy of activation and R the gas constant. The constant c is a function of the concentration of the cellular reactants, enzymes, and substrates. We use this relation between the evolutionary parameter, generation time, and the thermodynamic variable, temperature, to show that the increase in evolutionary entropy under stationary growth constraints represents a nonequilibrium analogue of the Second Law of Thermodynamics.
Efforts to elucidate a connection between thermodynamic processes and evolutionary dynamics have generated a large literature (see, for example, refs. 21–24). The models proposed in these works are largely based on a phenomenological thermodynamic theory. These studies stand in sharp contrast to the ergodic theory and statistical mechanics methods integrated in the work reviewed in this article.
Intrinsic Heterogeneity in Replicating Organisms
Heterogeneity in birth and death rates is a fundamental property of replicating organisms. It has its origins in the instability of the ontogenetic process: the small variation in timing and in the sequence of development events that translate the genetic program into the adult state. This instability entails that any genetically homogeneous population of organisms will be characterized by variability in their phenotypic states—size, age, metabolic energy—and hence variability in terms of their demographic properties.
This inherent heterogeneity can be formally expressed in terms of the concept evolutionary entropy, denoted H. The population process which the parameter H characterizes is described by the graph given in Fig. 1.
Figure 1.

The life cycle of a population.
Each node in the graph corresponds to an age-class. The transition (i) → (i + 1) represents the aging process, the transition (i) → (1) describes the reproduction process. The weights (bi) describes the probability that an individual in state (i) survives to state (i + 1). The weights (mi) represents the mean number of newborns produced by an individual in state (i).
The mathematical properties of H, and its significance as a measure of the complexity of the life cycle and population stability, can be elucidated by showing that H is in effect the dynamical entropy of the measure preserving transformation associated with the population process that is described by the graph in Fig. 1. The concept of a genealogy provides a basis for making this connection explicit.
Genealogies and Evolutionary Entropy.
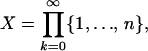
A path, denoted x, of the life cycle graph described in Fig. 1, can be represented by
 |
where xi belongs to the set of integers (1, 2, … n). Such a path is called a genealogy as it represents a recording of successive ancestors of a particular individual which at time 0 is in age class x0.
The set of all genealogies, denoted Ω, represents the set of all paths x of the life cycle graph. Consider the transformation τ:Ω → Ω, which shifts each sequence of descendants one step, and defined by (τx)k = xk+1. The steady state of the population can be described in terms of a Markov probability measure μ, which is invariant with respect to the transformation τ. We can therefore consider the abstract dynamical system (Ω,μ,τ), as completely describing the population process at steady state.
The dynamical or metric entropy of the abstract dynamical system (Ω,μ,τ) can be defined as follows (13). Consider a partition α = {A1, A2, … , An} of Ω into finite measurable sets. The entropy of the partition is defined by H(α) = −Σμ(Ai)logμ(Ai). The entropy of the transformation τ with respect to the partition α is
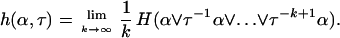 |
The quantity h(α,τ) is a measure of the uncertainty per unit time we have about which element of the partition α the genealogy x will enter (as it is moved by τ) given its preceding history. The metric entropy Hμ(τ) is defined to be the maximal uncertainty over all the finite state processes associated with τ:
 |
Now in the case of the population process described by the graph in Fig. 1, μ is a Markov measure. The quantity Hμ(τ), which can now be explicitly computed, becomes (14),
 |
where pij denotes the probability that an individual in age-class (i) at time t is transformed into an individual in age-class (j) at time t + 1, and π = (πi) denote the stationary distribution of the Markov matrix P = (pij). On account of the special structure of the graph given by Fig. 1, we now obtain, (14),
 |
where p̃j, which is now a function of mj and bj, is the probability that a randomly chosen newborn is in age-class (j).
We observe that the above expression for the metric entropy Hμ(τ) is precisely the evolutionary entropy H defined by Eq. 3.
The Population Dynamics
The dynamical system that describes the population process, characterized by the graph in Fig. 1, can be represented in terms of changes in the vector ū(t) = [u1(t), u2(t), … , un(t)], where ui(t) denotes the number of individuals in age-class (i) at time t.
The changes in the age-distribution are given by
 |
6 |
where A(t) is the Leslie population matrix with age-specific fecundity rates (mj) in the top row, age-specific survival probabilities (bj) along the subdiagonal, and zero elsewhere.
In models where birth rates and death rates are independent of density (mj) and (bj) are constants. In density-dependent models, the quantities are functions of total population numbers.
It is known that when certain natural demographic conditions on the age-specific fecundity and mortality rates obtain (14, 17), the system represented by Eq. 6 will converge to a steady state described by a stable age-distribution, with a population growth rate r = 0, when the birth and death rates are density-dependent, and r > 0, when the density-independent conditions prevail.
Statistical Mechanics of Populations.
The dynamical system (Eq. 6) describes the trajectory of the age-distribution of the population. The statistical mechanics model, as developed in ref. 16, is concerned with the genealogical history of living individuals in the population. To analyze this history we consider the steady state of the process defined by Eq. 6. At steady state, the age-specific fecundity and mortality is now determined by the matrix à = (ãij), whose elements are now time-independent. We use this matrix defined at steady state, to determine a new configuration space as follows. Let
 |
 |
The set ΩÃ represents the genealogies generated by the birth and death process. The phase space ΩÃ coincides with Ω, the set of all paths x of the life cycle graph given in Fig. 1 (14).
Let M denote the set of all τ-invariant probability measures on Ω, and let Hμ(τ) denote the metric entropy for the shift τ with respect to μ ∈ M.
By invoking the thermodynamic formalism described in ref. 25, it was shown in ref. 16 that the asymptotic growth rate r, defined at the stable age distribution, satisfies a variational principle that is formally analogous to the minimization of the free energy in statistical mechanics. We write
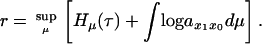 |
7 |
Also, we have that the supremum in Eq. 7 is obtained at a unique μ which we denote by μ̂. We write
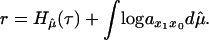 |
8 |
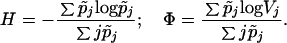
The probability measure μ̂ can be explicitly described in terms of the elements of the stochastic matrix p = (pij) obtained by the canonical normalization of the population matrix à = (ãij). The two terms which constitute the above sum can be explicitly computed. These two expressions which we call, evolutionary entropy H, and the reproductive potential Φ, are given, in the case of the density-independent models, by
 |
9 |
where
 |
The expression (Eq. 8) now assumes the form
 |
10 |
Demographic Parameters.
The quantity r describes the rate of increase in total population numbers for the system whose dynamic is represented by the matrix à = (ãij). We can derive a new family of demographic variables by considering the Taylor expansion of the function r(δ) associated with the matrix Ã(δ) = (ãij)1+δ.
We have (ref. 11)
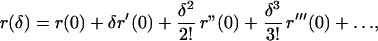 |
where r′(0) ≡ Φ, r"(0) ≡ σ2, r‴(0) ≡ κ. The function Φ is given by Eq. 9, σ2 and κ are given by Eqs. 11 and 12, respectively.
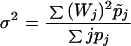 |
11 |
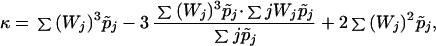 |
12 |
where
 |
The quantities r and σ2 will be shown to determine conditions for the invasion-extinction of new mutants. The parameters Φ and γ, where γ is given by γ = κ + 2σ2 will play an important role in our classification of populations according to ecological and demographic constraints.
The parameter Φ provides a means of classifying populations in terms of the magnitude of their growth rate. We observe from Eq. 10 that Φ = r − H. Hence Φ < 0 ⇒ r < H; Φ > 0 ⇒ r > H. Thus the condition Φ < 0 implies a slowly growing population, whereas the relation Φ > 0 corresponds to a rapidly increasing population.
The function σ2 is called the demographic variance; it describes the variance in the age of parents at the birth of their offspring. The parameter γ is a measure of the skewness of the net-fecundity distribution and thus constitutes an index of the degree of iteroparity: the condition γ < 0 describes a population whose reproductive activity is concentrated at either the earlier or the later stages of the life cycle, whereas γ > 0 represents a population whose reproductive activity is distributed over the complete life cycle of the organism (20).
The Evolutionary Dynamics
Biological evolution—the change in diversity and adaptation of populations over time—involves two complimentary processes: mutation and selection. Mutation generates genetic variability. Selection orders this variability through competition between the ancestral and mutant types. The unfolding of these two processes can be analytically described in terms of the formalism introduced in the previous section.
The Mutation Event.
A mutation consists of a genetic change, an alteration which will induce changes in the life-history characteristics of the individuals who carry the mutant gene.
The mathematical model that describes the dynamical consequences of the mutation event assumes that the ancestral population is described in terms of the abstract dynamical system (Ω,μ̂,τ), and the potential function ϕ on the phase space Ω, given by ϕ(x) = logãx1x0 (see refs. 11 and 14). A mutation is analytically represented by a perturbation of ϕ giving rise to a new potential function ϕ*, where ϕ* = ϕ + δψ. The magnitude δ of the perturbation is assumed small and the potential functions ϕ and ψ are assumed to satisfy the condition ∫ϕdμ = ∫ψdμ. The biological basis for this requirement is discussed in ref. 11.
Let Δr, ΔH, and Δσ2 denote the changes in the demographic variables induced by the mutation event. We have shown (see refs. 11 and 20) that for small absolute values of δ the following relations hold
 |
Since σ2 > 0, these expressions entail the following series of implications that I call the mutation relations
 |
13a |
 |
13b |
I can assert from Eq. 13a that the changes Δr and ΔH are positively correlated when growth is stationary or slow, (Φ < 0); and negatively correlated when growth is rapid (Φ > 0). The implications (Eq. 13b) can be interpreted in terms of the demographic constraints that characterize the population: the changes ΔH and Δσ2 are positively correlated when life history is weakly iteroparous (γ < 0); and negatively correlated when the life cycle is highly iteroparous (γ > 0).
Invasion–Extinction.
The invasion–extinction dynamics of the mutant gene, that is, its ultimate establishment in the population, is analyzed in terms of a stochastic model (20). The ideas we exploit go back to Feller (26) who provided a general review of diffusion processes in genetics. Subsequent developments analogous to the work described here include, among others, the work of Gillespie (27), Karlin (28), and Kimura (29). Parameters analogous to our notion of demographic variance appear in all these models, see in particular (27) where diffusion equations analogous to Eq. 14 were derived. These models, however, are concerned with populations described by nonoverlapping generations and do not address the phenomenon of demographic heterogeneity which characterizes this study.
My model appeals to the ergodic theorems established in Eq. 16 to study the dynamics of mutant and ancestral population when the mutant is rare, that is N*(t) ≪ N(t), where N*(t) and N(t) denote the population size of the mutant and ancestral type, respectively. The stochasticity in the invasion process derives from chance fluctuations, which are modelled by a white noise process, in the age-specific birth and death rates. The probability density ψ(p, t) of the stochastic process which describes the change in frequency of the mutant, denoted p, as a function of time t, was shown (see ref. 20) to satisfy the equation
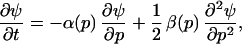 |
14 |
where
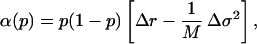 |
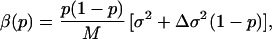 |
and M denotes the total population size. New mutants are assumed to be initially rare, and the invasion is assumed to occur on a sufficiently small time scale that the total population numbers M during the invasion process can be considered constant.
The analysis of Eq. 14 shows that the selective advantage, s, the parameter that describes the invasion and extinction of a mutant, is given by (20),
 |
15 |
This expression for the selective advantage enables us to characterize the invasion–extinction criteria in terms of the quantities Δr and Δσ2.
In view of the relations given by Eq. 13, and the expression (Eq. 15) for the selective advantage, we can now express the invasion–extinction dynamics of the mutants in terms of conditions on the functions Φ and γ.
We distinguish between the following situations: A(1). Φ < 0, γ > 0: Mutants with increased entropy will invade the population almost always, mutants with decreased entropy will become extinct. A(2). Φ < 0, γ < 0: Mutants with increased entropy will invade the population with a probability that is an increasing function of population size. Mutants with decreased entropy will invade the population with a probability that is a decreasing function of size. A(3). Φ > 0, γ < 0: Mutants with decreased entropy will invade the population almost always, mutants with increased entropy will become extinct. A(4). Φ > 0, γ > 0: Mutants with increased entropy will invade the population with a probability that is a decreasing function of population size. Mutants with decreased entropy will invade the population with a probability that is an increasing function of size.
We have observed in ref. 20 that the special structure of the Leslie model imposes constraints on the function Φ and γ such that the condition Φ < 0, γ < 0 is rarely realized. Hence for the demographic models described by Eq. 6, we have that, when Φ < 0 holds, the condition γ > 0 obtains. This implies that the invasion-extinction dynamics in natural populations will be described completely by the states A(1), A(3), and A(4).
The Dynamics of Selection.
The mutation event introduces new genotypes X2 into the population. These new types will mate with the ancestral type X1, according to the Mendelian laws, to generate new types, denoted X3. During the selection process, which proceeds on a time scale that is much longer than the invasion process, ecological factors will regulate the population dynamics and the numbers of the three genotypes will vary in response to the ecological effects. This process can be described in terms of the interaction between the three dynamical systems induced by the genotypes X1, X2, and X3 (17, 18). As shown in ref. 18, this coupled dynamical system will converge to a new steady state described by a new entropy.
The expression Δ̃H, which denotes the change in entropy as the population evolves from one steady state to the next, and ΔH, which denotes the change in entropy which characterizes the invading mutant, can be shown to satisfy (17)
 |
16 |
This equation asserts that the global directional change in entropy as one population replaces another under the dual processes of mutation and selection is positively correlated with the local directional changes in entropy induced by the invading mutant itself.
The integration of the mutation event as described by Eq. 13, the invasion–extinction characterization A(1), A(3), A(4), and the selection event, as represented by Eq. 16, provides a means of relating the demographic and ecological conditions with global directional trends in evolutionary entropy. The relations are summarized in Table 1. We distinguish between density-dependent populations, whose equilibrium states are described by the condition r = 0, and density-independent populations which satisfies the condition r > 0. For the density-independent model, two situations are described: slow exponential growth, Φ < 0, rapid exponential growth Φ > 0. We also distinguish, in the case of rapid exponential growth, between weak iteroparity (γ < 0) and strong iteroparity (γ > 0).
Table 1.
Relation between ecological conditions and evolutionary trends
| Demographic and ecological constraints | Directional changes in entropy |
|---|---|
| Density-dependent conditions | |
| Stationary growth (r = 0) | Increase |
| Density-independent conditions (r > 0) | |
| (i) Slow exponential growth (Φ < 0) | Increase |
| (ii) Rapid exponential growth (Φ > 0) | Decrease |
| Weak iteroparity (γ < 0) | |
| (iii) Rapid exponential growth (Φ > 0) | Random, |
| Strong iteroparity (γ > 0) | nondirectional |
There exist intrinsic limits to the directional changes in entropy, owing to constraints on the ability of new mutants to become established in the population. The degree of genetic polymorphism at a given locus can be shown to increase for the mutation–selection process when ecological conditions that generate directional changes in entropy obtain. However, a limit will ultimately be attained, described by the state where the genome becomes invulnerable to the invasion of new alleles. This limiting condition derives from a result due to Kingman (30), who showed that the expectation, ρ, that a new mutant takes its place in a new equilibrium population, scales according to the relation, ρ ∼ exp(−αk), where α is a parameter that depends on the fitness of the different alleles, and k denotes the number of alleles at the locus. The expression for ρ implies that large polymorphisms once established are highly resistant to invasion by a new mutant: moreover, this resistance increases exponentially with the number of alleles.
We can therefore assert that, in ecological conditions which induce stationary or slow population growth, entropy will increase to some upper limit which may be inferior to the mathematically defined maximum condition. Also, in weakly iteroparous populations under conditions of rapid exponential growth, entropy will decrease to some lower limit which will be superior to the zero entropy state.
The mutation–selection analysis also provides a basis for predicting, when stationary growth constraints obtain, changes in entropy, as described by the nondimensional quantity S̃. Now, in evolution under ecological conditions that induce stationary growth, the generation time T̃ will remain invariant as one population replaces another under the dual process of mutation and selection. Since S̃ = HT̃ holds, we can infer from the unidirectional increase in H, that the entropy S̃ also increases.
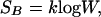
Entropy and Body Size.
Body size is a multivariate character which is correlated with many physiological and life-history traits. An individual’s body size imposes constraints on the rate of metabolic processes and therefore controls its relationship to the external environment. Empirical studies have shown that within a taxon, such as mammals, physiological and morphological variables, Y, are power functions of body size, W. We have, Y = αWβ, where the parameter α denotes the proportionality coefficient. The exponent β is known to fall into certain patterns determined by the dimension of the variable Y: capacities of transport organs (β ≃ 1); volume rates, such as metabolic rates (β ≃ 3/4); cycle time, such as generation time (β ≃ 1/4) (31, 32).
Evolutionary entropy is a life-history variable. As observed from Eq. 3, in the case of models where an individual’s state is parameterized by the variable age, entropy H is given by the ratio S̃/T̃. We now present an energetics-life history population model which predicts that the entropy S̃ is isometric to body size W.
In ref. 33, I developed a model of the organism as a metabolic system described in terms of a set of coupled chemical reactions. By assuming that the metabolic energy generated by the chemical reactions is allocated uniquely to reproduction and survivorship, I showed that net offspring production over the course of an individual life is proportional to body size. I will exploit this relation whose empirical basis is discussed in ref. 34 to show that entropy is isometric to body size.
Now, by appealing to demographic theory (16), I note that the function p̃j, the probability that the mother of a randomly chosen newborn belongs to age-class (j), can be expressed by p̃j = exp(−ωj)/Z, where Z = Σjexp(−ωj), and ωj = −logVj, where Vj denotes the net reproductive function of individuals in age class (j). Population growth rate, r = log Z, can be expressed as the difference between an entropy and an ‘energy’ function as follows,
 |
At equilibrium, r = 0, and the entropy S̃ now becomes S̃ = ∑p̃jωj. The function ∑p̃jωj is the expected offspring production over the course of an individual life. Since this quantity is proportional to body size (33), I conclude that the isometric relation S̃ = aW holds.
I can also derive an allometric relation for the entropy function H = S̃/T̃. Since the generation time T̃ scales on body size with exponent 1/4 (32), I conclude that H scales on body size with exponent 3/4. The scaling relations for the entropy functions can be used to predict the effect of ecological and demographic constraints on evolutionary trends in body size. We can appeal to the directionality theorems for entropy to predict the following patterns: (i) an increase in body size (stationary or slowly growing populations), (ii) a decrease in body size (rapidly increasing populations with weakly iteroparous life cycles), and (iii) random nondirectional changes in body size (rapidly increasing populations with strongly iteroparous life cycles).
Most species for the greater part of their evolutionary history will be subject to ecological conditions that induce slow or stationary growth. We can therefore predict a tendency toward an increase in body size within most phyletic lineages. These predictions are consistent with the fossil record. Studies concerning trends in body size or some reasonably proxy for size such as molar area in animals, have revealed a widespread tendency to increase—a property that is sometimes codified as Cope’s Rule, (35). Instances have been documented in which departures from this trend occur. The theory described in this article predicts that trends toward decreased or random nondirectional changes in size will only occur under particular ecological constraints, namely, conditions that entail rapid exponential growth.
The Directionality Principle and the Second Law
Thermodynamic theory and evolutionary theory represent two domains whose mathematical structures embody a time asymmetric evolution of macroscopic states. However, the mechanisms that generate the temporal asymmetry are distinct.
Thermodynamics is concerned with explaining the dynamical behavior of aggregates of inanimate matter in so far as it is determined by changes in temperature. The central parameters in the theory are the free energy F, the mean energy E, the entropy S, and the temperature T, which are related by the identity
 |
17 |
The temperature of any object, a measure of the mean kinetic energy of the molecules, can be described by the amount of heat that must be added to it to increase its entropy by one unit. We write
 |
18 |
The Second Law, one of the main tenets of thermodynamic theory, pertains to closed systems: it is a precise statement of the familiar observation that in natural processes that are thermally isolated from their surroundings, systems evolve from a more ordered to a less ordered state. This fact is equivalent to the assertion that in irreversible processes subject to adiabatic constraints, there is a tendency for thermal energy to be distributed uniformly among the basic elements of matter.
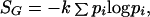
Evolutionary theory in its widest sense is concerned with understanding the dynamical behavior of populations of replicating organisms in so far as it is determined by changes in generation time. The central parameters in this theory are the growth rate r, the reproductive potential Φ, the entropy S̃, and the generation time T̃. We note from Eq. 9 and the property S̃ = HT, that the four quantities satisfy the relation
 |
19 |
The generation time, the mean age of mothers at the birth of their daughters, can be described by a relation analogous to Eq. 18. An expression for the generation time given by Eq. 20 can be derived from the perturbation relations given by Eq. 13. We have
 |
20 |
The generation time can thus be described by the amount of reproductive potential that must be added to the population to reduce its entropy by one unit.
The Directionality Principle for evolutionary entropy pertains to open systems: it is a precise statement of the observation that in populations subject to density dependent growth constraints, there is evolution from lower to higher degrees of life cycle complexity. This fact is equivalent to the assertion that when conditions of stationary growth prevails, there is a tendency for net-reproductive activity to be distributed more uniformly over the different stages of the life history.
These observations indicate the existence of a formal correspondence between the population parameters and the thermodynamic quantities. By observing the equivalence between Eqs. 17 and 19, and between Eqs. 18 and 20, I infer the following correspondence: free energy–growth rate; reproductive potential–mean energy; temperature–inverse generation time; thermodynamic entropy–evolutionary entropy. The relations between the parameters are summarized in Table 2.
Table 2.
Relation between thermodynamic and evolutionary principles
| Properties | Evolutionary systems | Thermodynamic systems |
|---|---|---|
| Measure of heterogeneity | S̃ = −Σ p̃jlog p̃j | S = −Σ pjlog pj |
| Organizing variable | Generation time | Inverse temperature |
| Nature of steady state | Nonequilibrium | Equilibrium |
| Directionality principle | ΔS̃ > 0, densitydependent conditions | ΔS > 0, irreversible adiabatic constraints |
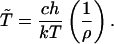
Generation Time and Temperature.
The results described in this article also pertain to a wide class of models. Directionality theorems for evolutionary entropy have been shown to hold for dynamical systems described by products of random positive matrices (11). These dynamical systems include the Leslie matrices, models of cellular populations, and also discrete analogues of the quasi-species models developed by Eigen (36) and Eigen and Schuster (37); see also ref. 38.
Cellular and molecular assemblies can be considered as both evolutionary and thermodynamic systems. Bimolecular association and unimolecular dissociation reactions, processes that drive molecular evolution, are temperature-dependent. The enzymatic reactions that determine the biosynthesis of cellular matter are also temperature-dependent. Hence these systems can be described in terms of an evolutionary entropy S̃, and cycle time T̃, and also in terms of a thermodynamic entropy S, and an absolute temperature T.
Empirical studies of cellular growth show that within temperature ranges where enzyme denaturation does not occur, cycle time is inversely related to temperature (39). An analytical relation between cycle time and temperature can be derived by appealing to transition state theory. The rate constant v, describing the enzymatic transformation of substrate to product is given by
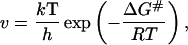 |
where k is Boltzmann constant; h, Planck’s constant; R, the gas constant; and ΔG#, the activation free energy.
We now consider the cell as a network of metabolic pathways in which the transformation between substrate and product is mediated by an array of specific catalysts. This means that the flux through each part of the network is dependent on the kinetic parameters of all enzymes in the system. The simplified representation of such a network is a linear metabolic pathway with successive substrates and product as follows
 |
We can now appeal to the Kacser–Burns theory (40) to show that the metabolic flux through the enzymatic system will be inversely proportional to Σi=11/Ei where Ei denotes the enzyme activity, a quantity that is proportional to the velocity v of the reaction between a substrate with concentration Si; and a product with concentration Si+1.
Now, cycle time T̃ will be inversely proportional to metabolic flux. Hence, we have
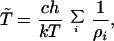 |
21 |
where ρi = exp[−(ΔFi#/RT)], with ΔFi# the activation free energy of the enzyme with activity Ei. The constant c is a function of the concentration of the cellular reactants, enzymes and substrates. The equation (Eq. 21) can be expressed in the more compact form given by (Eq. 5) where ρ = exp[−(ΔF#/RT)] and ΔF# denotes an effective activation energy.
The analytic relation between generation time T̃ and temperature T which Eq. 21 expresses, indicates that the formal relation between the two quantities which is described in Table 2 has a physical basis, in the case of cellular populations. This property entails that the directionality principle for evolutionary entropy represents a nonequilibrium analogue of the Second Law of Thermodynamics.
Conclusion
The theory described in this article invokes the processes of mutation and natural selection to provide a mechanistic explanation of macroevolutionary trends in biopopulations. A central parameter in this theory is the concept evolutionary entropy, a statistical measure which characterizes the complexity of the life cycle and population stability. Entropy, as described by the nondimensional quantity S̃, is also isometric to the morphometric variable, body size. The statistical mechanics of replicating organisms distinguishes between two distinct kinds of ecological constraints—limited resource conditions (with stationary or slow population growth), unlimited resource conditions (with rapid exponential growth); and two demographic conditions, weak iteroparity (few reproductive states) and strong iteroparity (many reproductive states). The theory rests on the following tenets: (i) an increase in life cycle complexity and body size in evolution under limited resource conditions, (ii) a decrease in life cycle complexity and body size in evolution under unlimited resource conditions for populations with weak iteroparity, and (iii) random, nondirectional changes in complexity and body size in evolution under unlimited resource conditions for populations characterized by strong iteroparity.
The mathematical structures of the statistical mechanics of replicating organisms (Directionality Theory), and the statistical mechanics of physical systems (Thermodynamic Theory) are intimately related. Evolutionary entropy, which pertains to populations of replicating organisms, is an extension of thermodynamic entropy, which pertains to aggregates of inanimate matter. The Directionality Principle, which describes an increased complexity and stability of replicating entities subject to stationary growth constraints, is a nonequilibrium analogue of the Second Law, which describes an increase in disorder in inanimate matter subject to irreversible processes and adiabatic constraints.
References
- 1.Boltzmann L. Vorlesungen über Gas Theorie. Leipzig, Germany: Barth; 1896. [Google Scholar]
- 2.Darwin C. On the Origin of Species. London: Murray; 1859. [Google Scholar]
- 3.Fisher R A. The Genetical Theory of Natural Selection. New York: Dover; 1930. [Google Scholar]
- 4.Manyard Smith J. In: Evolutionary Progress. Niteccki M, editor. Chicago: Univ. of Chicago Press; 1988. pp. 219–230. [Google Scholar]
- 5.Levins R, Lewontin R. The Dialectical Biologist. Cambridge, MA: Harvard Univ. Press; 1985. pp. 14–17. [Google Scholar]
- 6.Karlin S. Stat Sci. 1992;7:13–33. [Google Scholar]
- 7.Ewens W. Mathematical Population Genetics. Berlin: Springer; 1979. [Google Scholar]
- 8.Crow J, Kimura M. An Introduction to Population Genetic Theory. New York: Harper and Row; 1970. [Google Scholar]
- 9.Manyard Smith J. Evolutionary Genetics. Oxford: Oxford Univ. Press; 1984. [Google Scholar]
- 10.Demetrius L. Proc Natl Acad Sci USA. 1977;77:384–386. doi: 10.1073/pnas.74.1.384. [DOI] [PMC free article] [PubMed] [Google Scholar]
- 11.Arnold L, Demetrius L, Gundlach M. Ann Appl Probab. 1994;4:859–901. [Google Scholar]
- 12.Tuljapurkar S. J Math Biol. 1982;13:325–337. doi: 10.1007/BF01832846. [DOI] [PubMed] [Google Scholar]
- 13.Billingsley P. Ergodic Theory and Information. New York: Wiley; 1965. [Google Scholar]
- 14.Demetrius L. Proc Natl Acad Sci. 1974;71:4645–4647. doi: 10.1073/pnas.71.12.4645. [DOI] [PMC free article] [PubMed] [Google Scholar]
- 15.Demongeot J, Demetrius L. Population. 1989;1:109–134. [Google Scholar]
- 16.Demetrius L. J Stat Phys. 1983;30:709–753. [Google Scholar]
- 17.Demetrius L. Theor Popul Biol. 1992;41:208–223. [Google Scholar]
- 18.Demetrius L. Physica A. 1992;189:417–436. [Google Scholar]
- 19.Demetrius L, Ziehe M. Proc R Soc London Ser B. 1984;222:33–50. [Google Scholar]
- 20.Demetrius L. In: Mathematical Population Dynamics. Arino D, Axelrod D, Kimmel M, editors. Winnipeg, Canada: Wuerz; 1996. pp. 203–234. [Google Scholar]
- 21.Brooks D R, Wiley E O. Evolution as Entropy: Toward a Unified Theory of Biology. Chicago: Univ. of Chicago Press; 1986. [Google Scholar]
- 22.Prigogine I, Nicolis G, Babloyantz A. Phys Today. 1972;25:23–28. 38–44. [Google Scholar]
- 23.Wicken J S. Evolution, Thermodynamics and Information. Oxford: Oxford Univ. Press; 1987. [Google Scholar]
- 24.Weber B, Depew D J, Smith J D. Entropy, Information and Evolution. Cambridge, MA: MIT Press; 1988. [Google Scholar]
- 25.Ruelle D. Thermodynamic Formalism, Encyclopedia of Mathematics and its Applications. Reading, MA: Addison–Wesley; 1978. [Google Scholar]
- 26.Feller W. Proceedings of the Second Berkeley Symposium on Mathematical Statistics and Probability. Berkeley: Univ. of California Press; 1951. pp. 227–248. [Google Scholar]
- 27.Gillespie J. Genetics. 1974;76:601–606. doi: 10.1093/genetics/76.3.601. [DOI] [PMC free article] [PubMed] [Google Scholar]
- 28.Karlin S, Levikson B. Theor Popul Biol. 1974;6:383–412. doi: 10.1016/0040-5809(75)90046-5. [DOI] [PubMed] [Google Scholar]
- 29.Kimura M. J Appl Probab. 1964;1:177–232. [Google Scholar]
- 30.Kingman J F C. The Mathematics of Genetic Diversity. Philadelphia: Society of Industrial and Applied Mathematics; 1980. [Google Scholar]
- 31.Peters R H. The Ecological Implications of Body Size. Cambridge, U.K.: Cambridge Univ. Press; 1983. [Google Scholar]
- 32.Calder W. Size, Function and Life History. Cambridge, MA: Harvard Univ. Press; 1984. [Google Scholar]
- 33.Demetrius L. In: Evolutionary Genetics from Molecules to Morphology. Singh R, Krimbas P, editors. Cambridge, U.K.: Cambridge Univ. Press; 1997. in press. [Google Scholar]
- 34.Reiss M J. The Allometry of Growth and Reproduction. Cambridge: Cambridge Univ. Press; 1989. [Google Scholar]
- 35.McKinney M L. In: Evolutionary Trends. McNamara K J, editor. Tucson: Univ. of Arizona Press; 1995. pp. 75–118. [Google Scholar]
- 36.Eigen M. Naturwissenschaften. 1971;58:465–531. doi: 10.1007/BF00623322. [DOI] [PubMed] [Google Scholar]
- 37.Eigen M, Schuster P. The Hypercycle. Berlin: Springer; 1979. [Google Scholar]
- 38.Demetrius L. Proc R Soc London Ser B. 1985;225:147–159. doi: 10.1098/rspb.1985.0056. [DOI] [PubMed] [Google Scholar]
- 39.Christophersen J. In: Temperature and Life. Presht H, Christophersen J, Hensel H, Larcher W, editors. New York: Springer; 1973. pp. 3–59. [Google Scholar]
- 40.Kacser H, Burns J A. Sym Soc Exp Biol. 1973;32:65–104. [PubMed] [Google Scholar]