

Abstract
Emergence of resistance is a major concern in influenza antiviral treatment and prophylaxis. Combination antiviral therapy might overcome this problem. Here, we estimate that all possible single mutants and a sizeable fraction of double mutants are generated during an uncomplicated influenza infection. While most of them may sustain a fitness cost, some variants may confer drug resistance and be selected during therapy. We argue that a triple combination regimen would markedly reduce the risk of antiviral resistance emergence in seasonal and pandemic influenza viruses, especially in seriously ill or immunocompromised hosts.
Infection with influenza viruses remains an important public health problem worldwide. Vaccines are the primary pharmacologic means for prevention, but they may not be available in the event of a pandemic or effective when there is a mismatch with the circulating strain or when immunogenicity is inadequate. Currently, there are 2 classes of licensed drugs against influenza available in most countries: the M2 ion channel inhibitors (adamantanes) and the neuraminidase inhibitors. However, single nucleotide substitutions and corresponding amino acid changes can generate high-level resistance to adamantanes and neuraminidase inhibitors, like oseltamivir [1]. Consequently, the effectiveness of these agents, primarily used as monotherapy, can be undermined by the emergence of drug-resistant variants during prophylaxis or therapy, especially in immunocompromised hosts or those with severe illness. Furthermore, adamantane-resistant H3N2 and pandemic H1N1 viruses and oseltamivir-resistant seasonal H1N1 virus have circulated globally in recent years [1], and community transmission of dually adamantane-oseltamivir resistant seasonal H1N1 [2] and, recently, pandemic H1N1 viruses has been reported. Combining drugs with different mechanisms of antiviral action is an obvious strategy to reduce the risk of resistance emergence. Here we address this issue by using a probabilistic model based on viral replication patterns in infected persons and discuss its implications for influenza therapy.
METHODS
Probability of Generating Influenza Variants
The RNA carried by each influenza virion is produced by the action of an error-prone viral RNA polymerase. If the influenza genome is N nucleotides long and a substitution error occurs with probability µ per replication, then the probability of having i-nucleotide substitutions (i.e., an i-mutant) after 1 replication event is given by the binomial distribution, 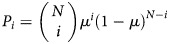 . Although mutation rates may differ between sites within a genome, for simplicity we assume that mutation occurs with the same probability at all sites.
Fraction of All Possible Mutants Produced During Infection
One means of estimating whether drug-resistant variants might arise during an influenza infection is to calculate the fraction of all possible variants that are produced. For example, assume that a particular single nucleotide substitution in the influenza genome can give rise to drug resistance. Then if influenza variants carrying all possible 1-base changes were generated during an infection, this particular drug-resistant variant would be included among the population. However, if only 10% of all possible variants were generated, then there would be a 10% chance that the particular drug-resistant variant would be generated.
If the total number of virions produced during infection is Vtot, then according to the binomial distribution the average number of i-mutants generated per infection is Vtot · Pi, with an SD of 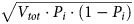 . Since each of the N nucleotides could mutate to any of 3 other nucleotides, there are a total of
  possible sequences with i substitutions. Thus, the expected fraction of all possible i-mutants produced during infection initiated with a fully drug-sensitive virus is
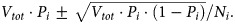
Conversion of the Viral Titer in Nasal Wash to the Number of Virions Produced at the Site of Infection
To estimate the total number of virions produced during an infection, we used viral titer data from an experimental infection study of H1N1 virus [3]. Since experimental infections are generally restricted to the upper respiratory tract, this is a minimal estimate of viral production during naturally occurring infections; much higher and more sustained viral loads have been documented in the lower respiratory tract of patients with severe pandemic H1N1 illness [4]. Since the viral titer was measured in units of 50% tissue culture infectious doses (TCID50) per milliliter of nasal wash [3], we need to convert it to the number of virions produced at the site of infection. In experiments performed on Madin-Darby canine kidney cells, infectious virions made up only about 1 in 10 000 virions [5]. We assume virus in humans is 10-fold more infectious (ie, 1000 virions in nasal wash correspond to 1 TCID50). Next, the concentration of total virions in nasal wash needs to be converted to the concentration of total virions at the site of infection. Although very little information is available, it is believed that the concentration of virions at the site of infection is higher by a factor of 1–100 [6], according to circumstantial data [7]. Here, we choose the factor to be 10. Last, the volume of the upper respiratory tract is approximately 30 mL [8]. Combining the above, we obtain f = 3 × 10⁵ virions/(TCID50/mL), which converts 1 TCID50/mL of nasal wash to f virions at the site of infection. Sensitivity analysis on the total number of virions produced during infection is performed below.
RESULTS
Total Number of Virions Produced During the Course of Atypical Influenza Infection
Baccam et al. [9] fit a viral dynamic model to experimental viral titer data obtained via nasal washes from H1N1 influenza A/Hong Kong/123/77–infected adult volunteers [3]. By using this model and the parameters estimated for each individual, we computed the total number of virions generated during the observed 7-day infection, as follows: . Here p is the viral production rate per cell, and I(t) is the number of productively infected cells, with both values estimated from the best fit to the data [9]. Table 1 gives Vtot for each individual, yielding an average of 8.1 × 10¹¹ virions. These Vtot values will be used to compute the expected number of viral variants during infection.
Table 1.
Total Number of Virions Generated During an Uncomplicated Influenza Infection
| Total No. of Virions Generated |
|||
|---|---|---|---|
| Patient | During 7-Day Infection (from t0 to t7) | From t0 to tpeak | From tpeak −1 to tpeak +1 |
| 1 | 2.8 × 10¹¹ | 1.8 × 10¹¹ | 2.7 × 10¹¹ |
| 2 | 4.4 × 10¹⁰ | 3.8 × 10¹⁰ | 4.4 × 10¹⁰ |
| 3 | 1.8 × 10¹¹ | 1.2 × 10¹¹ | 1.7 × 10¹¹ |
| 4 | 1.8 × 10¹² | 1.2 × 10¹² | 1.7 × 10¹² |
| 5 | 2.3 × 10¹¹ | 1.6 × 10¹¹ | 2.2 × 10¹¹ |
| 6 | 2.4 × 10¹² | 1.6 × 10¹² | 2.3 × 10¹² |
| Average | 8.1 × 10¹¹ | 5.4 × 10¹¹ | 7.8 × 10¹¹ |
Abbreviations: tpeak, time when viral peak is achieved; t0, time of initial infection; t7, is the time when virus is cleared.
Because the number of virions produced during an infection is a key parameter, we also use another simpler method to calculate it. In Hoopes et al. [10], we assume that of the approximately 4 × 10⁸ epithelial cells in the upper respiratory tract [9], about 25% are infected during seasonal influenza infection, as observed during equine influenza infection [11], and that each infected cell produces 5000 virions. Under these circumstances, the total number of virions produced during infection is 5 × 10¹¹, which is of the same order of magnitude as the estimate above. The estimate of 5000 virions produced per infected cell is very likely a conservative estimate, as numbers closer to 20 000 virions per cell have been reported [12]. Further, if only 1 in 1000 virions is infectious, then this implies that only 5 infectious virions are produced per cell, which is also likely an underestimate, since in early infection it has been estimated that each infected cell infects approximately 20 other cells [9]. Thus, one might expect >5 × 10¹¹ virions to be produced in a typical infection or >1 of 1000 to be infectious.
To gain insight into the possible transmission of drug-resistant variants, we also computed the total number of virions produced by the time of peak replication (tpeak) and around peak replication because this is the time when people are most infectious. The average number of virions produced by tpeak and from 1 day before tpeak to 1 day after tpeak is 5.4 × 10¹¹ and 7.8 × 10¹¹, respectively, which shows that most of the virus produced during infection is produced near the time of the viral peak (Table 1). This is likely close to or shortly before the time of initiating antiviral therapy in outpatients.
Generation of Different Influenza Variants During Infection
The number of nucleotides in the influenza A genome is approximately 1.4 × 10⁴. To calculate the probability of generating different influenza variants within an infected host, we chose the point mutation rate to be 2 × 10⁻⁶ per copied nucleotide [13], which is conservative as other estimates are higher [14]. According to the binomial distribution, if a person is infected with a susceptible virus, we find that each new virion generated, whether infectious or not, has a probability of 97% to carry a nonmutated genome, 2.7% to carry 1 nucleotide substitution, 0.038% to carry 2 substitutions, and 0.00036% to carry 3 substitutions (Table 2).
Table 2.
Probability of Generating Influenza Virus Mutants and Number and Fraction of All Possible Mutants Produced During Infection
| No. of Mutants Produced |
Fraction of All Possible Mutants Produced, Seasonal Strains,a % |
||||||||
|---|---|---|---|---|---|---|---|---|---|
| No. of Nucleotide Changes | Probability of Generation of Mutants | From t0 to t7 | From t0 to tpeak | From tpeak−1 to tpeak+1 | No. of All Possible Mutants | From t0 to t7 | From t0 to tpeak | From tpeak–1 to tpeak+1 | Fraction of All Possible Mutants Produced, Highly Pathogenic Strains,b % |
| 1 | 0.027 | 2.2 × 10¹⁰ ± 1.5 × 10⁵ | 1.5 × 10¹⁰ ± 1.2 × 10⁵ | 2.1 × 10¹⁰ ± 1.4 × 10⁵ | 4.2 × 10⁴ | 100 | 100 | 100 | 100 |
| 2 | 0.00038 | 3.1 × 10⁸ ± 1.8 × 10⁴ | 2.1 × 10⁸ ± 1.4 × 10⁴ | 3.0 × 10⁸ ± 1.7 × 10⁴ | 8.8 × 10⁸ | 35 ± 2.0 × 10⁻³ | 23 ± 1.6 × 10⁻³ | 34 ± 2.0 × 10⁻³ | 100 ± 4.5 × 10⁻³ |
| 3 | 0.0000036 | 2.9 × 10⁶ ± 1.7 × 10³ | 1.9 × 10⁶ ± 1.4 × 10³ | 2.8 × 10⁶ ± 1.7 × 10³ | 1.2 × 10¹³ | 2.3 × 10⁻⁵ ± 1.4 × 10⁻⁸ | 1.6 × 10⁻⁵ ± 1.1 × 10⁻⁸ | 2.2 × 10⁻⁵ ± 1.3 × 10⁻⁸ | 1.2 × 10⁻⁴ ± 3.1 × 10⁻⁸ |
Data are mean ± SD, unless otherwise indicated.
Abbreviations: tpeak, time when viral peak is achieved; t0, time of initial infection; t7, is the time when virus is cleared.
a Data are for seasonal H3N2 and H1N1 influenza virus, for example.
b Data are for pathogenic avian influenza A H5N1 virus, for example. The experimental data from [3] reflect a short-lived, uncomplicated upper respiratory tract infection occurring in partially immune adults. Viral titers peaked at days 2–3 after infection and were negligible by day 7. Higher and more sustained levels of replication occur in young children. With novel influenza virus infections, such as those due to highly pathogenic H5N1 [7] or severe pandemic 2009 (H1N1) strains causing viral pneumonia [4], or in immunocompromised hosts with protracted replication, the levels of virus replication could be a few fold (eg, 5-fold in the table) or potentially several orders of magnitude higher. However, even with a 1000-fold higher viral production rate, only approximately 0.02% of all triple mutants will be generated. More sensitivity tests related to mutation frequency and in-host extent of replication are included in the Supplementary material.
On the basis of the estimate of approximately 8 × 10¹¹ virions produced during the course of uncomplicated influenza infection, we calculated that on average 2.2 × 10¹⁰, 3.1 × 10⁸, and 2.9 × 10⁶ mutants are generated with random single, double, and triple nucleotide changes, respectively (Table 2). Since a base can mutate to any of 3 others, the number of all possible single, double, and triple mutants is 4.2 × 10⁴, 8.8 × 10⁸, 1.2 × 10¹³, respectively. Thus, all possible single mutants, about 35% of all possible double mutants, and about 2 × 10⁻⁵% of all possible triple mutants are generated during influenza infection within 1 host. If we focus on infectious virions, the fraction of all possible infectious variants produced remains unchanged.
When we used the calculation of virions produced around the time of peak infection, we obtained similar results (Table 2). For severe viral pneumonia, as observed with H5N1 and in pandemic 2009 (H1N1) influenza, or for immunocompromised patients, we assumed the virus production is 5–1000-fold higher. We also calculated the fraction of all possible mutants generated during infection when the mutation rate is 10-fold higher. In both cases, all possible single and double mutants are predicted to be generated, whereas the fraction of triple mutants produced is still relatively small (from 1 × 10⁻⁴% to 2 × 10⁻²%; Table 2 and Supplementary material). Thus, a large increase in either the mutation rate or the total number of virions produced during infection, 2 critical parameters in our calculations, would generate similar results.
DISCUSSION
Emergence of antiviral resistance poses a major challenge in the clinical management of seasonal and pandemic influenza [1]. Here we estimated the probability of producing various influenza variants during infection. The results predict that all possible single mutants are produced hundreds of thousands of times during infection in a single host. Although growth and emergence of such variants depend on a number of factors, such as vulnerability to immune attack, susceptibility to drugs, transmission and replication capacities, and, possibly, mechanisms of antiviral action, we expect drug resistance to arise particularly when therapy is given to enough infected persons and imposes strong selection for the outgrowth of drug-resistant variants, corresponding with the clinical experience with adamantanes and less often with oseltamivir [1]. Therapy with double combinations can decrease the possibility of de novo drug resistance. However, a sizeable fraction of all possible double mutants are also generated during infection (Table 2), and variants generated early in infection with 1 or 2 substitutions could acquire an additional mutation. Some substitution combinations will confer drug resistance, and some may involve predisposing or compensatory mutations that restore viral fitness [15]. Thus, a more sensible strategy is to use drug combinations that require ≥3 mutations to generate resistance, especially in individuals with high replication levels, like immunocompromised hosts and severely ill viral pneumonia patients. Moreover, the recent circulation of influenza A viruses resistant to adamantanes or oseltamivir reduces the genetic barrier of double combinations to only a single mutation; pandemic H1N1 and seasonal H1N1 with dual resistance have already been reported [1, 2]. Simultaneous triple mutants arise so infrequently that enormous populations of infected individuals are required to generate even a single instance of such variants (Table 2). Thus, triple combination therapy provides an additional genetic barrier.
In practice, triple therapy may not be necessary for treating immunocompetent individuals, since host immune responses clear virus relatively rapidly once symptoms appear. However, combination therapy needs to be seriously considered in selected influenza target groups, particularly patients with H5N1 infection, viral pneumonia, and/or severe immunocompromise. A recent in vitro study reported that a triple combination of amantadine, oseltamivir, and ribavirin is synergistic as compared to any dual combinations against drug-resistant influenza viruses [16]. Of note, a randomized trial comparing this triple regimen to oseltamivir monotherapy is currently being conducted in at-risk, ambulatory adults by the National Institute of Allergy and Infectious Diseases (clinical trials registration number NCT01227967). More preclinical/clinical studies will be essential to determine whether combination of available and/or novel agents will reduce resistance emergence and offer clinically meaningful benefits.
Overall, our calculation lays a theoretical foundation for combination therapies for influenza. If antiviral therapy were to be widely used, combinations of drugs that have a genetic barrier of 3 mutations might be needed to mitigate resistance emergence during influenza treatment, especially in patients with serious infections associated with high and sustained viral replication or with preexisting resistance to an antiviral class. Our findings support development of novel inhibitors and greater diversity in antiviral stockpile choices.
Supplementary Data
Supplementary materials are available at The Journal of Infectious Diseases online (http://jid.oxfordjournals.org/our_journals/jid/). Supplementary materials consist of data provided by the author that are published to benefit the reader. The posted materials are not copyedited. The contents of all supplementary data are the sole responsibility of the authors. Questions or messages regarding errors should be addressed to the author.
Notes
Financial support. This work was supported by the US Department of Energy (DE-AC52-06NA25396), the National Institutes of Health (P30-EB011339, HHSN272201000055C, and OD011095), the Los Alamos National Laboratory LDRD Program, and the National Science Foundation (DMS-1122290 and PHY05-51164).
Potential conflicts of interest. A. S. P. served as a paid consultant for Adamas Pharmaceuticals from 2007 through 2009 and as an unpaid consultant from 2009 through May 2011. Since 2008, F. G. H. has served as noncompensated consultant for multiple companies engaged in antiviral drug development for influenza. L. R. certifies no potential conflicts of interest.
The University of Virginia received honoraria from the Neuraminidase Inhibitor Susceptibility Network (supported by GSK and Roche) from 2008 through 2011 for Dr Hayden's participation.
All authors have submitted the ICMJE Form for Disclosure of Potential Conflicts of Interest. Conflicts that the editors consider relevant to the content of the manuscript have been disclosed.
References
- 1.Hayden FG, de Jong MD. Emerging influenza antiviral resistance threats. J Infect Dis. 2011;203:6–10. doi: 10.1093/infdis/jiq012. [DOI] [PMC free article] [PubMed] [Google Scholar]
- 2.Sheu TG, Fry AM, Garten RJ, et al. Dual resistance to adamantanes and oseltamivir among seasonal influenza A(H1N1) viruses: 2008–2010. J Infect Dis. 2011;203:13–7. doi: 10.1093/infdis/jiq005. [DOI] [PMC free article] [PubMed] [Google Scholar]
- 3.Murphy BR, Rennels MB, Douglas RG, Jr, et al. Evaluation of influenza A/Hong Kong/123/77 (H1N1) ts-1A2 and cold-adapted recombinant viruses in seronegative adult volunteers. Infect Immun. 1980;29:348–55. doi: 10.1128/iai.29.2.348-355.1980. [DOI] [PMC free article] [PubMed] [Google Scholar]
- 4.Lee N, Chan PK, Wong CK, et al. Viral clearance and inflammatory response patterns in adults hospitalized for pandemic 2009 influenza A(H1N1) virus pneumonia. Antivir Ther. 2011;16:237–47. doi: 10.3851/IMP1722. [DOI] [PubMed] [Google Scholar]
- 5.Beauchemin CA, McSharry JJ, Drusano GL, et al. Modeling amantadine treatment of influenza A virus in vitro. J Theor Biol. 2008;254:439–51. doi: 10.1016/j.jtbi.2008.05.031. [DOI] [PMC free article] [PubMed] [Google Scholar]
- 6.Handel A, Longini IM, Jr, Antia R. Neuraminidase inhibitor resistance in influenza: assessing the danger of its generation and spread. PLoS Comput Biol. 2007;3:e240. doi: 10.1371/journal.pcbi.0030240. [DOI] [PMC free article] [PubMed] [Google Scholar]
- 7.de Jong MD, Simmons CP, Thanh TT, et al. Fatal outcome of human influenza A (H5N1) is associated with high viral load and hypercytokinemia. Nat Med. 2006;12:1203–7. doi: 10.1038/nm1477. [DOI] [PMC free article] [PubMed] [Google Scholar]
- 8.Menache MG, Hanna LM, Gross EA, et al. Upper respiratory tract surface areas and volumes of laboratory animals and humans: considerations for dosimetry models. J Toxicol Environ Health. 1997;50:475–506. doi: 10.1080/00984109708984003. [DOI] [PubMed] [Google Scholar]
- 9.Baccam P, Beauchemin C, Macken CA, Hayden FG, Perelson AS. Kinetics of influenza A virus infection in humans. J Virol. 2006;80:7590–9. doi: 10.1128/JVI.01623-05. [DOI] [PMC free article] [PubMed] [Google Scholar]
- 10.Hoopes JD, Driebe EM, Kelley E, et al. Triple combination antiviral drug (TCAD) composed of amantadine, oseltamivir, and ribavirin impedes the selection of drug-resistant influenza A virus. PLoS One. 2011;6:e29778. doi: 10.1371/journal.pone.0029778. [DOI] [PMC free article] [PubMed] [Google Scholar]
- 11.Saenz RA, Quinlivan M, Elton D, et al. Dynamics of influenza virus infection and pathology. J Virol. 2010;84:3974–83. doi: 10.1128/JVI.02078-09. [DOI] [PMC free article] [PubMed] [Google Scholar]
- 12.Mohler L, Flockerzi D, Sann H, Reichl U. Mathematical model of influenza A virus production in large-scale microcarrier culture. Biotechnol Bioeng. 2005;90:46–58. doi: 10.1002/bit.20363. [DOI] [PubMed] [Google Scholar]
- 13.Nobusawa E, Sato K. Comparison of the mutation rates of human influenza A and B viruses. J Virol. 2006;80:3675–8. doi: 10.1128/JVI.80.7.3675-3678.2006. [DOI] [PMC free article] [PubMed] [Google Scholar]
- 14.Parvin JD, Moscona A, Pan WT, Leider JM, Palese P. Measurement of the mutation rates of animal viruses: influenza A virus and poliovirus type 1. J Virol. 1986;59:377–83. doi: 10.1128/jvi.59.2.377-383.1986. [DOI] [PMC free article] [PubMed] [Google Scholar]
- 15.Bloom JD, Gong LI, Baltimore D. Permissive secondary mutations enable the evolution of influenza oseltamivir resistance. Science. 2010;328:1272–5. doi: 10.1126/science.1187816. [DOI] [PMC free article] [PubMed] [Google Scholar]
- 16.Nguyen JT, Hoopes JD, Le MH, et al. Triple combination of amantadine, ribavirin, and oseltamivir is highly active and synergistic against drug resistant influenza virus strains in vitro. PLoS One. 2010;5:e9332. doi: 10.1371/journal.pone.0009332. [DOI] [PMC free article] [PubMed] [Google Scholar]
Associated Data
This section collects any data citations, data availability statements, or supplementary materials included in this article.