

Abstract
Recent meta-analyses conducted across a broad range of taxa have demonstrated a strong linear relationship between the change in magnitude of inbreeding depression under stress and stress level, measured as fitness loss in outbred individuals. This suggests that a general underlying response may link stress and inbreeding depression. However, this relationship is based primarily on laboratory data, and it is unknown whether natural environments with multiple stressors and fluctuating stress levels alter how stress affects inbreeding depression. To test whether the same pattern persists in the field, we investigated the effect of seasonal variation on stress level and inbreeding depression in a 3-year field study measuring the productivity of captive populations of inbred and outbred Drosophila melanogaster. We found cold winter temperatures were most stressful and induced the greatest inbreeding depression. Furthermore, these data, collected under natural field conditions, conformed to the same predictive linear relationship seen in Drosophila laboratory studies, with inbreeding depression increasing by 0.17 lethal equivalents for every 10 per cent increase in stress level. Our results suggest that under natural conditions stress level is a primary determinant of the magnitude of inbreeding depression and should be considered when assessing extinction vulnerability in small populations.
Keywords: inbreeding depression, environmental stress, stress level, natural conditions, seasonal variation
1. Introduction
Environmental threats such as climate change, destruction or loss of habitat and pollution can impose immense fitness costs that jeopardize the survival and persistence of natural populations [1–4]. These threats define forms of environmental stress and, because stress is commonly thought to magnify the deleterious fitness consequences that result from inbreeding [5,6], they are likely to render small populations especially vulnerable to such adverse conditions [2,4,7,8]. Stressors, such as extreme temperatures, pathogens and exposure to chemicals, are predicted to amplify the fitness costs associated with inbreeding (i.e. inbreeding depression) by altering the expression of deleterious alleles (genetic load) in homozygous individuals [5,9], which in turn can heighten extinction risk for small populations [8,10]. However, although a recent meta-analysis found average inbreeding depression is elevated under stressful conditions [9], less than half (48%) of the 53 cases reviewed showed a statistically significant increase, and 24 per cent of cases actually report a decrease in inbreeding depression under stress, a pattern that has fuelled continued controversy over the interaction between inbreeding and stress [9,11,12]. This controversy has largely been resolved by including a measure of the magnitude of stress in the analysis [5,13]. This addition has led to the finding of a strong linear relationship that applies across a diverse array of plant and animal species between the magnitude of effect a stress has on the fitness of outbred individuals (stress level) and inbreeding depression (measured as lethal equivalents [13]; i.e. the slope of the relationship between the natural log of fitness and the level of inbreeding).
The finding of such a general relationship points to the possibility of a very general underlying phenomenon. However, the majority of research included in these reviews has been conducted under controlled laboratory conditions using artificial stressors that may not be representative of complex natural environments where exposure to multiple abiotic and biotic stresses could significantly alter inbreeding–environment interactions owing to synergistic effects of combined stresses on survival [14,15]. In addition, laboratory studies have imposed stress levels ranging from zero stress up to a greater than 80 per cent reduction in fitness [5], but it is unknown what part of this range is representative of stress levels populations experience in the wild or to what extent stress levels vary over time (e.g. through seasonal fluctuations). As a result, it is unclear how natural variation in stress levels will impact the relationship between inbreeding depression and exposure to stressful conditions in natural populations.
The dynamics of inbreeding–stress interactions in natural populations are poorly understood [8,16], despite implications for adaptation to anthropogenically induced environmental changes [1,4,9], purging of genetic load [17] and the survival of small endangered populations [4,8,10]. Among the studies reviewed by Armbruster & Reed [9] only 9 of 34 measured inbreeding depression under field conditions and only 4 measured natural temporal variation in levels of inbreeding depression in wild populations [18–21]. For example, in populations of Darwin's finches inbreeding depression for adult and juvenile survival was found to be strongly influenced by food availability and the presence of competitors [19], while in song sparrows periods of rain were shown to significantly increase inbreeding depression for hatching success [20]. However, none of the studies were able to quantify the level of stress. To determine whether natural stress is qualitatively and quantitatively similar to laboratory stress, we need to determine whether the linear relationship found between stress level and inbreeding depression in laboratory studies holds when populations are challenged by naturally complex and unpredictably stressful environments.
We investigated this relationship, focusing on the effect of seasonal stress. We established a 3-year semi-natural field study in Riverside, California to measure these fluctuations in stress level, and to determine whether these fluctuations induced the expected changes in inbreeding depression. Our study focused on the unpredictable stresses imposed by seasonality, using as our measure of fitness the productivity of small one-generation bottle populations of Drosophila. It is well established that both extreme high and low temperatures can drastically reduce viability in D. melanogaster; however, it is unknown how natural seasonal fluctuations might challenge the physiological limits of this species, therefore affecting both stress levels and inbreeding depression. We found that cold winter conditions were the most stressful for population productivity. We also showed that a strong positive linear relationship exists between increasing stress levels and the magnitude of inbreeding depression expressed in populations exposed to natural seasonal variation.
2. Material and methods
(a). Measurement of productivity of bottle populations in the field and laboratory
Inbred populations were created from a set of lines established approximately 18 months earlier following at least five generations of full-sib mating and then by imposing a further 20 generations of full-sib mating just prior to our experiments. These lines were started from the offspring of single females collected in the University of California, Riverside campus orange grove, and maintained as bottle populations between the two periods of inbreeding. According to theoretical expectation more than 25 generations of full-sib mating yields inbred lines that are close to completely homozygous (F > 0.99) [22]. However, recent work [23] suggests the F level will actually be slightly less (F = 0.95–0.99). During the inbreeding process lethal and some other highly deleterious alleles expressed under benign laboratory conditions would have been purged; however, such large-effect alleles are rare (given mutation–selection balance). By contrast, alleles with smaller deleterious effects will have been randomly fixed in proportion to their frequency. This fixation, combined with the environmental dependence of many deleterious alleles, and thus inbreeding depression [4,16], means that these highly inbred lines are expected to effectively sample the vast majority of the genetic load found in wild populations.
Outbred populations were created by combining an equal number of individuals from each of 10 inbred lines. These populations were maintained in the laboratory (25°C) for four generations prior to use in experiments. Between field seasons, the inbred lines were maintained in the laboratory (25°C), and prior to the start of each field season three separate outbred lines were recreated, always using the same 10 inbred lines. Six of these inbred lines were randomly chosen and used in all field and laboratory experiments.
To initiate an experimental set, we created three experimental bottle populations of 30 males and 30 females (1 to 3 days old) from each of the six inbred and the three fourth-generation outbred stock populations. Each set of 27 bottles used in field testing was placed in full shade under a single tree in the orange groves located on the campus of the University of California, Riverside. Field tests were performed during the three hottest (July, August and September) and three coldest (December, January, and February or March) months. Temperature and humidity were recorded hourly from the time the populations were placed in the field to the time the last progeny were collected using temperature sensors (Dallas Maxim iButton data loggers) placed on the ground next to the experimental bottles. Preliminary experiments indicated that temperatures on the ground directly next to experimental bottles were not different from inside bottles (average difference = ±1° C; data not shown). In addition, during the first month of each season, an additional set of these bottle populations was placed simultaneously in a laboratory incubator at a constant temperature of 25°C.
Bottles placed in the field contained 50 ml of standard cornmeal molasses media and were covered with four layers of cheesecloth to allow airflow. A custom-made device made from a small aluminium rod was fitted to the opening of the bottles and served to prevent food (which sometimes detached when the bottle was inverted) from trapping or killing emerged flies when they were collected. Each bottle was placed in a separate plastic beaker that was secured to the ground with a nail and covered with a ring of Tanglefoot ant/insect deterrent. A metal cage was placed over all the bottles to prevent tampering by raccoons and other small mammals. Despite these precautions, across the three years, 24 of the 135 outbred and 36 of the 270 inbred field bottle populations were lost. Bottles placed under laboratory conditions contained the same amount and type of media, but had foam plugs and no aluminium device inside.
The population productivity of each bottle population was measured as the total number of adult progeny produced in a single generation. Population productivity is a product of parental fecundity and fertility, and of offspring survivorship. As such, it represents a broad measure of fitness [24,25] and is a useful indicator of short-term population persistence. Adults were left in the bottles until the first pupae were observed in any bottle of a set. Eclosing offspring were collected and removed every day for the first 5 days and then once every 3–4 days until there were dark pupae observed in the ‘timing control’ bottles, which served as a criterion for determining the end of first generation and beginning of second generation. For each set, a timing control bottle was initiated when the first pupae were observed. This timing bottle, containing 60 outbred flies on fresh food, provided a conservatively short estimate of the time it was taking for a second generation to develop in the experimental bottles. When dark (immediately pre-eclosion) pupae were observed in the timing control bottle, this marked the end of offspring collection from the experimental bottles. Note that this measure of generation time was defined by larval development time rather than absolute time, thus controlling for the changes in metabolic activity resulting from changes in temperature.
(b). Stress level
Stress level was measured as the proportion reduction in outbred population productivity under field conditions relative to benign laboratory conditions, similar to a measure used previously [5]:
By definition, a zero level of stress will result in equivalent inbreeding depression under benign and (supposedly) stressful conditions [5]. Outbred productivity under benign laboratory conditions did not vary significantly across the different years or seasons of this study (see §3), therefore in order to calculate stress level separately for each month of summer and winter across the 3 years of the study, we used the same estimate of average outbred productivity under laboratory conditions for calculating stress levels in the field across all months within a given season of a year. For example,
 |
(c). Lethal equivalents
For each inbred line, we calculated the number of lethal equivalents (β) under benign laboratory conditions and stressful field conditions (βbenign and βstress, respectively). The number of lethal equivalents is a measure commonly used to compare the effects of inbreeding on fitness across studies, species/taxa and environments [9,11]. Lethal equivalents were calculated according to the following equation [26]:
where wi and wo are the mean fitness (in this case, productivity) of inbred and outbred populations, respectively, and F is the level of inbreeding. Our inbred populations are highly inbred and considered to be completely homozygous (F ≈ 1; see earlier text). We calculated the number of lethal equivalents for each individual inbred line for each month of summer and winter, as well as laboratory conditions. Each individual set of bottle populations placed either into the field or in the laboratory incubator consisted of three outbred lines and six inbred lines, therefore we used the average outbred population productivity (wo) per set to calculate lethal equivalents for each of the inbred lines in the same set. For field conditions, this resulted in an estimate of lethal equivalents for each month of winter and summer, while lethal equivalents were estimated once per season under laboratory conditions.
(d). Data analyses
We first analysed productivity differences among the outbred populations in the field, to determine differences across YEAR (year 1, 2, 3), SEASON (summer, winter) and MONTH (nested within SEASON and YEAR), recalling that each outbred population was replicated three times, using ANOVA (SAS v. 9.1). YEAR was defined across calendar years to contain one winter and one summer, with winter comprising December, January and February/March, and summer comprising July, August and September. We also analysed productivity differences among the outbred populations under benign laboratory using ANOVA that included YEAR and SEASON.
To convert productivity to stress level, the seasonal productivity values of the outbred populations were corrected by the laboratory productivity for that season in that year. We compared stress levels experienced during the winter and summer seasons (SEASON) and across years (YEAR: 1–3, each consisting of one summer and one winter season). Given the consistent dominance of seasonal effects relative to monthly variation (see §3), replicates were pooled across the three outbred lines within treatment month and each month was then treated as a replicate within season.
Inbreeding depression, measured as the number of lethal equivalents, was analysed using ANOVA with the main effects ENV (laboratory, field summer, field winter), YEAR and LINE (six inbred lines). ENV and YEAR were fixed effects while LINE was random. Similar to the above analysis of stress levels, each monthly estimate of inbreeding depression for the six inbred lines was treated as a replicate within season. Interactions with a p-value greater than 0.25 were removed, and the analysis was re-run [27]. Post hoc multiple comparisons were calculated using a Tukey's test to determine whether inbreeding depression varied significantly across the field (winter and summer) and benign (laboratory) environments.
To test the hypothesis that the difference between inbreeding depression under stressful field and benign laboratory conditions (Δβ = βstress – βbenign) is greatest during the most stressful months of the year, a model I ordinary least-squares linear regression (both unconstrained and constrained to pass through the origin) was performed comparing Δβ and the level of stress for each month of the study. The sample variance on the y-axis (Δβ) was found to be 4.5× larger than that on the x-axis (stress level), which is consistent with our expectation that the error variance of Δβ is much greater than that of stress level, and allows us to use a model I rather than model II regression [28]. We also tested for nonlinear (quadratic and cubic) relationships and compared model fit to the simple first-order linear regression using an F-test. In addition, it should be noted that the data points within a season in a given year are not independent because the same laboratory data are used to define βbenign. We therefore performed two additional regressions based on truly independent data, comparing Δβ and the level of stress for each season within each year (six data points), and using a single constant laboratory value of productivity to calculate βbenign and stress level across all months and seasons (15 data points).
Following Fox & Reed [5], we performed simulations to measure the magnitude of the inherent correlation between the variables stress level and Δβ. We randomly generated 10 datasets of 10 000 cases where inbred and outbred fitnesses were sampled from a uniform distribution using a random number generator in Matlab (version for Windows) and then used to calculate stress level and the number of lethal equivalents (βstress and βbenign). A linear regression was then run on the difference in lethal equivalents under stressful and benign conditions (Δβ) and stress level. On the basis of reported levels of stress and inbreeding depression in Drosophila studies, the upper bounds of these measures were set at 75 per cent (stress level) and 50 per cent (inbreeding depression). Two levels of inbreeding (F = 0.25 or 1.00) were used in separate simulations (five datasets per F).
Finally, we compared the relationship between stress level and change in inbreeding depression for the current field study with that for D. melanogaster laboratory studies. We identified 22 separate cases from 11 studies using D. melanogaster and D. buzzati documenting inbreeding depression for larval to adult survival across various types of abiotic and biotic stressors (see the electronic supplementary material, table S1). We selected studies using only larval survival because this fitness component is most closely comparable with population productivity used in the current study. Lethal equivalents used were those published in Armbruster & Reed's [9] review, with the exception of four studies published after 2005 [29–32] and one unpublished study [13]. Electronic supplementary material, table S1 provides information on the studies used in the analysis. We then performed an ANCOVA, with the following factors: STUDY TYPE (current field versus D. melanogaster literature) and STRESS LEVEL.
3. Results
(a). Seasonal productivity and stress levels
The overall average productivity (measured as the number of adult offspring produced ± s.e.) of outbred populations under benign laboratory conditions was 517 ± 5.6, while in the field it was 440 ± 9.9 in summer and 266 ± 5.8 in winter (table 1a,b). In the laboratory, productivity did not vary across years (YEAR: F2,53 = 3.05, p = 0.06) or seasons (SEASON: F1,53 = 0.41, p > 0.25; SEASON × YEAR F2,53 = 0.60, p > 0.50). In the field, monthly productivity within season and year varied significantly (MONTH (SEASON, YEAR): F9,96 = 9.03, p < 0.001); however, despite this within-season variation there was a significant difference between seasons overall (SEASON: F1,9 = 20.18, p < 0.002; i.e. outbred productivity was significantly higher in the summer than winter). This seasonal difference in field productivity was consistent across years (YEAR × SEASON: F2,9 = 1.92, p > 0.20) and there were no significant differences among years (YEAR: F2,9 = 2.88, p > 0.10).
Table 1.
Seasonal variation in population productivity across 3 years under (a) laboratory and (b) field conditions, and (c) the resulting field stress levels. Productivity = the number of adults produced by a population of 30 females ± s.e. Stress level = 1 − [OBfield/OBlab], i.e. the loss of productivity of outbred populations in the field (OBfield) relative to productivity under laboratory conditions (OBlab). The seasonal averages were calculated across relevant sample months ± s.e.
| year 1 |
year 2 |
year 3 |
||||
|---|---|---|---|---|---|---|
| outbred | inbred | outbred | inbred | outbred | inbred | |
| (a) laboratory productivity | ||||||
| summer | 561 ± 17 | 454 ± 19 | 556 ± 12 | 455 ± 14 | 430 ± 10 | 297 ± 15 |
| winter | 567 ± 10 | 436 ± 20 | 486 ± 18 | 351 ± 19 | 488 ± 14 | 347 ± 24 |
| (b) field productivity | ||||||
| summer | ||||||
| July | — | — | 535 ± 19 | 314 ± 20 | 308 ± 13 | 237 ± 17 |
| August | 382 ± 20 | 297 ± 21 | 444 ± 33 | 338 ± 22 | 510 ± 18 | 212 ± 15 |
| September | 499 ± 19 | 322 ± 18 | 448 ± 30 | 297 ± 14 | 448 ± 15 | 323 ± 32 |
| winter | ||||||
| December | — | — | — | — | 137 ± 13 | 22 ± 6 |
| January | 351 ± 19 | 170 ± 32 | 285 ± 10 | 97 ± 17 | 154 ± 12 | 32 ± 8 |
| February/March | 298 ± 8 | 119 ± 17 | 353 ± 22 | 128 ± 20 | 228 ± 7 | 102 ± 15 |
| (c) stress level | ||||||
| summer | ||||||
| July | — | 0.04 | 0.28 | |||
| August | 0.32 | 0.2 | −0.19 | |||
| September | 0.11 | 0.23 | −0.04 | |||
| yearly average | 0.22 | 0.16 | 0.02 | |||
| seasonal average | 0.12 ± 0.06 | |||||
| winter | ||||||
| December | — | — | 0.72 | |||
| January | 0.39 | 0.41 | 0.68 | |||
| February/March | 0.48 | 0.27 | 0.53 | |||
| yearly average | 0.44 | 0.34 | 0.64 | |||
| seasonal average | 0.50 ± 0.06 | |||||
Because laboratory productivity was consistent over time, variation in the level of stress in the field closely followed variation in field productivity. Thus, contrary to the view that heat stress is extremely detrimental for population survival [30,33], we found that over three seasonal cycles the cold winter months were more stressful for populations of D. melanogaster than summer (F1,9 = 20.05, p = 0.002). Winter months were on average four times more stressful than summer months, with outbred populations producing 50 per cent fewer offspring under winter field conditions relative to benign laboratory conditions, but only 12 per cent fewer during the summer (table 1c). These seasonal differences were independent of year (YEAR: F2,9 = 0.48 p = 0.633; SEASON × YEAR: F2,9 = 3.97, p = 0.064).
(b). The relationship between inbreeding depression and stress level
The cold winter temperatures experienced in the field caused significantly greater inbreeding depression than summer heat (tables 2 and 3; figure 1), matching the stress patterns observed. The average number of lethal equivalents was more than twofold higher during winter months relative to summer months (1.20 versus 0.45, p < 0.001; table 3). In contrast, the high temperatures prevailing during summer field conditions did not significantly amplify inbreeding depression relative to benign laboratory conditions (table 3).
Table 2.
Analysis of inbreeding depression observed in the field and laboratory. ANOVA compared the number of lethal equivalents (β) expressed under three environmental conditions (ENV): in the field during the summer; in the field during the winter; and under controlled laboratory conditions over 3 years (YEAR) in six separate inbred lines (LINE). Interactions with p > 0.25 were removed from the model.
| source | d.f. | ms | F-value | p-value |
|---|---|---|---|---|
| ENV | 2 | 9.340 | 37.063 | <0.0001 |
| YEAR | 2 | 0.836 | 3.317 | 0.041 |
| LINE | 5 | 0.428 | 1.698 | 0.143 |
| error | 106 | 0.252 |
Table 3.
The expression of lethal equivalents in different environments. (a) The average number of lethal equivalents (βavg) in each environment and (b) the difference in lethal equivalents between environments (βdiff) compared using Tukey's HSD post hoc test.
| (a) environment | βavg ± s.e. |
| laboratory | 0.311 ± 0.04 |
| field summer | 0.446 ± 0.05 |
| field winter | 1.203 ± 0.14 |
| (b) post hoc comparison | βdiff ± s.e. |
| summer versus laboratory | 0.135 ± 0.11 |
| winter versus laboratory | 0.892 ± 0.12*** |
| winter versus summer | 0.754 ± 0.11*** |
***p-value < 0.001.
Figure 1.

Inbreeding depression (lethal equivalents) for population productivity under field and laboratory conditions. The number of offspring produced in a single generation was measured in outbred (F = 0) and inbred (F ≈ 1) populations during both winter (shaded) and summer (clear) months in the field (filled circles) and in the laboratory (open circles).
When the field data for stress level and inbreeding depression were compared, we found a significant positive linear relationship (figure 2; slope = 1.56 ± 0.39 and 1.57 ± 0.23 for unconstrained and constrained analyses, respectively), explaining approximately 60 per cent of the variance (r2 = 0.59; p < 0.001), which translates to an additional 0.16 lethal equivalents expressed for every 10 per cent increase in the stress level. ANCOVA was initially run including all possible interactions of STRESS LEVEL with SEASON and YEAR; none of them were significant (p > 0.10). After removal of these interactions, only the covariate STRESS LEVEL was significant (p < 0.001); the effects of SEASON, YEAR and SEASON × YEAR were all non-significant (p > 0.10). Adding nonlinear quadratic and cubic terms did not significantly improve model fit relative to the first order linear regression (p > 0.05). In this analysis, the values within a given season are not strictly independent because a single set of laboratory data was used as the ‘benign’ reference (figure 1). However, this lack of independence did not affect the results because (i) analysis of data based on the seasonal averages for each year (six data points) resulted in a slope of 1.55 ± 0.45 (p < 0.05); and (ii) using the average of all the laboratory values to calculate stress levels and Δβ for all seasons and years (15 data points) yielded a slope of 1.57 ± 0.25 (p < 0.001). The average outbred productivity in the laboratory was 516, with an average inbreeding depression (β) of 0.31.
Figure 2.
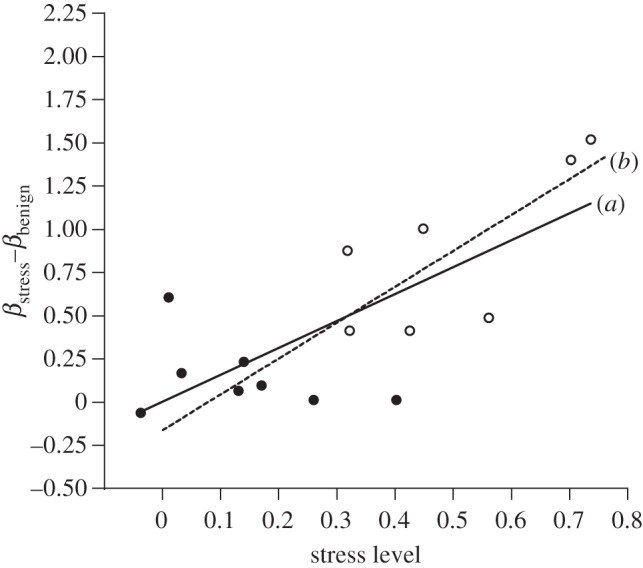
The relationship between stress level and the associated change in the level of inbreeding depression, defined as the difference in lethal equivalents expressed under stressful (βstress) and benign (βbenign) conditions. (a) Data points from the current field experiment with the fitted regression line (Δβ = 0.005 + 1.56 stress level), where stress and benign correspond to field and laboratory, and (b) the regression line fitted to published data from laboratory populations of D. melanogaster and D. buzzatii under different abiotic and biotic stresses (see electronic supplementary material, table S1; Δβ = −0.08 + 2.08 stress level). Filled circles denote summer; open circles denote winter.
The slope of 1.56 estimated under field conditions was not significantly different from the slope of 2.08 ± 0.47 (unconstrained) estimated using data from published studies of Drosophila laboratory populations (figure 2), because inclusion of StudyType (the present study versus published laboratory data) in the ANCOVA did not significantly affect the slope (StudyType × StressLevel, F1,33 = 0.858 p > 0.25). Finally, as did Fox & Reed [5], we confirmed that this significant positive relationship was not driven by the inherent dependence of both stress level and inbreeding depression on the fitness of outbred individuals. We found that stress level and inbreeding depression were on average uncorrelated (slope = 0.05 ± 0.05) across 10 randomly generated datasets (F level = 0.25 or 1.00, five datasets each) sampled from a uniform distribution bounded by reported levels of stress and inbreeding depression in Drosophila studies (see §3).
(c). Temperature measurements in the field
While laboratory populations were kept at a constant 25°C, the field populations experienced an overall average (±s.d.) temperature of 22°C ± 4.3 during the three summer seasons and 12°C ± 2.7 during the three winter seasons (table 4). The overall average daily high (± s.d.) and low (± s.d.) were 28°C ± 2.8 and 18°C ± 2.2 during the summer, and 16°C ± 3.7 and 10°C ± 2.5 during the winter. Peak temperatures (highest recorded temperature for a season) during the summer experiments averaged 33°C (range across years: 31–35°C) while the minimum temperatures (lowest recorded temperature for a season) during the winter experiments averaged 6°C (range across years: 4–8°C).
Table 4.
Summary of temperature data (avg ± s.d.) collected in the field during (a) summer and (b) winter seasons (temperature in °C was recorded hourly using iButtons placed next to experimental bottle populations).
| average daily temperature | average daily high | average daily low | days sampled | |
|---|---|---|---|---|
| (a) summer | ||||
| year 1 | 23 ± 1.5 | 29 ± 2.4 | 19 ± 1.7 | 75 |
| year 2 | 21 ± 3.0 | 28 ± 4.6 | 17 ± 2.2 | 79 |
| year 3 | 21 ± 3.0 | 27 ± 2.5 | 17 ± 2.4 | 74 |
| seasonal average | 22 ± 4.3 | 28 ± 2.8 | 18 ± 2.2 | 76 ± 1.5 |
| (b) winter | ||||
| year 1 | 14 ± 2.5 | 18 ± 3.4 | 11 ± 2.5 | 85 |
| year 2 | 10 ± 1.6 | 13 ± 2.2 | 8 ± 1.6 | 76 |
| year 3 | 12 ± 2.3 | 16 ± 3.5 | 9 ± 2.0 | 76 |
| seasonal average | 12 ± 2.7 | 16 ± 3.7 | 10 ± 2.5 | 79 ± 3.0 |
4. Discussion
Our 3-year field study (2006–2009) using captive populations of D. melanogaster is the first field study to investigate the relationship between inbreeding depression and seasonal fluctuations in stress level. We found that stress levels were on average fourfold higher in the winter compared with the summer, and that this higher stress level increased the inbreeding depression affecting population productivity from 32 per cent in the summer to 65 per cent in the winter. Moreover, this covariation of stress level and inbreeding depression conformed to the same linear relationship seen in experimental Drosophila laboratory studies of stress and inbreeding (figure 2). The observation that inbreeding depression based on population productivity in the field follows the same relationship as inbreeding depression based on larval survival in the laboratory suggests that even in complex environments stress and inbreeding interact in the same predictable manner. This same general relationship has been found in laboratory studies across a variety of species [5,13].
Heat is commonly thought to be highly stressful owing to negative effects on the proper folding and functioning of proteins [3,30,34], and as a result the effects of heat stress on inbreeding depression have received considerable attention [5,9]. However, it has been suggested that winter is the most stressful season for D. melanogaster, as evidenced by marked reductions in population size relative to other seasons [35,36]. We found that the relatively mild winter temperatures of southern California were, for D. melanogaster, highly stressful, while summer conditions imposed little cost to population productivity relative to benign laboratory conditions (figures 1 and 2). The thermal range of D. melanogaster is 11–32°C, with viability decreasing sharply above and below the extremes [37–39], indicating both high and low temperatures can be stressful. In the current study, average daily summer temperatures experienced by D. melanogaster populations were close to optimal, whereas winter average temperatures were close to lethal extremes, and daily lows frequently went below physiological limits for growth and reproduction (table 4). Cold temperatures may be costly for population productivity by inducing reproductive diapause [40,41] or by slowing the growth of larvae. Sufficiently slow larval growth is probably lethal under natural conditions since the food resource rots away, so it is not surprising that larval diapause has not been reported. The tropical origins of this species [42] may in part explain why conditions closer to the upper limits of heat tolerance (at or near 32°C) were less stressful. It may also account for the apparent absence of pupal diapause in this species. Other aspects of seasonality, such as photoperiod, may also contribute to differences in stress levels between summer and winter by affecting the induction of reproductive diapause in females, thus reducing population productivity [41], but it is unknown if this would differentially affect inbred flies.
In evaluating the levels of inbreeding depression observed in the laboratory versus field, we need to consider any potential bias arising from creating inbred lines in the laboratory using a fast rate of inbreeding (low effective population size). Such rapid inbreeding is predicted to purge lines of highly deleterious alleles, which could lead to conservative estimates of inbreeding depression. However, this effect is likely to be roughly equal across both field and laboratory environments since such alleles are likely to have similar lethal or near-lethal effects in both environments. Any additional effects of purging under the benign rearing environment used to create inbred lines are not expected to influence levels of inbreeding depression under field conditions in a predictable way, as it is known the effects of purging can be both environment- and trait-specific [17,43–45].
Among previous Drosophila laboratory studies, stress level was largely uncontrolled and varied as much as threefold across stress types [10,30,46,47], creating the impression that inbreeding and stress interact in an unpredictable manner because the data were analysed in terms of the categorical variables ‘stress’ versus ‘benign’ [11,48,49]. Furthermore, the expression of inbreeding depression is commonly thought to be specific to the environment and genetic background of a population [9,11,49]. However, measuring stress as a continuous variable produced a general linear relationship between stress level and stress-induced inbreeding depression [5], which conflicts with these assumptions, especially in light of the variable species and stressful environments included in these datasets. On the other hand, it is well established that global stress–response ‘programmes’ [50] involving both stress-induced and stress-repressed genes exist for many organisms, and work in both yeast and Drosophila has shown that various abiotic and biotic stress types evoke similar changes in biochemical pathways at the cellular level [51,52]. If the expression of genetic load adversely affects the ability of inbred individuals to mount fundamental core stress response mechanisms, then this could result in similar levels of inbreeding depression across many different stress types. However, the underlying genetic architecture responsible for inbreeding–stress interactions is unknown [53,54]. Although recent work in Drosophila has demonstrated a detectable molecular fingerprint of inbreeding on gene expression [46,51,55,56], it will be important to determine whether these patterns are unique to inbreeding or are in fact also seen in outbred populations exposed to higher levels of the same stress. Finally, there is increasing evidence that inbreeding depression is in part due to loci demonstrating a threshold effect, whereby neutral or beneficial alleles become deleterious under environments or at certain stress levels [4]. Therefore, in contrast to cases where many loci contribute to the expression of inbreeding depression, a strong linear relationship between stress and inbreeding depression may not hold for individual studies and stressors where few loci are involved and threshold effects of deleterious alleles could contribute to departures from linearity. Because the underlying genetic architecture of inbreeding depression is expected to be both trait- and population-specific, it is unknown how prevalent threshold effects might be.
Recognizing a general linear relationship between stress levels and the expression of inbreeding depression has implications for evolutionary and conservation biology. Understanding inbreeding–stress interactions under natural conditions is an important step in addressing the broader question of how temporal variation in environmental conditions interacts with inbreeding in small populations to affect survival and extinction risk [2,16,43,47]. Conservation biologists are often faced with managing small populations predicted to experience both increased inbreeding and environmental stress in the form of global climate change, habitat destruction and pollution. Identifying the most stressful conditions and/or times of year for these populations could aid in predicting when extinction risk is heightened owing to inbreeding–stress interactions. Both population viability simulations [8] and empirical work in Drosophila [43,47] demonstrate that interactions between stress and inbreeding negatively impact population dynamics by significantly increasing extinction risk in small populations. However, only recently have inbreeding–stress interactions been incorporated into simulations that estimate persistence times of populations [8]. From a conservation standpoint, an important next step is to quantify the effects of inbreeding–stress interactions on the persistence of wild populations by measuring both stress levels and inbreeding depression under natural conditions. Such information can then be incorporated into the development of more accurate population viability and extinction analyses of many species predicted to suffer the consequences of anthropogenically induced climate change.
Acknowledgements
We are grateful to Magdalene Moy for her involvement in conducting this experiment, and to Derek Roff, Richard Stouthamer and Senanu Pearson for providing helpful comments on earlier versions of this manuscript. This research was supported in part by an NSF DDIG awarded to L. Enders (award no. 0808416).
References
- 1.Bijlsma R., Loeschcke V. 2005. Environmental stress, adaptation and evolution: an overview. J. Evol. Biol. 18, 744–749 10.1111/j.1420-9101.2005.00962.x (doi:10.1111/j.1420-9101.2005.00962.x) [DOI] [PubMed] [Google Scholar]
- 2.Frankham R. 2005. Stress and adaptation in conservation genetics. J. Evol. Biol. 18, 750–755 10.1111/j.1420-9101.2005.00885.x (doi:10.1111/j.1420-9101.2005.00885.x) [DOI] [PubMed] [Google Scholar]
- 3.Hoffmann A. A., Parsons P. A. 1991. Evolutionary genetics and environmental stress. New York, NY: Oxford University Press [Google Scholar]
- 4.Bijlsma R., Loeschcke V. 2011. Genetic erosion impedes adaptive responses to stressful environments. Evol. App. 5, 117–129 10.1111/j.1752-4571.2011.00214.x (doi:10.1111/j.1752-4571.2011.00214.x) [DOI] [PMC free article] [PubMed] [Google Scholar]
- 5.Fox C., Reed D. H. 2011. Inbreeding depression increases with environmental stress: and experimental study and meta-analysis. Evolution 65, 246–258 10.1111/j.1558-5646.2010.01108.x (doi:10.1111/j.1558-5646.2010.01108.x) [DOI] [PubMed] [Google Scholar]
- 6.Fox C. W., Stillwell R. C., Wallin W. G., Curtis C. L., Reed D. H. 2011. Inbreeding–environment interactions for fitness: complex correlations between inbreeding depression and temperature stress in a seed-feeding beetle. Evol. Ecol. 25, 25–43 10.1007/s10682-010-9376-3 (doi:10.1007/s10682-010-9376-3) [DOI] [Google Scholar]
- 7.Imasheva A. G., Loeschcke V. 2004. Environmental stress and quantitative genetic variation. In Evolutionary conservation biology (eds Ferrière R., Dieckmann U., Couve D.), pp. 137–150 Cambridge, UK: Cambridge University Press [Google Scholar]
- 8.Liao W., Reed D. H. 2009. Inbreeding–environment interactions increase extinction risk. Anim. Conserv. 12, 54–61 10.1111/j.1469-1795.2008.00220.x (doi:10.1111/j.1469-1795.2008.00220.x) [DOI] [Google Scholar]
- 9.Armbruster P., Reed D. H. 2005. Inbreeding depression in benign and stressful environments. Heredity 95, 235–242 10.1038/sj.hdy.6800721 (doi:10.1038/sj.hdy.6800721) [DOI] [PubMed] [Google Scholar]
- 10.Bijlsma R., Bundgaard J., Boerema A. C. 2000. Does inbreeding affect the extinction risk of small populations? Predictions from Drosophila. J. Evol. Biol. 13, 502–514 10.1046/j.1420-9101.2000.00177.x (doi:10.1046/j.1420-9101.2000.00177.x) [DOI] [Google Scholar]
- 11.Hedrick P. W., Kalinowski S. T. 2000. Inbreeding depression in conservation biology. Ann. Rev. Ecol. Syst. 31, 139–162 10.1146/annurev.ecolsys.31.1.139 (doi:10.1146/annurev.ecolsys.31.1.139) [DOI] [Google Scholar]
- 12.Waller D. M., Dole J., Bersch A. J., Schoen D. 2008. Effects of stress and phenotypic variation on inbreeding depression in Brassica rapa. Evolution 62, 917–931 10.1111/j.1558-5646.2008.00325.x (doi:10.1111/j.1558-5646.2008.00325.x) [DOI] [PubMed] [Google Scholar]
- 13.Enders L. 2010. The effects of environmental stress on the expression of inbreeding depression in Drosophila. PhD dissertation, University of California, Riverside, CA [Google Scholar]
- 14.Mittler R. 2006. Abiotic stress, the field environment and stress combination. Trends Plant Sci. 11, 15–19 10.1016/j.tplants.2005.11.002 (doi:10.1016/j.tplants.2005.11.002) [DOI] [PubMed] [Google Scholar]
- 15.Bijlsma R., Bundgaard J., Boerema A. C., Van P. W. F. 1997. Genetic and environmental stress, and the persistence of populations. In Environmental stress, adaptation, and evolution (eds Bijlsma R., Loeschcke V.), pp. 193–207 Basal, The Netherlands: Birkhauser [Google Scholar]
- 16.Cheptou P.O., Donohue K. 2011. Environment-dependent inbreeding depression: its ecological and evolutionary significance. New Phytol. 189, 395–407 10.1111/j.1469-8137.2010.03541.x (doi:10.1111/j.1469-8137.2010.03541.x) [DOI] [PubMed] [Google Scholar]
- 17.Swindell W. R., Bouzat J. L. 2006. Selection and inbreeding depression: effects of inbreeding rate and inbreeding environment. Evolution 5, 1014–1022 10.1111/j.0014-3820.2006.tb01179.x (doi:10.1111/j.0014-3820.2006.tb01179.x) [DOI] [PubMed] [Google Scholar]
- 18.Hayes N. C., Winsor J. A., Stephenson A. G. 2005. Environmental variation influences the magnitude of inbreeding depression in Cucurbita pepo ssp. texana (Cucurbitaceae). J. Evol. Biol. 18, 147–155 10.1111/j.1420-9101.2004.00785.x (doi:10.1111/j.1420-9101.2004.00785.x) [DOI] [PubMed] [Google Scholar]
- 19.Keller L. F., Grant P. R., Grant B. R., Petren K. 2002. Environmental conditions affect the magnitude of inbreeding depression in survival of Darwin's finches. Evolution 56, 1229–1239 10.1111/j.0014-3820.2002.tb01434.x (doi:10.1111/j.0014-3820.2002.tb01434.x) [DOI] [PubMed] [Google Scholar]
- 20.Marr A. B., Arcese P., Hochachka W. M., Reid J. M., Keller L. F. 2006. Interactive effects of environmental stress and inbreeding on reproductive traits in a wild bird population. J. Anim. Ecol. 75, 1406–1415 10.1111/j.1365-2656.2006.01165.x (doi:10.1111/j.1365-2656.2006.01165.x) [DOI] [PubMed] [Google Scholar]
- 21.Szulkin M., Sheldon B. C. 2007. The environmental dependence of inbreeding depression in a wild bird population. PLoS ONE 2, e1027 10.1371/journal.pone.0001027 (doi:10.1371/journal.pone.0001027) [DOI] [PMC free article] [PubMed] [Google Scholar]
- 22.Falconer D. S., Mackay T. F. C. 1996. Introduction to quantitative genetics, 4th edn New York, NY: Longman [Google Scholar]
- 23.King E. G., Macdonald S. J., Long A. D. In press. Properties and power of the Drosophila synthetic population resource for the routine dissection of complex traits. Genetics. 10.1534/genetics.112.138537 (doi:10.1534/genetics.112.138537) [DOI] [PMC free article] [PubMed] [Google Scholar]
- 24.Roper C., Pignatelli P., Partridge L. 1993. Evolutionary effects of selection on age at reproduction in larval and adult Drosophila melanogaster. Evolution 47, 445–455 10.2307/2410063 (doi:10.2307/2410063) [DOI] [PubMed] [Google Scholar]
- 25.Fowler K., Whitlock M. C. 1999. The variance in inbreeding depression and the recovery of fitness in bottlenecked populations. Proc. R. Soc. Lond. B 266, 2061–2066 10.1098/rspb.2001.1931 (doi:10.1098/rspb.2001.1931) [DOI] [PMC free article] [PubMed] [Google Scholar]
- 26.Morton N. E., Crow J. F., Muller H. J. 1956. An estimation of the mutational damage in man from data on consanguineous marriages. Proc. Natl Acad. Sci. USA. 42, 855–863 [DOI] [PMC free article] [PubMed] [Google Scholar]
- 27.Kirk R. E. 1982. Experimental design: procedures for the social sciences, 2nd edn Monterey, CA: Brooks/Cole Publishing Co [Google Scholar]
- 28.Legendre P., Legendre L. 1998. Numerical ecology, 2nd edn Amsterdam, The Netherlands: Elsevier [Google Scholar]
- 29.Ferriera A. G. A., Amos W. 2006. Inbreeding depression and multiple regions showing heterozygote advantage in Drosophila melanogaster exposed to stress. Mol. Ecol. 15, 3885–3893 10.1111/j.1365-294X.2006.03093.x (doi:10.1111/j.1365-294X.2006.03093.x) [DOI] [PubMed] [Google Scholar]
- 30.Kristensen T. N., Barker J. S. F., Pedersen K. S., Loeschcke V. 2008. Extreme temperatures increase the deleterious consequences of inbreeding under laboratory and semi-natural conditions. Proc. R. Soc. B 275, 2055–2061 10.1098/rspb.2008.0426 (doi:10.1098/rspb.2008.0426) [DOI] [PMC free article] [PubMed] [Google Scholar]
- 31.Mikkelsen K., Loeschcke V., Kristensen T. N. 2010. Trait specific consequences of fast and slow inbreeding: lessons from captive populations of Drosophila melanogaster. Conserv. Genet. 11, 479–488 10.1007/s10592-009-0030-y (doi:10.1007/s10592-009-0030-y) [DOI] [Google Scholar]
- 32.Enders L., Nunney L. 2010. The sex-specific effects if inbreeding in wild-caught Drosophila melanogaster. J. Evol. Biol. 23, 2309–2323 10.1111/j.1420-9101.2010.02085.x (doi:10.1111/j.1420-9101.2010.02085.x) [DOI] [PubMed] [Google Scholar]
- 33.Sorensen J. G., Kristensen T. N., Loeschcke V. 2003. The evolutionary and ecological role of heat shock proteins. Ecol. Lett. 6, 1025–1037 10.1046/j.1461-0248.2003.00528.x (doi:10.1046/j.1461-0248.2003.00528.x) [DOI] [Google Scholar]
- 34.Lindquist L. 1986. The heat-shock response. Annu. Rev. Biochem. 55, 1151–1191 10.1146/annurev.bi.55.070186.005443 (doi:10.1146/annurev.bi.55.070186.005443) [DOI] [PubMed] [Google Scholar]
- 35.Mitrovski P., Hoffmann A. A. 2010. Postponed reproduction as an adaptation to winter conditions in Drosophila melanogaster: evidence for clinal variation under semi-natural conditions. Proc. R. Soc. B 286, 2163–2168 10.1098/rspb.2001.1787 (doi:10.1098/rspb.2001.1787) [DOI] [PMC free article] [PubMed] [Google Scholar]
- 36.Nielsen M. N., Hoffmann A. A. 1985. Numerical changes and resource utilization in orchard populations of Drosophila. Aust. J. Zool. 33, 875–884 10.1071/ZO9850875 (doi:10.1071/ZO9850875) [DOI] [Google Scholar]
- 37.Trotta V., Calboli F. C., Ziosi M., Guerra D., Pezzoli M. C., David J. R., Cavicchi S. 2006. Thermal plasticity in Drosophila melanogaster: A comparison of geographic populations. BMC Evol. Biol. 6, 67 10.1186/1471-2148-6-67 (doi:10.1186/1471-2148-6-67) [DOI] [PMC free article] [PubMed] [Google Scholar]
- 38.Hoffmann A. A. 2010. Physiological climatic limits in Drosophila: patterns and implications. J. Exp. Biol. 213, 870–880 10.1242/jeb.037630 (doi:10.1242/jeb.037630) [DOI] [PubMed] [Google Scholar]
- 39.David J. R., Araripe L. O., Chakir M., Legout H., Lemos B., Petavy G., Rohmer C., Joly D., Moreteau B. 2005. Male sterility at extreme temperatures: a significant but neglected phenomenon for understanding Drosophila climatic adaptations. J. Evol. Biol. 18, 838–846 10.1111/j.1420-9101.2005.00914.x (doi:10.1111/j.1420-9101.2005.00914.x) [DOI] [PubMed] [Google Scholar]
- 40.McKenzie J. A. 1975. The influence of low temperature on survival and reproduction in populations of Drosophila melanogaster. Aust. J. Zool. 23, 237–247 10.1071/ZO9750237 (doi:10.1071/ZO9750237) [DOI] [Google Scholar]
- 41.Saunders D. S., Henrich V. C., Gilbert L. I. 1989. Induction of diapause in Drosophila melanogaster: photoperiodic regulation and the impact of arrhythmic clock mutations on time measurement. Proc. Natl Acad. Sci. USA 86, 3748–3752 10.1073/pnas.86.10.3748 (doi:10.1073/pnas.86.10.3748) [DOI] [PMC free article] [PubMed] [Google Scholar]
- 42.David J. P., Cappy P. 1988. Genetic variation of Drosophila melanogaster natural populations. Trends Genet. 4, 106–111 10.1016/0168-9525(88)90098-4 (doi:10.1016/0168-9525(88)90098-4) [DOI] [PubMed] [Google Scholar]
- 43.Bijlsma R., Bundgaard J., Van Putten W. F. 1999. Environmental dependence of inbreeding depression and purging in Drosophila melanogaster. J. Evol. Biol. 12, 1125–1137 10.1046/j.1420-9101.1999.00113.x (doi:10.1046/j.1420-9101.1999.00113.x) [DOI] [Google Scholar]
- 44.Reed D. H., Lowe E. H., Briscoe D. A., Frankham R. 2003. Fitness and adaptation in a novel environment: effect of inbreeding, prior environment, and lineage. Evolution 57, 1822–1828 [DOI] [PubMed] [Google Scholar]
- 45.Kristensen T. N., Knudsen M. R., Loeschcke V. 2011. Slow inbred lines of Drosophila melanogaster express as much inbreeding depression as fast inbred lines under semi-natural conditions. Genetica 139, 441–451 10.1007/s10709-011-9563-3 (doi:10.1007/s10709-011-9563-3) [DOI] [PubMed] [Google Scholar]
- 46.Kristensen T. N., Dahlgaard J., Loeschcke V. 2003. Effects of inbreeding and environmental stress on fitness: using Drosophila buzzatii as a model organism. Conserv. Genet. 4, 453–465 10.1023/A:1024763013798 (doi:10.1023/A:1024763013798) [DOI] [Google Scholar]
- 47.Reed D. H., Briscoe D. A., Frankham R. 2002. Inbreeding and extinction: the effect of environmental stress and lineage. Conserv. Genet. 3, 301–307 10.1023/A:1024081416729 (doi:10.1023/A:1024081416729) [DOI] [Google Scholar]
- 48.Armbruster P., Hutchinson R. A., Linvell T. 2000. Equivalent inbreeding depression under laboratory and field conditions in a tree-hole-breeding mosquito. Proc. R. Soc. Lond. B 267, 1939–1945 10.1098/rspb.2000.1233 (doi:10.1098/rspb.2000.1233) [DOI] [PMC free article] [PubMed] [Google Scholar]
- 49.Keller L. F., Waller D. M. 2002. Inbreeding effects in wild populations. Trends Ecol. Evol. 17, 230–241 10.1016/S0169-5347(02)02489-8 (doi:10.1016/S0169-5347(02)02489-8) [DOI] [Google Scholar]
- 50.Lopez-Maury L., Marguerat S., Bahler J. 2008. Tuning gene expression to changing environments: from rapid responses to evolutionary adaptation. Nat. Genet. Rev. 9, 583–593 10.1038/nrg2398 (doi:10.1038/nrg2398) [DOI] [PubMed] [Google Scholar]
- 51.Sorensen J. G., Nielsen M. M., Kruhoffer M., Justesen J., Loeschcke V. 2005. Full genome gene expression analysis of the heat stress response in Drosophila melanogaster. Cell Stress Chap. 10, 312–328 10.1379/CSC-128R1.1 (doi:10.1379/CSC-128R1.1) [DOI] [PMC free article] [PubMed] [Google Scholar]
- 52.Alexandre H., Ansanay-Galeote V., Dequin S., Blondin B. 2001. Global gene expression during short-term ethanol stress in Saccharomyces cerevisiae. FEBS Lett. 498, 98–103 10.1016/S0014-5793(01)02503-0 (doi:10.1016/S0014-5793(01)02503-0) [DOI] [PubMed] [Google Scholar]
- 53.Kristensen T. N., Pedersen K. S., Vermeulen C. J., Loeschcke V. 2010. Research on inbreeding in the ‘omic’ era. Trends Ecol. Evol. 25, 44–52 10.1016/j.tree.2009.06.014 (doi:10.1016/j.tree.2009.06.014) [DOI] [PubMed] [Google Scholar]
- 54.Ouborg N. J., Pertoldi C., Loeschcke V., Bijlsma R. K., Hedrick P. W. 2010. Conservation genetics in transition to conservation genomics. Trends Genet. 26, 177–187 10.1016/j.tig.2010.01.001 (doi:10.1016/j.tig.2010.01.001) [DOI] [PubMed] [Google Scholar]
- 55.Kristensen T. N., Sorensen P., Kruhoffer M., Pedersen K. S., Loeschcke V. 2005. Genome-wide analysis on inbreeding effects on gene expression in Drosophila melanogaster. Genetics 171, 157–167 10.1534/genetics.104.039610 (doi:10.1534/genetics.104.039610) [DOI] [PMC free article] [PubMed] [Google Scholar]
- 56.Kristensen T. N., Sorensen P., Pedersen K. S., Kruhoffer M., Loeschcke V. 2006. Inbreeding by environmental interactions affect gene expression in Drosophila melanogaster. Genetics 173, 1329–1336 10.1534/genetics.105.054486 (doi:10.1534/genetics.105.054486) [DOI] [PMC free article] [PubMed] [Google Scholar]