Abstract
The association between an achiral copperII containing host 1 and chiral carboxylates has been expanded beyond previous studies to new chiral carboxylate guests, both α-amino acids and β-homoamino acids. The observed exciton-coupled circular dichroism (ECCD) signals for the enantiomers of each carboxylate were equal and opposite, and these signals differed in size and shape between the individual amino acids. Linear discriminant analysis (LDA) was applied as a statistical analysis technique to differentiate the amino acids, both enantioselectively and chemoselectively, giving the absolute configuration and identity of the amino acid. The identity of each of the α-amino acids and β-homoamino acids were determined independently by LDA analysis, and then the two were considered together. Each of these analyses showed good differentiation of the amino acid guests with the use of only one host molecule.
Keywords: circular dichroism, identity, pattern recognition, chirality, differentiation
Introduction
Chiral carboxylic acids are important substrates in synthetic organic chemistry. They find utility both as intermediates in the synthesis of complex natural products, as well as in synthetic drugs.[1–4] Amino acids are the building blocks of proteins and peptides,[5] and they are used as chiral starting materials and catalysts for synthesis.[6] Since only the l-enantiomer of the α-amino acids occurs naturally, the d-enantiomer, as well as both enantiomers of β-amino acids must be synthesized.[7,8]
The difference between the α- and β- amino acids is the addition of a single methylene unit (Scheme 1). Addition of this extra methylene between the carboxylic acid and the amine termini means the stereocenter may be located at either one of two different carbon atoms. When the substituent is on the carbon nearest the carboxylic acid portion it is known as a β2-amino acid, while placement of the substituent on the carbon closest to the amine is referred to as a β3-amino acid.[9] When the substituent of a β3-amino acid is the same as one of the side chains on the corresponding α-amino acid it is known as a β-homoamino acid. Thus, β3-alanine will be referred to herein as β-homoalanine. Though often overlooked because they rarely occur in nature, these β-amino acids have been incorporated into peptides that have unique structures and properties.[10,11] Significant research has been directed toward creating methods that allow for differentiation of α- amino acids, and it would be desirable to extend these methods to β-homoamino acids.
Scheme 1.
Chemical structures for a selection of three different amino acids.
Many of the methods that have been published to distinguish α-amino acids rely on indicator displacement assays (IDAs).[12–18] In this method, the amino acid guest competes with an indicator for association with a host molecule. This interaction is often non-covalent, and relies on supramolecular interactions such as metal coordination. The indicator chosen must have a different signal when bound to the host than when free in solution, and the amount of signal modulation can be used to quantify the guest present in solution.[20] The specificity has often been achieved by using hosts which contain recognition units that are known to interact with the amino acid side chains. In one example of this approach we used a copper (II) containing host in order to differentiate the hydrophobic amino acids.[12] Each of the targets was separated with good chemoselectivity.
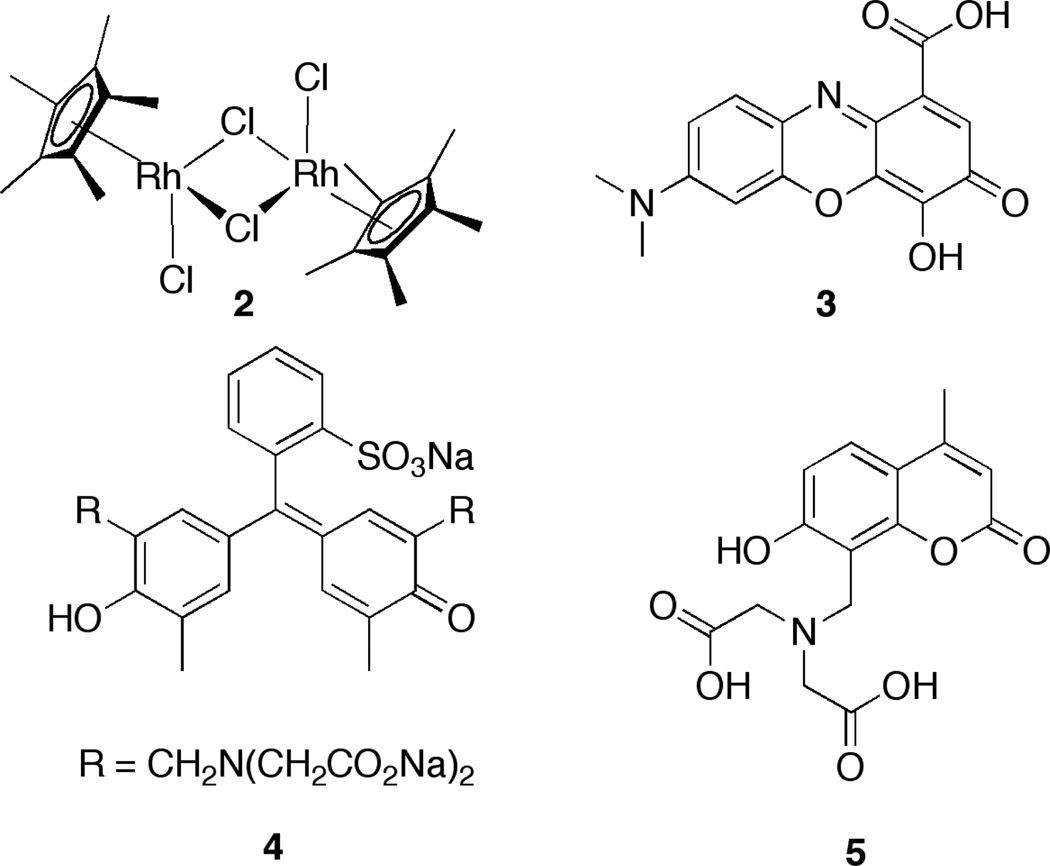
Severin et. al. constructed a sensor from several commercially available metal complexes and pH indicators (Scheme 2).[14] The amino acids were first classified into groups based on their affinity for a rhodiumIII based host. Within these groups, the guests were subjected to a series of IDAs with different indicators and pH values. The UV response at the varying pH values of the host:indicator complexes upon addition of the guest was unique for each of the amino acids, and application of linear discriminant analysis (LDA) allowed for good differentiation of the amino acids within each affinity class. The researchers were able to achieve good differentiation between the amino acids, but they did not explore enantioselective discrimination.
Sceme 2.
Components for IDA-based array to differentiate amino acids: rhodium host 2 ,and pH indicators gallocyanine (3), xylenol orange (4), and calcein blue (5).
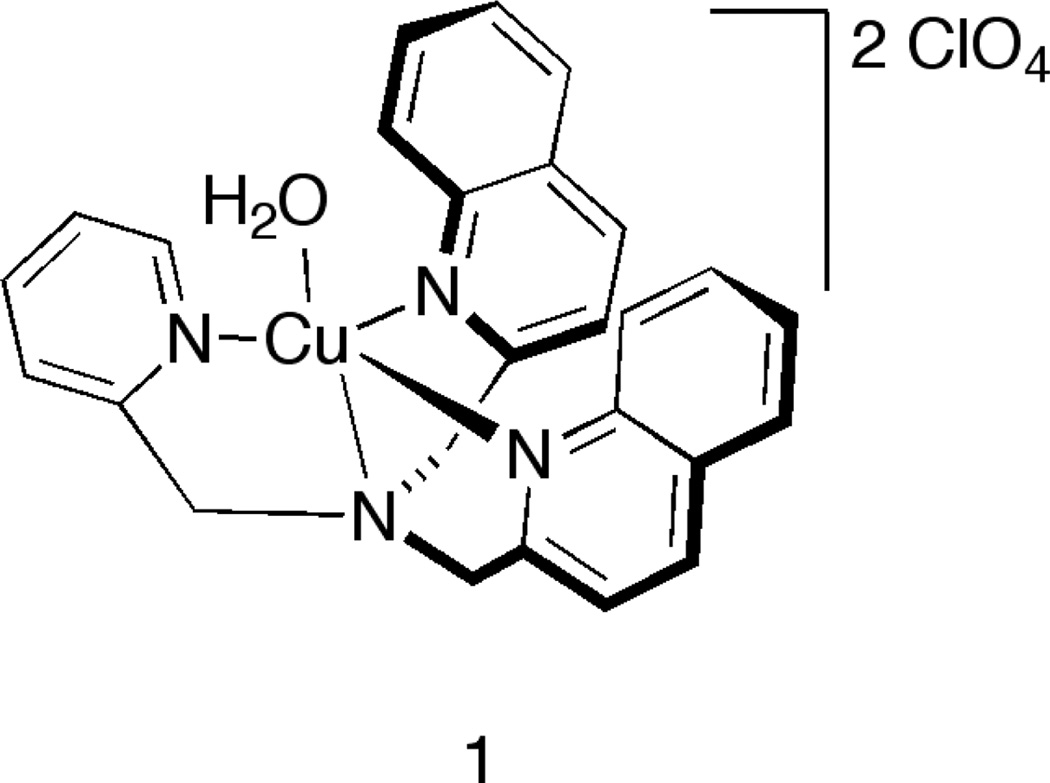
We recently reported the use of an achiral copperII containing host (1) that served as an exciton-coupled circular dichroism (ECCD) sensor for chiral carboxylic acids (Scheme 3).[15] A CD signal was observed upon binding of the chiral guest, with the absolute configuration at the stereocenter determining the direction of the sign of the observed CD signal. All of the (R)- stereocenters gave a negative first Cotton effect (CE), while the (S)- stereocenters gave a positive first CE. The magnitude of the observed signal was related to the difference in the size of the groups attached to the stereocenter, and each guest had a different shaped CD signal. Pattern recognition techniques were applied to the data, and the CD signals at various wavelengths for this single host were sufficient to give good classification of the carboxylates. The signals occur in the deep UV portion of the electromagnetic spectrum, and thus the technique may be limited if another species absorbing at this wavelength is present. Herein, we describe the application of this system to concurrently enantio- and chemoselectively discriminate α-amino acids, and extend this protocol to encompass β-homoamino acids.
Scheme 3.
Achiral [(BQPA)Cu(ClO4)2] host 1 used in these studies.
Results and Discussion
1. System Design
Our approach makes use of exciton-coupled circular dichroism (ECCD)[20] to track complex formation between the copper center of achiral host 1 and an amino acid guest. When two closely positioned chromophores are excited, their excited states can couple. In the absence of any stereochemical influence, no CD signal is observed from this excited state coupling. However, when the chromophores have a helical twist, a CD couplet with two distinct peaks is observed in the CD spectrum. These peaks are known as couplets [first Cotton effect (CE)] with the sign of the higher wavelength peak indicating the helicity of the molecule. A negative ECCD couplet is indicative of a P-type or right handed helix, and a positive couplet signifies an M-type or left handed helix.[21] This approach has proven very robust, and has been applied to assays that allow for enantiodiscrimination of several types of guests.[22–27] It is expected that host 1 rapidly interconverts between these kinds of M and P helices in solution, as has been shown for other similar molecules.[15,28,29]
There are several reasons why we chose to apply host 1 to the differentiation of amino acids. First, it can be rapidly and easily synthesized from commercially available starting materials.[30–32] As we demonstrated previously, the empty coordination site on the metal center is able to accommodate the guest carboxylate. This coordination leads to an observable ECCD signal by distorting the geometry of the complex, biasing the complex towards one of the helices preferentially. The absolute configuration of the bound guest is the source of the bias, thus allowing for the assignment of the stereocenter’s configuration. Analyte derivatization is avoided because the carboxylate is sufficient to bind to the metal center. This binding was shown to occur rapidly upon mixing, and this allows for the CD spectra to be recorded in an expedient manner. Further, this single host produced CD signals that were sufficiently different in magnitude and shape so that each individual guest was able to be resolved using pattern recognition.
2. N-t-Boc-α-Amino Acids
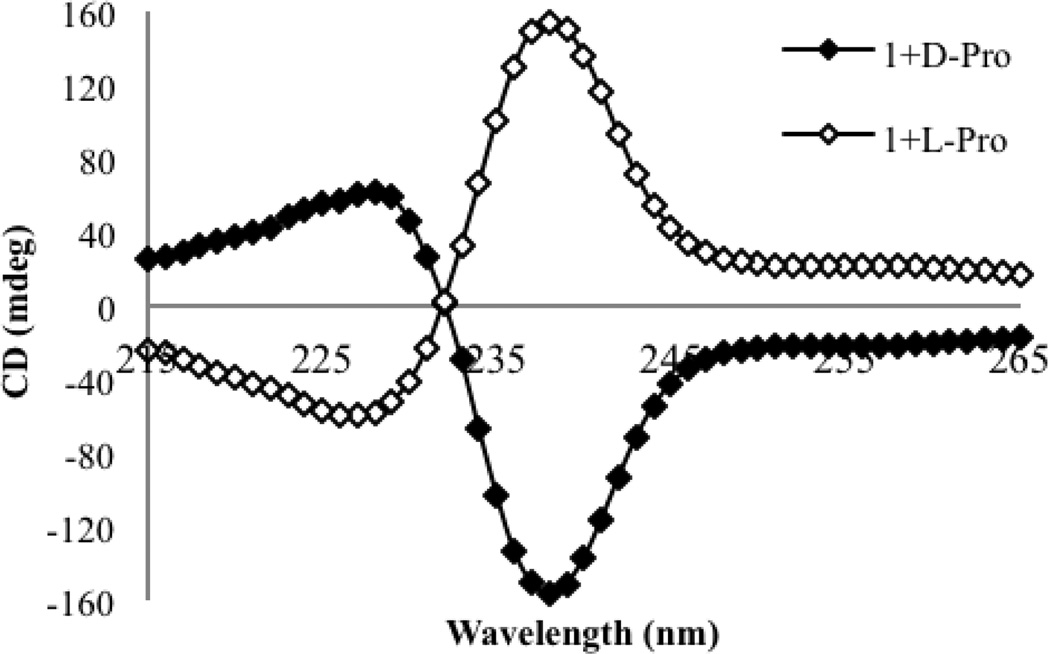
We began by recording CD spectra for solutions containing permutations of host 1 and t-Boc protected proline (Figure 1). No CD signal was observed for host 1 in the absence of a chiral guest, because the host in solution exists as a racemic mixture of the two helices. No CD signals above 230 nm were observed for the enantiomers of proline, nor solutions containing the enantiomers of proline with Cu(ClO4)2. Thus, any signals observed above 230 nm arise from the formation of a chiral complex between host 1 and the proline guest. The CD spectra were recorded for the addition of two equivalents of each enantiomer of proline to host 1. These experiments were carried out in the default buffer, comprised of 75% acetonitrile, 25% water with 20 mM HEPES buffer, whose pH had been adjusted to 7.4. At this pH the C-terminus of the amino acid exists primarily as the deprotonated species, and thus the binding is expected to be between the deprotonated carboxylate anion and the copper center of host 1.
Figure 1.
CD spectra of host 1 alone (0.5 mM), and with N-Boc-D-proline (1.0 mM) or N-Boc-L-proline (1.0 mM) in the default buffer (75% acetonitrile, 25% water with 20 mM HEPES buffer at pH=7.4.
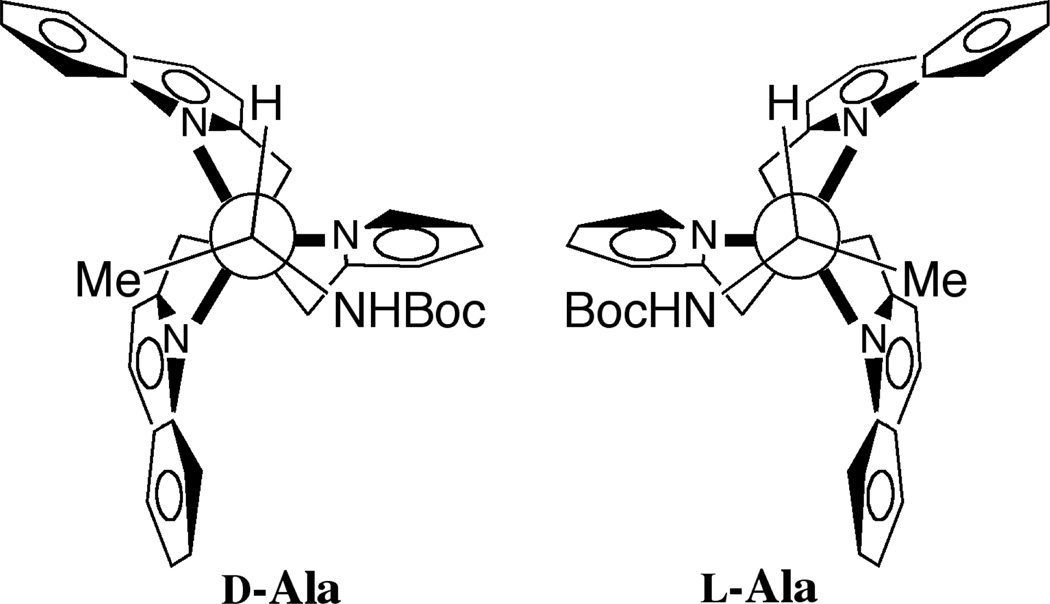
An ECCD couplet arose upon complex formation, with the first CE observed at a λmax of 238 nm. The first CE was the largest, and herein will be used to monitor the various amino acid responses. As shown in Figure 1, the d- and l- enantiomers of proline gave equal and opposite CD spectra. Enantiomeric complexes are indeed formed, with d-proline indicating a P-type helix and l-proline forming the M-type helix. A proposed model for this interaction has been included in Figure 2. This projection, looking down the Cu-N bond axis, places the groups on the stereocenter with the largest substituent toward the pyridine ring. The molecule twists away from these substituents, leading to a P-type helix for the d-isomer. This matches what was previously observed for simple carboxylates with host 1,[15] as the d-amino acids are homochiral with the (R)-enantiomers of most carboxylates that were used. This provided evidence that the amino acid guests would behave in an analogous manner to the carboxylates we had studied previously, and therefore this system behaved consistently.
Figure 2.
Model predicting the helicity of the complex when the guest binds, preferentially forming a P-type helix for D-alanine, and an M-type helix for the L-isomer.
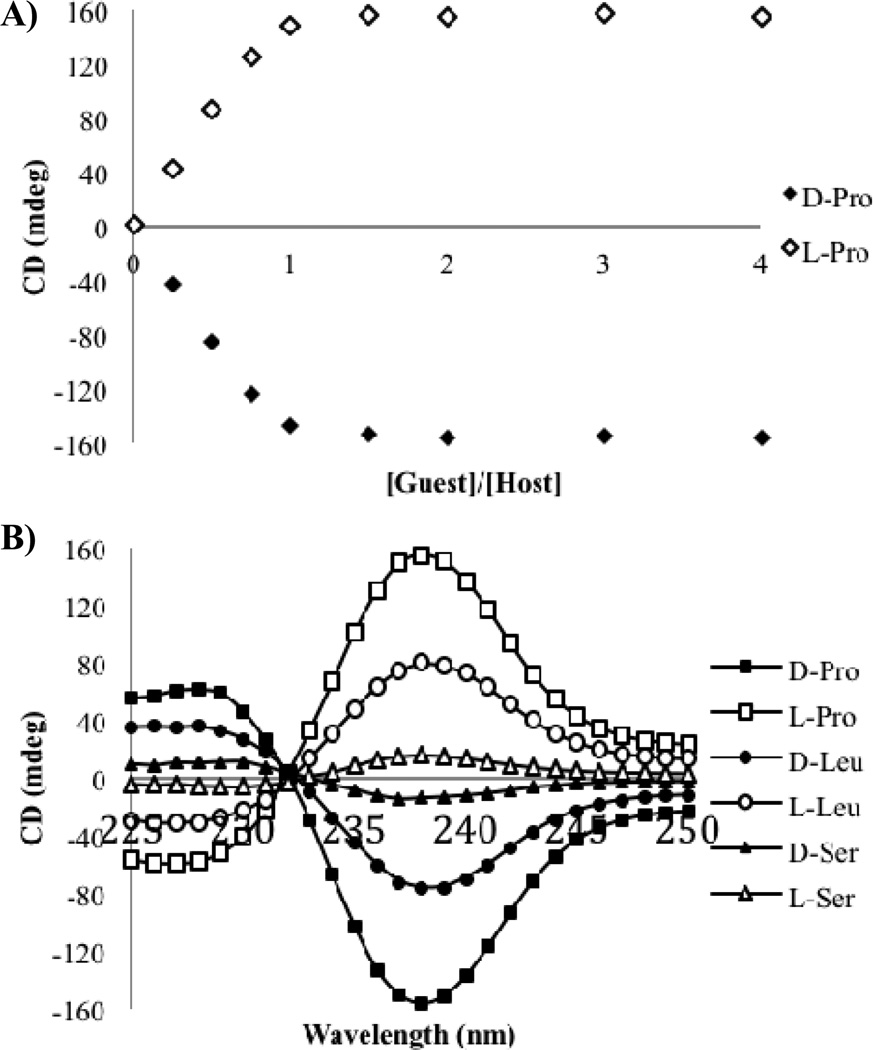
A titration was performed adding each enantiomer of t-Boc protected proline into a solution containing host 1. The CD signal saturated when one equivalent of the guest had been added (Figure 3A), and hence the CD signal above this point was no longer dependent on the concentration of guest that had been added. Differing side chains for the other amino acids were postulated to give different signals, because the magnitude of the signals is expected to vary according to the size of the groups attached to the stereocenter. To this end, CD spectra were recorded for each enantiomer of two additional amino acids, namely t-Boc protected leucine and serine. Two equivalents of each enantiomer of the amino acid guests were added to host 1 to ensure that the CD signal was in the range of concentration independence. The CD spectra for each of the sets of enantiomers are shown in Figure 3B, and were indeed equal and opposite. As expected, each amino acid had a distinct shape and magnitude. The homochiral d-amino acids all gave a negative first CE, with the l-amino acids giving a positive first CE. This analysis confirms that the absolute configuration of the amino acid guests can be assigned based on the sign of the first CE.
Figure 3.
A) CD signal at 238 nm with increasing concentrations of each enantiomer of proline (0–2 mM) into host 1 (0.5 mM) in default buffer. B) CD spectra for each indicated guest (1.0 mM) with host 1 (0.5 mM) in default buffer.
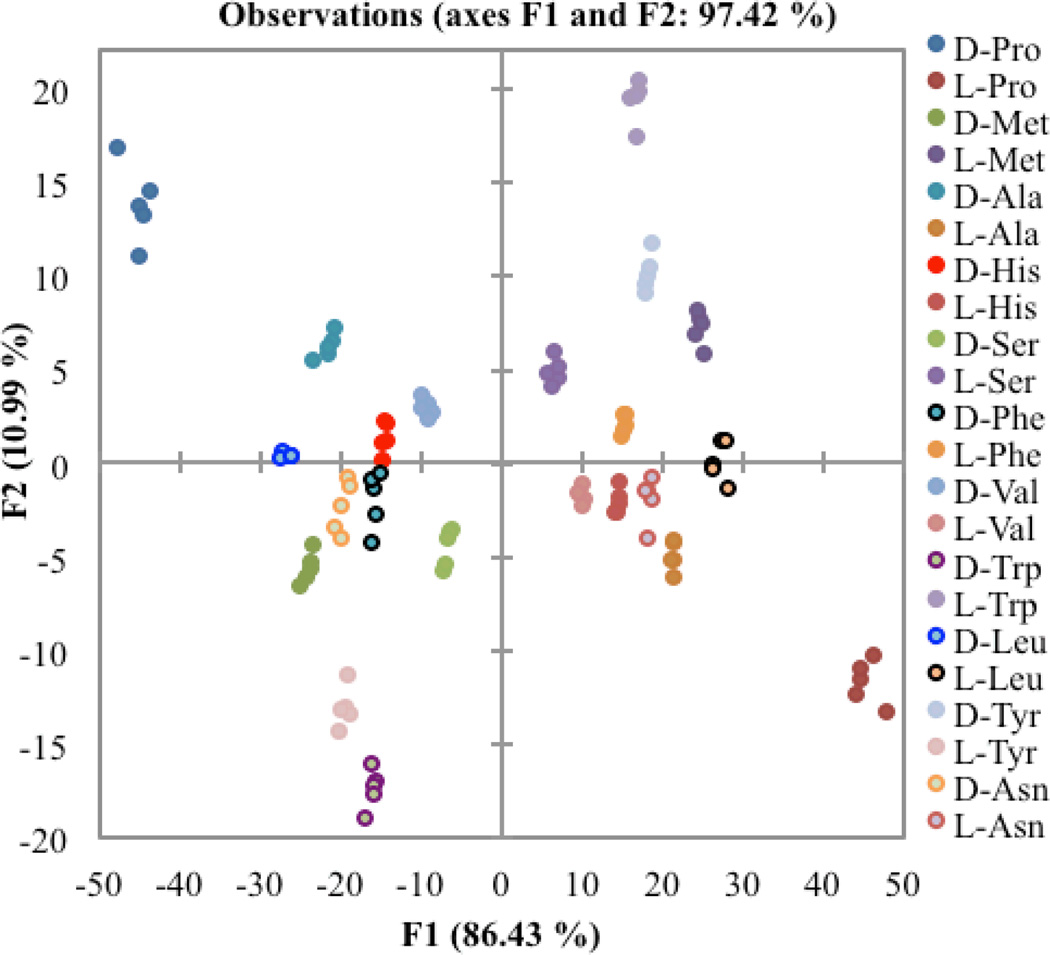
After confirming that the CD spectra were unique for these three amino acids, we expanded the scope of our study to other t-Boc protected amino acid guests. Samples were made for each enantiomer of several amino acid guests, with representative examples of several classes of amino acids. A set of five duplicate samples was prepared for each enantiomer, and the CD spectra were recorded for each sample. This was done for both enantiomers of 11 different amino acids, making up a total of 110 recorded samples. The CD signals from 235 nm to 265 nm at 1 nm intervals were used to carry out a linear discriminant analysis (LDA).[33] These wavelengths were chosen because they represent the greatest amount of variance in the dataset, and there is no spectral overlap with side chains of any of the amino acid guests. The statistical technique of LDA creates discriminant functions to minimize separation between each point in a group, while creating the maximum separation between the different groups. This is known as a supervised technique, because the identity of each data point is known when the analysis is performed.
As is shown in Figure 4, the LDA plot obtained from the CD spectra of the chiral α-amino acid guests with host 1 was able to successfully differentiate the amino acid guests. The closest groups were the enantiomers of histidine and phenylalanine. The planarity of the aromatic side chain imidazole in histidine and the phenyl ring in phenylalanine may be the cause of similarity. The F1 axis, which represents the greatest amount of between group scatter within the data set, corresponds to the magnitude of the CD signal. All of the d-amino acids appear on the left, or negative, side of the F1 axis, while the l-amino acids come on the right or positive side. The second axis, F2, shows less differentiation and can be attributed to the change in the shapes of the CD spectra. Enantiomers are found reflected through the origin in the plot.
Figure 4.
Two-dimensional LDA plot depicting the response of host 1 to each of the t-Boc protected amino acid guests.
The success of an LDA can be determined using a jack-knife analysis. This technique is a leave-one-out method, where a single point is omitted from the dataset and new functions are calculated. The point is then reassigned to a group, and this procedure is repeated for every data point. The percentage of points reassigned correctly is reported as the ability of the system to accurately predict the identity of each point. This LDA plot had a jack-knife analysis of 99%, indicating this almost all of the points were correctly identified. After successfully differentiating the α-amino acids, we turned our focus to β-chiral analytes.
3. N-t-Boc-β-Amino Acids
As mentioned previously, the β-homoamino acids have the same side chains as their α-amino acid counterparts. They differ only in a methylene homologation between the carboxylate and the stereocenter that bears the amine group. The addition of the extra methylene unit gives the molecule greater degrees of freedom, and was expected to diminish the magnitude of the CD signal because the stereocenter is one additional carbon atom from the metal center. To test this hypothesis, we started with t-Boc protected β-homoleucine as a guest.
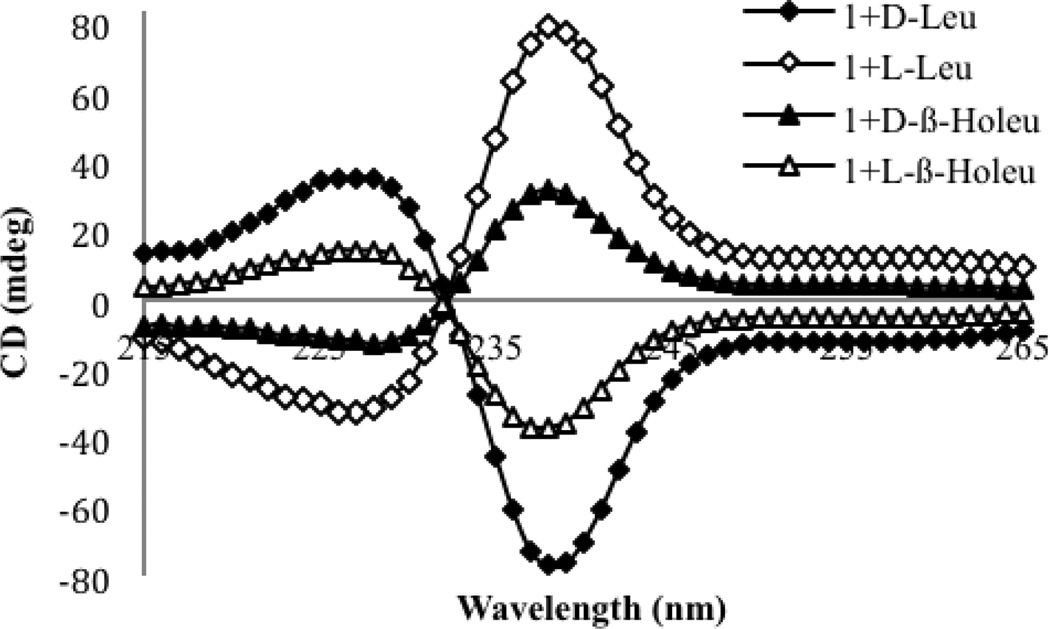
To begin, CD spectra were recorded for the addition of two equivalents of each enantiomer of β-homoleucine to host 1. An ECCD couplet analogous to the one that was observed for the α-amino acids was observed for β-homoleucine, with a λmax of 238 nm for the first CE (Figure 5). As was observed for α-amino acids, the magnitude of the first CE was larger than the second CE, and will thus be used to represent the response of each β-homoamino acid guest. The hypothesis that the size of the CD signal would be smaller as the stereocenter moves further from the binding site held true for β-homoleucine, as the signal was half as large as for leucine. The signals that were oserved for d- and l-β-homoleucine were mirror images of each other, indicating the formation of enantiomeric complexes.
Figure 5.
CD spectra of host 1 alone (0.5 mM), and with the indicated guest (1.0 mM) in the default buffer (75% acetonitrile, 25% water with 20 mM HEPES buffer at pH=7.4).
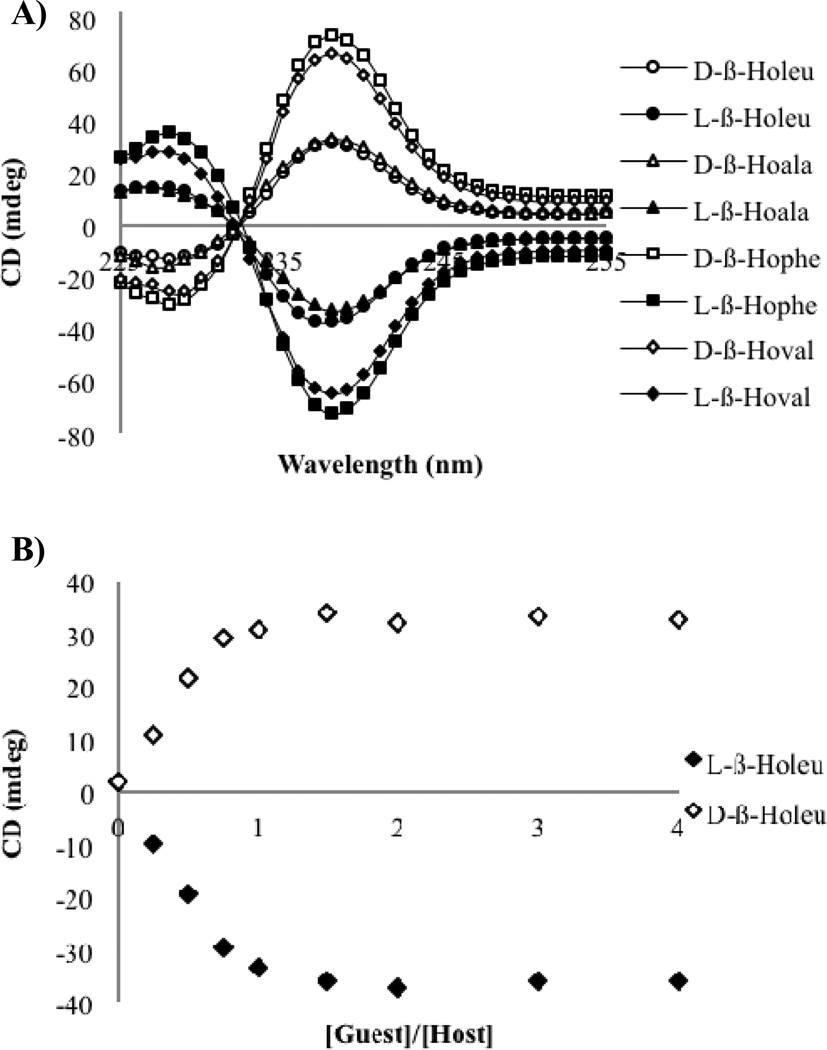
The sign of the CD signal did not follow the previous constructs, as the homochiral α- and β-homo amino acids gave different signs. The d-enantiomer of α-leucine gave a negative CD couplet, indicative of a P-type propeller, while the d-enantiomer of β-homoleucine gave a positive CD couplet indicative of an M-type propeller. Apparently the extra methylene both lowers the extent of twist, and also places the stereocenter in such a manner as to reverse the direction of the propeller twist. In order to confirm that the opposite signals were generally observed, CD spectra were recorded for both enantiomers of a series of β-homoamino acids, namely β-homoalanine, β-homophenylalanine, and β-homovaline. These amino acids were chosen because both enantiomers were commercially available. The CD spectra were recorded for each enantiomer of these guests, using two equivalents of guest relative to host 1 (Figure 6A). The CD spectra for each of the sets of enantiomers were indeed equal and opposite. The homochiral d-β-homoamino acids all gave a positive first CE, while the l-β-homoamino acids were observed to have a negative first CE. Indeed, this trend of opposite signs of the CD signals was general among the β-homoamino acids that were tested. This analysis allowed us assign the absolute configuration of the β-homoamino acids based on the sign of the first CE.
Figure 6.
A) CD signal at 238 nm with increasing concentrations of each enantiomer of β-homoleucine (0–2 mM) into host 1 (0.5 mM) in default buffer. B) CD spectra for each indicated guest (1.0 mM) with host 1 (0.5 mM) in default buffer.
In order to confirm that the CD signal at two equivalents of guest was an accurate representation of the maximum CD signal, a titration was done with t-Boc protected β-homoleucine (Figure 6B). As had been observed for the α-amino acids, the CD signal for the β-homoleucine saturated when one equivalent of guest had been added. This result indicated that the data previously recorded was representative of the maximum CD signal, and two equivalents of guest would be used for all additional studies. After confirming signal saturation, the focus shifted toward determining the identity of the β-homoamino acids using pattern recognition. The observed CD signals again varied in shape and magnitude, and an LDA analysis was performed.
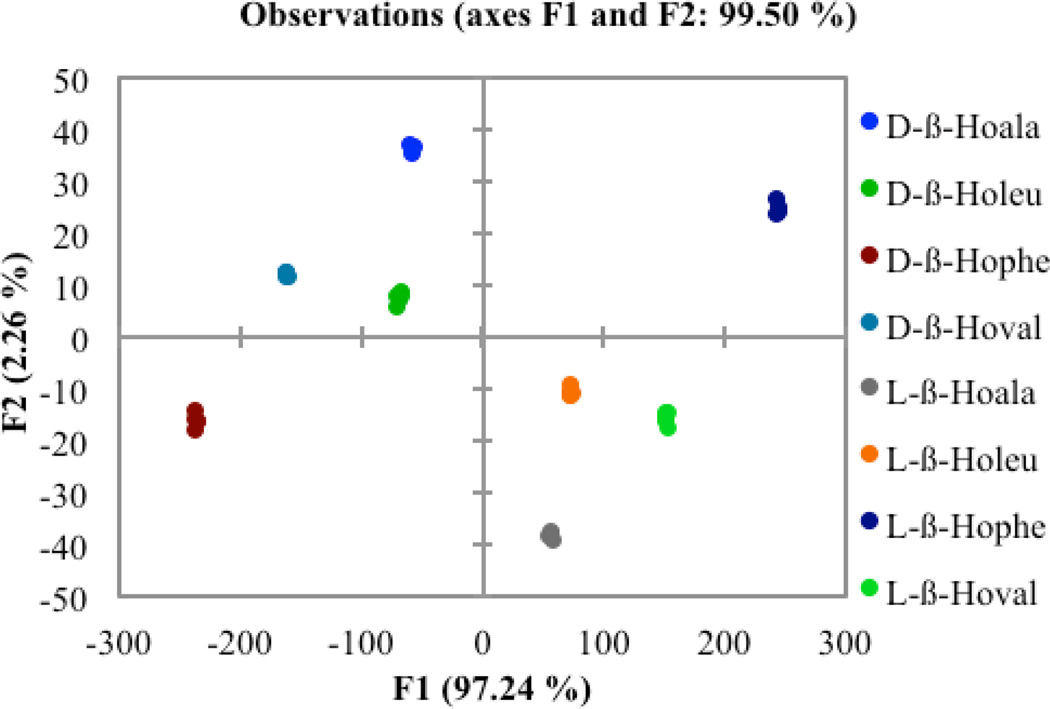
As for the α-amino acids, a set of five replicates was prepared for each enantiomer of each guest, and the CD spectra were recorded for each sample. This was done for both enantiomers of the four different amino acids, making up a total of 40 recorded samples. The CD signals from 235 nm to 265 nm were used to carry out the LDA analysis. Figure 7 shows that all amino acids were well differentiated. The F1 axis again represents the magnitude of the CD signal, and makes up almost all of the between group scatter in the dataset. In this plot the d-β-homoamino acids show up on the positive or right side of the graph, while the l-enantiomers are all on the negative side. This observation is consistent with the reversal of signs between the α- and the β-homo amino acids. The second axis, F2, does not account for a significant difference between groups in the data relative to CD amplitude, although it is greater than the within group scatter in the spectra. Once again, the enantiomers are found reflected through the origin of the plot. The data were assigned correctly in every case, with a jack-knife analysis yielding 100%.
Figure 7.
Two dimensional LDA plot depicting the response of host 1 to each enantiomer of the t-Boc protected β-homoamino acid guests.
4. Combined Amino Acid Guests
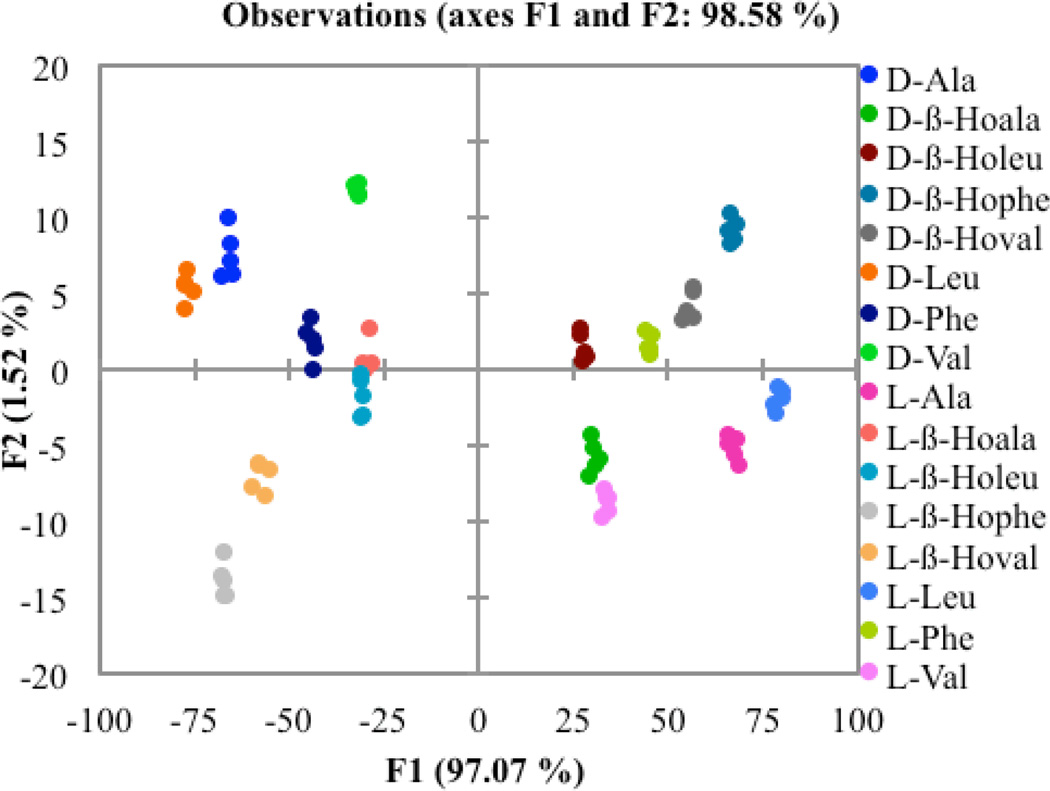
After differentiating each group of α- and β-homo amino acids separately, we applied the same LDA analysis to the cumulative data of the two types of amino acids. For this analysis, the only α-amino acids used were the ones whose β-homoamino acid counterparts had also been studied. The same data used in the previous two studies were combined for both t-Boc protected enantiomers of the α- and β-homo amino acids leucine, phenylalanine, alanine, and valine (Figure 8). Again, the variation along the F1 axis corresponds to the magnitude of the CD signals. The variation along the F2 axis can again be attributed to differing shapes of the spectra. The data are well separated, but the β-homoalanine and β-homoleucine are closer together in the combined plot than they were for the plot of just the β-homoamino acids by themselves. The shape of the curves for β-homoalanine and β-homoleucine is different enough to be separated in both situations, but the shape of the curves for the α-amino acids makes more of a contribution to the F2 axis. Validation of the data using a jack-knife analysis led to perfect assignment of each point, giving a reliability value of 100%.
Figure 8.
Two dimensional LDA plot depicting the response of host 1 to each enantiomer of the α-amino acid and corresponding β-homoamino acid guests.
Attempts to quantify the chemo- and enantioselectivities for γ-amino acids were unsuccessful, as no CD signals were observed. The stereocenter must be too far from the chromophores to influence the helical twist.
Summary
Achiral host 1 alone achieved separation of the structurally similar classes of carboxylates that make up α-amino acids and β-homoamino acids. The differentiation was a result of both the magnitude of the CD signal that arose from binding with host 1, as well as a slight difference in the shape of this signal. Homologation of the α-amino acids to make corresponding β-homoamino acids did not effect the formation of a helical structure, however moving the stereocenter further away from the carboxylate binding site led to a switch in the helical bias of the molecule, thus giving a signal with an opposite sign for homochiral α- and β-homo amino acids. Increasing the degrees of rotational freedom likely led to this observed trend. Host 1 has proven to be a very robust species that can interact with a variety of carboxylate containing molecules, and by itself differentiate several classes of amino acids with both good enantioselectivity and chemoselectivity.
Acknowledgements
We thank the National Institutes of Health (GM77437) and the Welch Foundation (F-1151) for financial support, and Professor Adam Urbach and Trinity University for use of the CD spectrometer.
Footnotes
Supporting information for this article is available on the WWW under http://www.chemeurj.org/ or from the author.
References
- 1.Nicolaou KC, Sorensen EJ. Classics in total synthesis : targets, strategies, methods. New York: VCH: Weinheim; 1996. [Google Scholar]
- 2.Nicolaou KC, Snyder SA. Classics in total synthesis II : more targets, strategies, methods. Wiley-VCH: Weinheim; 2003. [Google Scholar]
- 3.Maruoka K, Ooi T. Chem Rev. 2003;103:3013. doi: 10.1021/cr020020e. [DOI] [PubMed] [Google Scholar]
- 4.Groger H. Chem Rev. 2003;103:2795. doi: 10.1021/cr020038p. [DOI] [PubMed] [Google Scholar]
- 5.Voet DV, Voet JG. Biochemistry. 3rd ed. New York: John Wiley & Sons; 2004. [Google Scholar]
- 6.Seyden-Penne J. Chiral auxiliaries and ligands in asymmetric synthesis. New York: Wiley; 1995. [Google Scholar]
- 7.Najera C, Sansano JM. Chem Rev. 2007;107:4584. doi: 10.1021/cr050580o. [DOI] [PubMed] [Google Scholar]
- 8.Ma JA. Angew Chem Int Edit. 2003;42:4290. doi: 10.1002/anie.200301600. [DOI] [PubMed] [Google Scholar]
- 9.Lelais G, Seebach D. Biopolymers. 2004;76:206. doi: 10.1002/bip.20088. [DOI] [PubMed] [Google Scholar]
- 10.Seebach D, Overhand M, Kuhnle FNM, Martinoni B, Oberer L, Hommel U, Widmer H. Helv Chim Acta. 1996;79:913. [Google Scholar]
- 11.Appella DH, Christianson LA, Klein DA, Powell DR, Huang XL, Barchi JJ, Gellman SH. Nature. 1997;387:381. doi: 10.1038/387381a0. [DOI] [PubMed] [Google Scholar]
- 12.Folmer-Andersen JF, Lynch VM, Anslyn EV. Chem-Eur J. 2005;11:5319. doi: 10.1002/chem.200500016. [DOI] [PubMed] [Google Scholar]
- 13.Folmer-Andersen JF, Lynch VM, Anslyn EV. J Am Chem Soc. 2005;127:7986. doi: 10.1021/ja052029e. [DOI] [PubMed] [Google Scholar]
- 14.Buryak A, Severin K. J Am Chem Soc. 2005;127:3700. doi: 10.1021/ja042363v. [DOI] [PubMed] [Google Scholar]
- 15.Joyce LA, Maynor MS, Dragna JM, da Cruz GM, Lynch VM, Canary JW, Anslyn EV. J Am Chem Soc. 2011;133:13746. doi: 10.1021/ja205775g. [DOI] [PMC free article] [PubMed] [Google Scholar]
- 16.Bonizzoni M, Fabbrizzi L, Piovani G, Taglietti A. Tetrahedron. 2004;60:11159. doi: 10.1002/anie.200460036. [DOI] [PubMed] [Google Scholar]
- 17.Han MS, Kim DH. Tetrahedron. 2004;60:11251. [Google Scholar]
- 18.Ait-Haddou H, Wiskur SL, Lynch VM, Anslyn EV. J Am Chem Soc. 2001;123:11296. doi: 10.1021/ja011905v. [DOI] [PubMed] [Google Scholar]
- 19.Wiskur SL, Ait-Haddou H, Lavigne JJ, Anslyn EV. Acco Chem Res. 2001;34:963. doi: 10.1021/ar9600796. [DOI] [PubMed] [Google Scholar]
- 20.Berova N, Di Bari L, Pescitelli G. Chem Soc Rev. 2007;36:914. doi: 10.1039/b515476f. [DOI] [PubMed] [Google Scholar]
- 21.Berova N, Nakanishi K, Woody R. Circular dichroism : principles and applications. 2nd ed. New York: Wiley-VCH; 2000. [Google Scholar]
- 22.Zhang J, Holmes AE, Sharma A, Brooks NR, Rarig RS, Zubieta J, Canary JW. Chirality. 2003;15:180. doi: 10.1002/chir.10158. [DOI] [PubMed] [Google Scholar]
- 23.Zahn S, Canary JW. Org Lett. 1999;1:861. doi: 10.1021/ol990715a. [DOI] [PubMed] [Google Scholar]
- 24.Holmes AE, Zahn S, Canary JW. Chirality. 2002;14:471. doi: 10.1002/chir.10079. [DOI] [PubMed] [Google Scholar]
- 25.Holmes AE, Das D, Canary JW. J Am Chem Soc. 2007;129:1506. doi: 10.1021/ja0666147. [DOI] [PubMed] [Google Scholar]
- 26.Matile S, Berova N, Nakanishi K, Novkova S, Philipova I, Blagoev B. J Am Chem Soc. 1995;117:7021. [Google Scholar]
- 27.Matile S, Berova N, Nakanishi K, Fleischhauer J, Wood W R. J Am Chem Soc. 1996;118:5198. [Google Scholar]
- 28.Misaki H, Miyake H, Shinoda S, Tsukube H. Inorg Chem. 2009;48:11921. doi: 10.1021/ic901496s. [DOI] [PubMed] [Google Scholar]
- 29.Winschel CA, Kalidindi A, Zgani I, Magruder JL, Sidorov V. J Am Chem Soc. 2005;127:14704. doi: 10.1021/ja052397i. [DOI] [PubMed] [Google Scholar]
- 30.Wei N, Murthy NN, Chen Q, Zubieta J, Karlin KD. Inorg Chem. 1994;33:1953. [Google Scholar]
- 31.Gan W, Jones SB, Reibenspies JH, Hancock RD. Inorg Chim Acta. 2005;358:3958. [Google Scholar]
- 32.Canary JW, Holmes AE, Liu J. Enantiomer. 2001;6:181. [PubMed] [Google Scholar]
- 33.Johnson RA, Winchern DW. Applied Multivariate Statistical Analysis. Prentice-Hall: New Jersey: 1982. [Google Scholar]


