Abstract
Magnetic resonance spectroscopy (MRS) and the related technique of magnetic resonance spectroscopic imaging (MRSI) are widely used in both clinical and preclinical research for the non-invasive evaluation of brain metabolism. They are also used in medical practice, although their ultimate clinical value continues to be a source of discussion. This chapter reviews the general information content of brain spectra and commonly used protocols for both MRS and MRSI and also touches on data analysis methods and quantitation. The main focus is on proton MRS for application in humans, but many of the methods are also applicable to other nuclei and studies of animal models as well.
Keywords: Brain, magnetic resonance spectroscopy, spectroscopic imaging, spatial localization, metabolites
1. Introduction
In vivo magnetic resonance spectroscopy (MRS) of the human brain has developed rapidly since its first observation in the 1980s (1, 2). Early studies in both humans and animals focused on the 31P nucleus which allowed the measurement of energy metabolites such as phosphocreatine and ATP, as well as inorganic phosphate and phosphoesters (1). With the development of improved techniques for spatial localization and water suppression, proton MRS became more prevalent in the 1990s because of its higher sensitivity and greater convenience (since it can be performed without hardware modification on most MRI machines, unlike MRS of other nuclei) (3). While interest remains, particularly at high magnetic field strengths, in nuclei such as 31P, 23Na, and 13C (particularly for isotopically labeled and/or hyper-polarized molecules (4)), the vast majority of brain MRS studies in vivo use the proton. The remainder of this article therefore focuses on protocols for 1H-MRS.
2. Information Content of Proton MR Spectra of the Brain
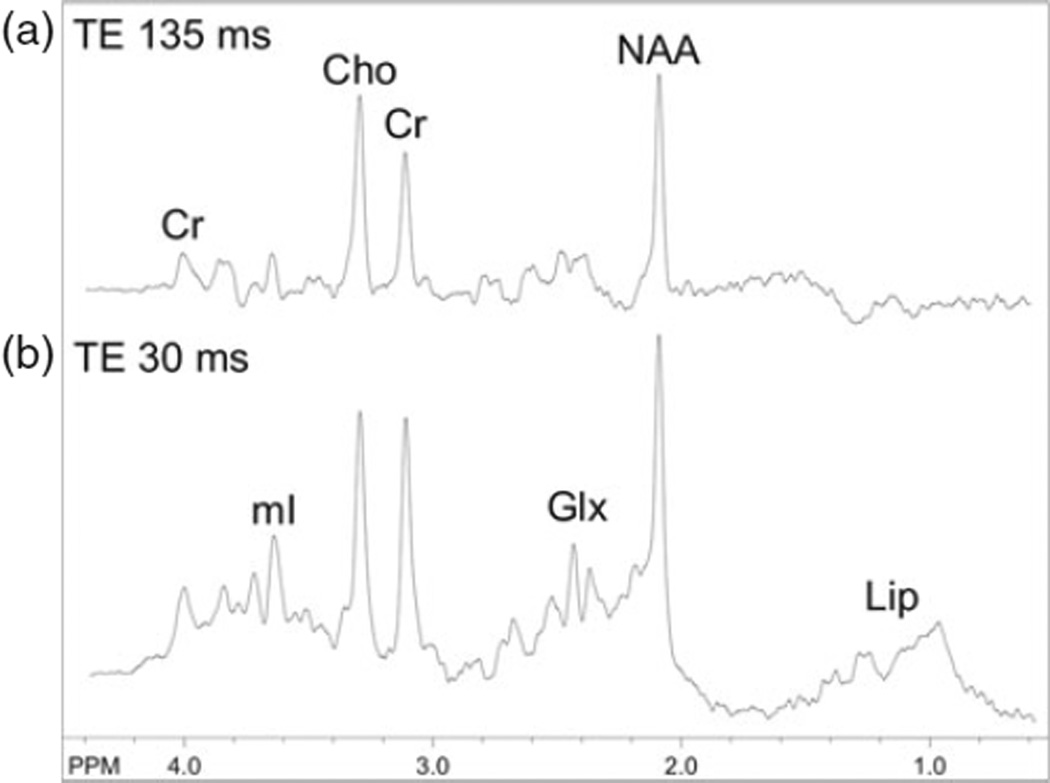
Because of its relatively low sensitivity, only small, mobile molecules which are present in millimolar quantities are generally detectable in an in vivo MR spectrum. At commonly used field strengths such as 1.5 or 3.0 T, only signals from choline (Cho), creatine (Cr), and N-acetylaspartate (NAA) are observed in normal brain at long echo times (e.g., 140 or 280 ms) (Fig. 9.1a), while compounds such as lactate, alanine, or others may be detectable in pathological conditions which increase their concentration (5–7). At short echo times (e.g., 35 ms or less) other compounds such as glutamate, glutamine, myo-inositol, as well as lipids and macromolecular resonances (Fig. 9.1b), are detectable. A summary of all compounds that have been detected in the human brain by proton MRS is given in Table 9.1, and a complete list of metabolite structures and their spectra can be found in (8). The biological significance of the major compounds is discussed below.
Fig. 9.1.
3 T PRESS brain spectra recorded from a 2-year-old boy with TE 135 ms (a) and TE 30 ms (b) at the level of the centrum semiovale with a nominal voxel size of 1.5 cm3. In the long TE spectrum, signals are present from choline (Cho), creatine (Cr), and N-acetylaspartate (NAA), while in the short TE spectrum additional signals from myo-inositol (mI), glutamate and glutamine (Glx), and lipids (Lip) are present.
Table 9.1.
Compounds detected by proton MRS in the human brain
| Compounds normally present | Compounds which may be detected under pathological or other abnormal conditions |
|---|---|
| Large signals at long TE | Long TE |
| N-Acetylaspartate (NAA) | Lactate (Lac) |
| Creatine (Cr) and phosphocreatine (PCr) | β-Hydroxy-butyrate, acetone |
| Cholines (Cho): | Succinate, pyruvate |
| Glycerophosphocholine (GPC) | Alanine |
| Phosphocholine (PC), free choline (Cho) | Glycine |
| Large signals at short TE | Short TE |
| Glutamate (Glu) | Lipids |
| Glutamine (Gln) | Macromolecules |
| myo-Inositol (mI) | Phenylalanine |
| Galactitol | |
| Small signals (short or long TE) | Exogenous compounds (short or long TE) |
|
N-Acetylaspartylglutamate (NAAG), aspartate |
Propan-1,2-diol Mannitol |
| Taurine, betaine, scyllo-inositol, ethanolamine |
Ethanol Methylsulfonylmethane (MSM) |
| Threonine | |
| Glucose, glycogen | |
| Purine nucleotides | |
| Histidine | |
|
Small signals that can be detected with the use of spectral editing techniques |
|
| γ-Amino-butyric acid (GABA) | |
| Homocarnosine | |
| Glutathione | |
| Threonine | |
| Vitamin C (ascorbic acid) | |
2.1. N-Acetylaspartate
NAA is the largest signal in the normal adult brain spectrum, resonating at 2.01 ppm, with a small and usually unresolved contribution from N-acetylaspartylglutamate (NAAG) at 2.04 ppm (9, 10). NAA is one of the most abundant amino acids in the central nervous system. It has been speculated to be a source of acetyl groups for lipid synthesis, a regulator of protein synthesis, a storage form of acetyl-CoA or aspartate, a breakdown product of NAAG (which, unlike NAA, is a neurotransmitter), or an osmolyte (11). NAA is synthesized in neuronal mitochondria, from aspartate and acetyl-coA. NAA is often referred to as a “neuronal marker,” since immunocytochemical studies have suggested that NAA is predominantly restricted to neurons, axons, and dendrites within the central nervous system (12). However, other studies have suggested that NAA may be found in nonneuronal cells, such as mast cells or isolated oligodendrocyte preparations (13–15). Overall, NAA does appear to be a good surrogate marker of neuronal health, but (as with all surrogate markers) it may sometimes change independent of neuron cell density or function.
2.2. Choline
The “choline” signal (“Cho,” 3.20 ppm) is a composite peak consisting of contributions from the trimethylamine groups of glycerophosphocholine (GPC), phosphocholine (PC), and a small amount of free choline itself (16). These compounds are involved in membrane synthesis and degradation, and they are often elevated in disease states where increased membrane turnover is involved (e.g., tumors). Glial cells have also been reported to have high levels of Cho (17, 18). Other pathological processes which lead to Cho elevation include active demyelination (19), either resulting from the degradation of myelin phospholipids primarily to GPC or perhaps due to inflammation (20). Low brain Cho has been observed in hepatic encephalopathy (21), and there is also some evidence to suggest that dietary intake of choline can modulate cerebral Cho levels (22).
2.3. Creatine
The “creatine” methyl resonance (“Cr,” 3.03 ppm) is a composite peak consisting of both creatine and phosphocreatine, compounds that are involved in energy metabolism via the creatine kinase reaction, generating ATP. A resonance from the CH2 of creatine can also be observed at 3.91 ppm. In vitro, glial cells contain a two-to fourfold higher concentration of creatine than do neurons (23). Creatine also shows quite large regional variations, with lower levels in white matter than gray matter in normal brain, as well as very high levels of Cr in the cerebellum compared to supratentorial regions (24).
2.4. Lactate
The lactate resonance (a doublet with a 7 Hz coupling constant centered at 1.31 ppm) is usually not detectable in the brain under normal conditions. However, lactate is often detected by MRS in pathological conditions such as acute hypoxic (25) or ischemic (5, 26) injury, or in brain tumors (27) or mitochondrial diseases (7, 28).
2.5. myo-Inositol
One of the larger signals in short echo time spectra occurs from myo-inositol (mI) at 3.5–3.6 ppm. mI is a pentose sugar, which is part of the inositol triphosphate intracellular second messenger system. Glial cells in vitro have been shown to contain higher levels of mI than neurons (29, 30). mI has been reported to be reduced in hepatic encephalopathy (31), and increased in Alzheimer’s dementia (32) and demyelinating diseases (33).
2.6. Glutamate and Glutamine
Glutamate (Glu) is the most abundant amino acid in the brain and is the dominant neurotransmitter (34). At 1.5 T, there is almost complete overlap of Glu and glutamine (Gln), and they are detected as a composite “Glx” peak (21). At higher fields (3.0 T and above), Glu and Gln become better resolved and can be quantified individually with good accuracy using appropriate spectral analysis techniques (35). Glu has been found to be elevated inMS plaques (36), and elevated cerebral Gln is commonly observed in patients with liver failure (for example, hepatic encephalopathy (31) and Reye’s syndrome (37)).
2.7. Less Commonly Detected Compounds
Approximately 25 additional compounds have been detected in proton spectra of the human brain (Table 9.1). Some of these compounds are present in the normal human brain, but are difficult to detect routinely because they are very small and/or have overlapping peaks. Some examples of these compounds include NAAG, aspartate, taurine, scyllo-inositol, betaine, ethanolamine, purine nucleotides, histidine, glucose, and glycogen (38). Other compounds are yet more difficult to detect and require the use of “spectral editing” techniques (see later), because in conventional spectra they overlap and are obscured by much larger signals. Examples of compounds requiring spectral editing to be measured include γ-amino-butyric acid (GABA) and glutathione (GSH) (39, 40).
Some compounds are only detected under disease or other abnormal conditions. Examples include the ketone bodies β-hydroxy-butyrate and acetone (41, 42) in patients who are ketotic and other compounds such as phenylalanine (in phenylketonurea (43)), galactitol, ribitol, arabitol in “polyol disease” (44), and succinate, pyruvate, alanine, glycine, and threonine in various disorders.
Exogenous compounds which are able to cross the blood–brain barrier may be detected by proton MRS; examples include the drug delivery vehicle propan-1,2-diol (45), ethanol (46), and methylsulfonylmethane (MSM) (47).
Histidine, homocarnosine, and the amide resonance of NAA are low signal intensity compounds downfield from water which can be detected by the use of short echo times, appropriate water suppression methods, and high magnetic field strengths. Using oral loading of histidine, Vermathen et al. were able to estimate brain pH from the chemical shift difference of the C2 and C4 resonances of the imidazole side chain of histidine (48); similarly, Rothman et al. were able to use the imidazole resonances of homocarnosine to estimate brain pH in epilepsy patients who were receiving vigabatrin (49). The rate of exchange of the NAA amide protons with water is also pH sensitive and can be used to estimate brain pH (50).
3. Spatial Localization Techniques
3.1. Single-Voxel Techniques
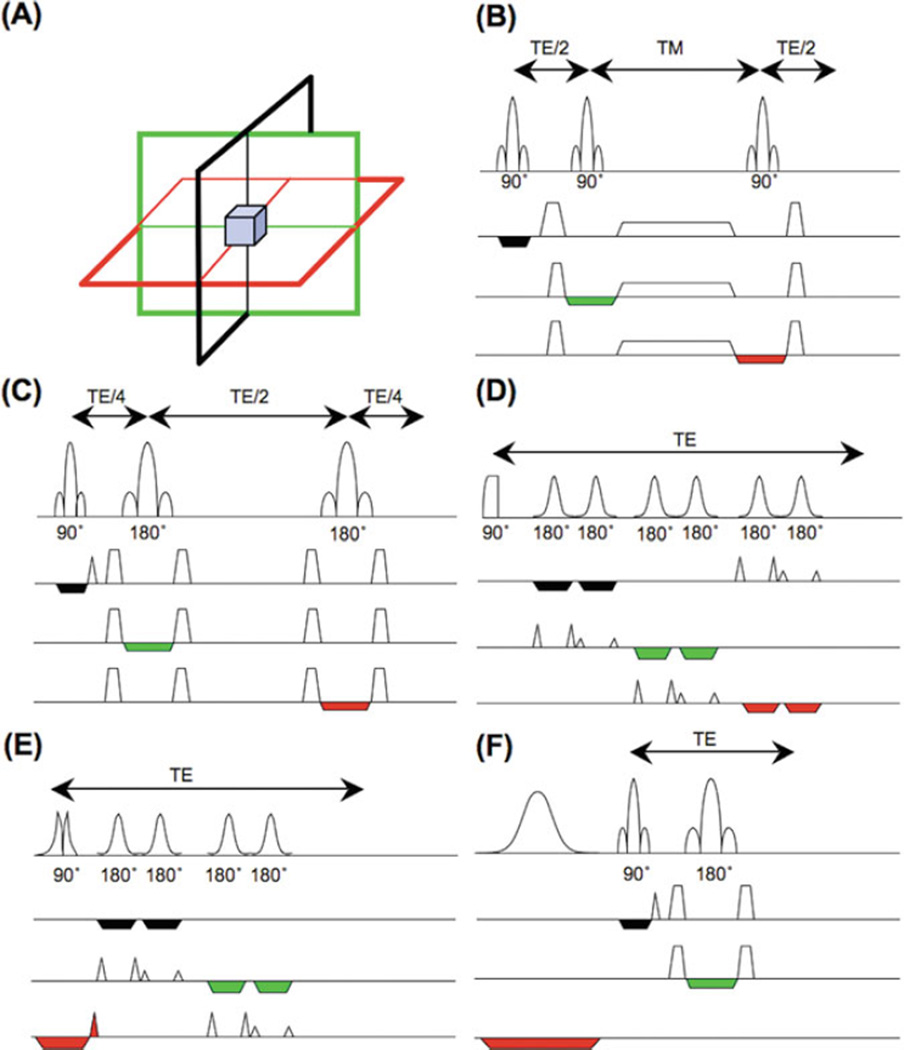
Nearly all single-voxel localization techniques use three orthogonal slice-selective pulses to select a signal from the region (“voxel”) where they intersect (Fig. 9.2a). Signals from outside the voxel are removed by the use of “crusher” field gradient pulses, alternating the phases of the slice-selective pulses and receiver (‘phase-cycling’), and the use of outer-volume suppression pulses (51, 52) (53, 54). Typical voxel sizes for human brain spectroscopy are 4–8 cm3.
Fig. 9.2.
Single-voxel localization techniques: (a) spatial localization is achieved by collecting signals from the intersection of three slice-selective RF pulses applied in orthogonal directions; (b) the STEAM sequence, consisting of three 90° slice-selective pulses; (c) the PRESS sequence, consisting of a slice-selective 90° excitation pulse and two 180° slice-selective refocusing pulses; (d) the LASER sequence, which uses a non-slice-selective adiabatic half-passage excitation pulse, followed by three pairs of hyperbolic secant 180° refocusing pulses; (e) the semi-LASER sequence, which uses a slice-selective 90° excitation pulse and two pairs of hyperbolic secant 180° refocusing pulses; (f) the “SPECIAL” pulse sequence, which uses an alternating slice-selective 180° inversion pulse (every second average) in combination with a 90°–180° bar-selective spin echo.
The “STEAM” sequence (52, 55) (Fig. 9.2b) uses three 90° pulses to form a “stimulated echo,” while the “PRESS” sequence (Fig. 9.2c) uses one 90° and two 180° refocusing pulses to create a spin echo. STEAM and PRESS have been compared in detail (56); perhaps the biggest difference is that the spin-echo-based PRESS sequence has twice the signal compared to STEAM and is therefore often preferred. However, advantages of STEAM include better slice profiles and higher bandwidth of the 90° pulses, lower RF power requirements, and the ability to obtain shorter echo times. In this regard, STEAM may be particularly advantageous for brain MRS at high field strengths (e.g., above 3 T (35)). Short TE STEAM may be preferable for observing resonances with shorter T2s (57), while long TE PRESS (with its superior SNR) should generally be used for resonances with longer T2s (such as Cho, Cr, NAA, and lactate).
In vivo MRS performed at high field strengths (e.g., 3 T or higher) is associated with additional technical challenges. For instance, uniform RF transmit (B1) fields become difficult to achieve because of wavelength effects in volume RF coils (58) or when using inhomogeneous surface coils for excitation. In either case, it may be difficult to achieve the desired flip angles in PRESS or STEAM, and the flip angles may vary inside the voxel, resulting in signal loss. To address these problems, adiabatic excitation or refocusing pulses have been implemented in techniques such as “LASER” (localization by adiabatic selective refocusing; 59, 60) (Fig. 9.2d) or its simplified version “semi-LASER” (61, 62) (Fig. 9.2e). The LASER sequence consists of a non-slice-selective adiabatic half-passage 90° pulse for excitation and three pairs of hyperbolic secant (HS) refocusing pulses in three directions for localization. Since a single HS 180° pulse with a slice-selection gradient produces a large first-order phase variation across the spectrum, two consecutive HS pulses are needed to cancel it out (63, 64). The LASER sequence produces a more uniform excitation profile and takes advantage of the large bandwidths of the adiabatic HS pulses to reduce chemical shift displacement errors. However, the large number of RF pulses used in LASER results in higher RF power requirement and longer TE compared to conventional localization sequences. The semi-LASER sequence consists of a non-adiabatic 90° slice-selective pulse and two pairs of adiabatic HS pulses for refocusing as in LASER; while some insensitivity to B1 inhomogeneity is lost, this sequence does have reduced RF power and can achieve shorter TE than LASER.
At very high fields for human MRS such as 7 T, apparent metabolite T2 relaxation times are significantly shorter than at lower field strengths, and it is therefore desirable to minimize the TE of the localization sequence as much as possible. A localization technique dubbed “SPECIAL” (spin-echo full-intensity acquired localized spectroscopy; 65) () combines desirable features such as the full signal intensity of PRESS and the shorter TE of STEAM. The sequence consists of a slice-selective inversion pulse followed by a spin-echo sequence, with each pulse applied in a different direction (Fig. 9.2f). The sequence collects full-intensity signal from a 1D strip-like volume defined by the intersection of the selected slices of the 90° and 180° pulses. The slice-selective inversion pulse is applied to every other TR (similar to what is used in the “ISIS” experiment (66)) so that a minimum of two scans are required to achieve full spatial localization. This sequence is a promising technique to investigate compounds with short T2s in vivo.
3.2. Multiple-Voxel (MRSI) Techniques
While single-voxel MRS can be performed quickly and easily in most parts of the human brain, it provides no information on the spatial variations of metabolites and is generally limited to one or two brain regions in most clinical studies. In contrast, MRSI is usually more time-consuming but can be used to measure multiple-voxel locations simultaneously.
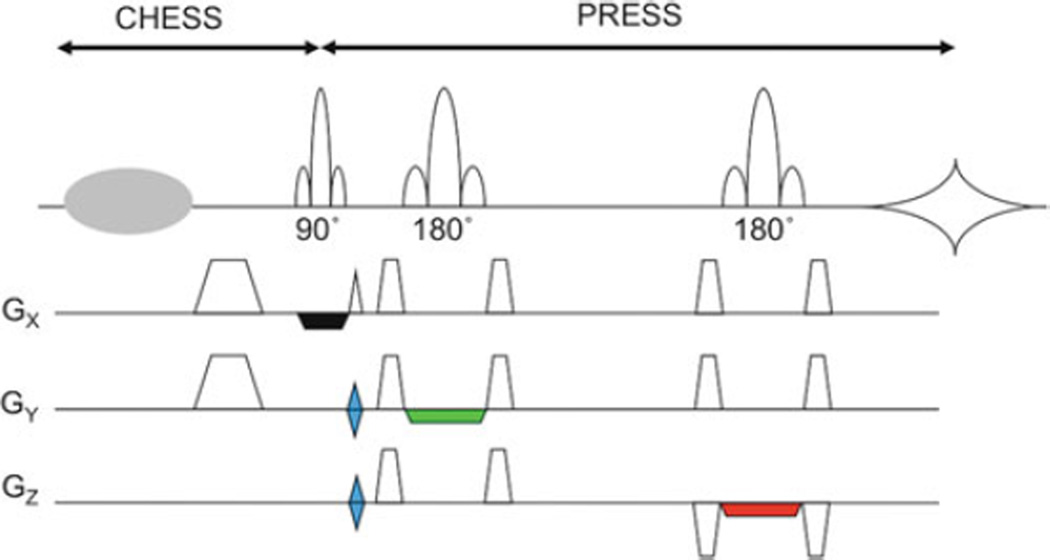
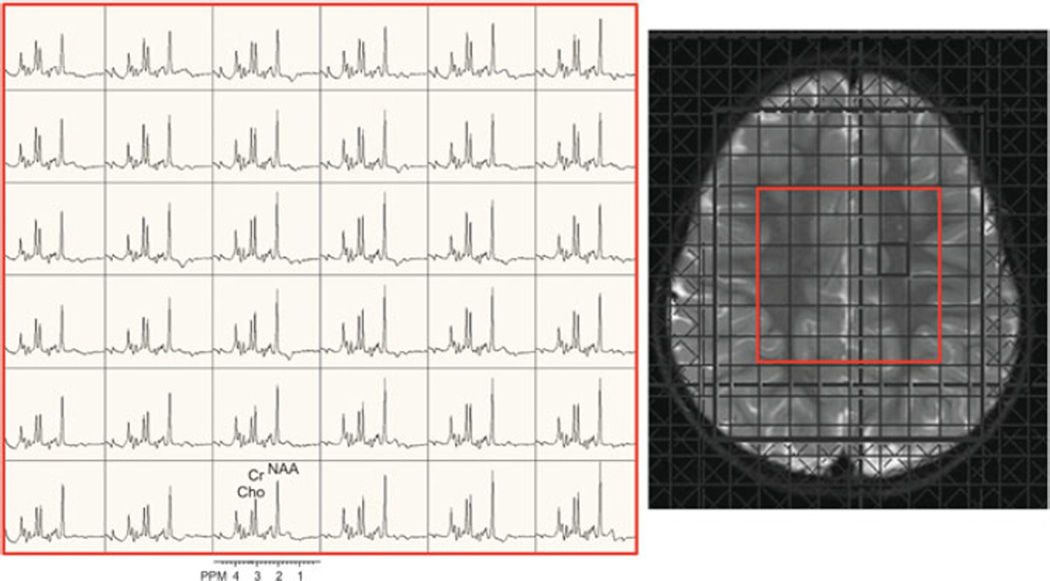
Most often, MRSI is based on signal excitation of a restricted region using the PRESS sequence in combination with phaseencoding in two directions (Fig. 9.3) (55). This allows B0 field homogeneity to be optimized on the desired region of interest, limits the number of phase-encoding steps needed for a given spatial resolution, and avoids exciting lipid signals from the scalp. Other methods for lipid suppression are discussed later. Figure 9.4 shows the results of this sequence from a 3-year-old girl with an idiopathic developmental delay.
Fig. 9.3.
2D-PRESS-MRSI pulse sequence. A PRESS sequence is used to excite a large volume of brain tissue while excluding signal from lipid in the scalp and/or regions of poor field homogeneity, and then phase-encoding gradients (in blue, GY and GZ) are used to localize spectra from regions within the excited region. A CHESS prepulse and crusher gradient are applied for water suppression. Crusher gradients applied around the 180° refocusing pulses are also shown.
Fig. 9.4.
2D-PRESS-MRSI scan (3 T, TR/TE 1,700/135 ms, nominal voxel size 1.5 cm3) in the axial plane of a 3-year-old girl with developmental delay. The central 6×6 spectra are shown (indicated in red on the localizer T2-weighted MRI).
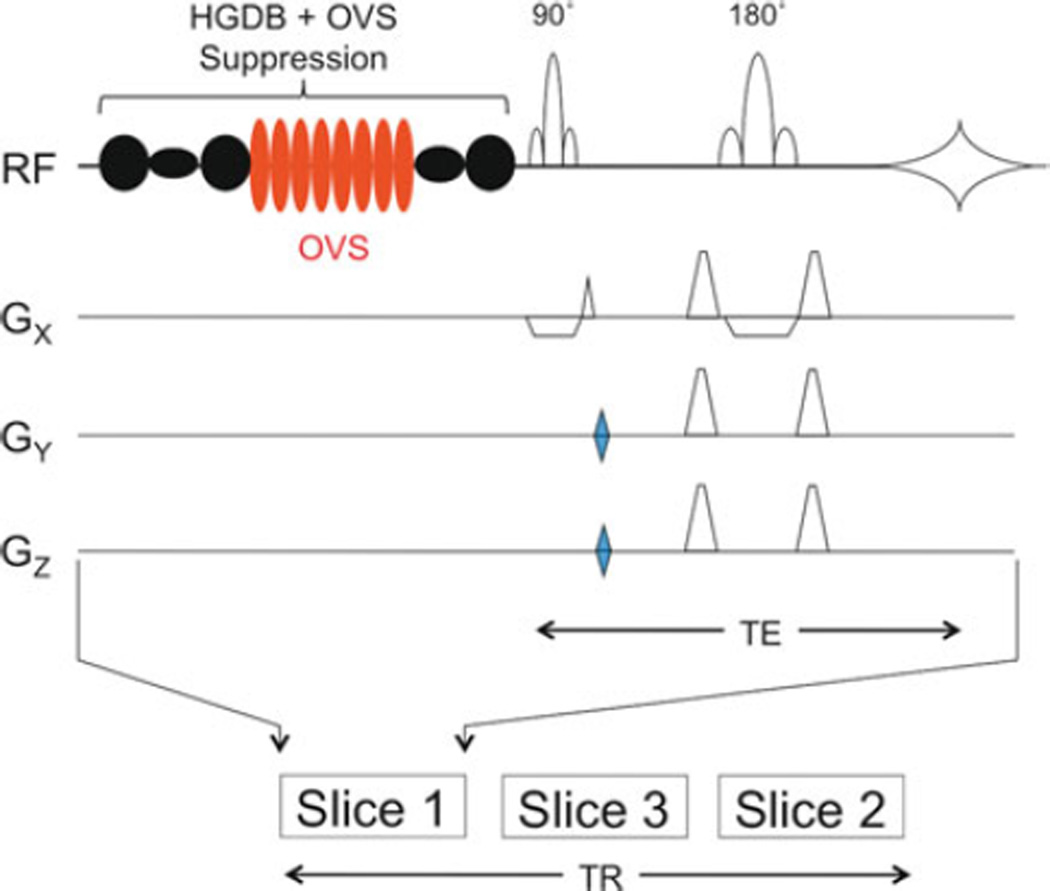
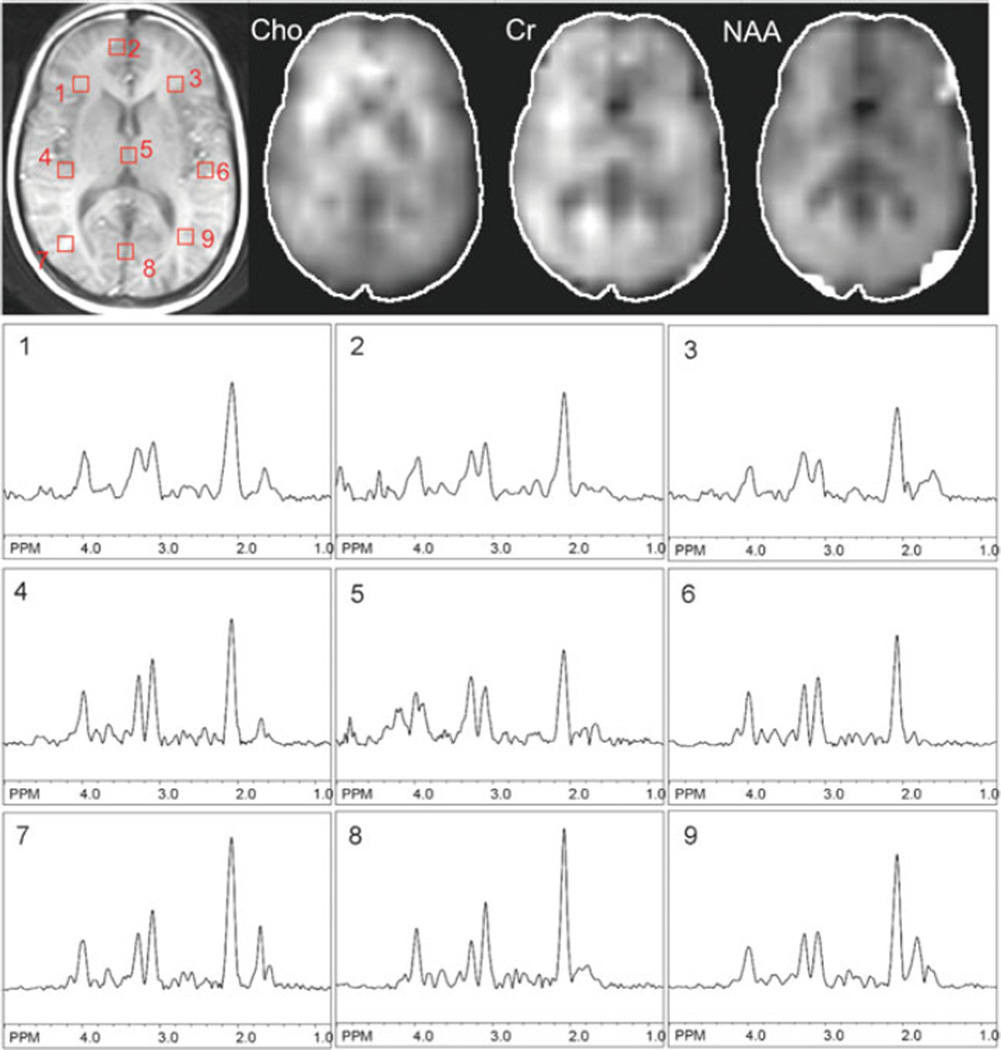
However, PRESS-MRSI also has shortcomings, including unreliable spectra at the edges of the PRESS box due to imperfect slice profiles of the 180° pulses, the inability to perform multislice acquisitions (although 3D is possible), and the difficulty in covering to the edges of the brain because of the rectangular shape of the PRESS excitation. An alternative approach is a slice-selective spin-echo sequence that excites a whole transverse slice (Fig. 9.5) and which can be used in a multi-slice mode (53). Preceding the spin-echo sequence there are usually multiple, carefully placed OVS pulses to suppress the lipid signals from the scalp (53), as well as the usual water suppression pulses. Figure 9.6 shows an example of one slice from a multi-slice 2D MRSI data set from a normal volunteer. To minimize artifacts due to residual water and lipid and also field inhomogeneity, MRSI with large spatial coverage is typically performed at long echo time (e.g., 140 or 280 ms).
Fig. 9.5.
A multi-slice 2D-MRSI pulse sequence. A slice-selective spin echo is preceded by an optimized water and lipid suppression scheme (“HGDB”), including outer-volume suppression (OVS) pulses (8, indicated in red) for spatial suppression of scalp signals (103). 2D phase-encoding gradients (blue) are applied on GY and GZ. In this example, three slices are collected within one repetition time (TR). Gradients associated with the water and lipid suppression are omitted for clarity.
Fig. 9.6.
Example data from one slice (at the level of the lateral ventricles) of a multi-slice 2D-MRSI data from a normal human subject recorded at 3.0 T using the pulse sequence of Fig. 9.5. TR 2.5 s, TE 140 ms, nominal voxel size 0.65 cm3. In addition to the T1-weighted MRI scan, spectroscopic images of choline, creatine, and N-acetylaspartate and selected spectra from the left and right hemispheres are shown.
The multi-slice technique can allow a sufficient number of slices to cover the whole brain but the resulting scan time can be too long with conventional phase-encoding techniques. Specifically, the length of the pulse sequence for each slice is in the range of 0.5–1.0 s including all RF pulses and data acquisition window, which needs to be long enough to gain enough spectral resolution. Four or five such slices interleaved can result in a TR prohibitively long that causes long scan times (67). 3D-PRESS-MRSI, on the other hand, can also lead to very long scan times if large brain coverage is prescribed. The number of phase-encoding steps (N) is equal to the field of view (FOV) divided by the desired spatial resolution Δ (N = FOV/Δ). Therefore, in order to minimize the scan time (i.e., minimize N) without reducing a desired spatial resolution, it is important to prescribe a FOV as small as possible constrained only by the dimensions of the object to be imaged. In the case of brain imaging, the left–right FOV should be smaller than the anterior–posterior, since the brain (usually of an oval shape) is smaller in this dimension (68). In general, scan time can be reduced by an additional 25–30% with a reduced FOV in the left–right direction. Generally, if large FOVs and high resolutions are sought in all three dimensions, fast MRSI techniques are required to maintain clinically reasonable scan times.
3.3. Fast MRSI Techniques
A number of different approaches for fast MRSI have been developed and reviewed previously (69). Some of the more frequently used methods are discussed here.
3.3.1. “Turbo” or Fast Spin-Echo MRSI
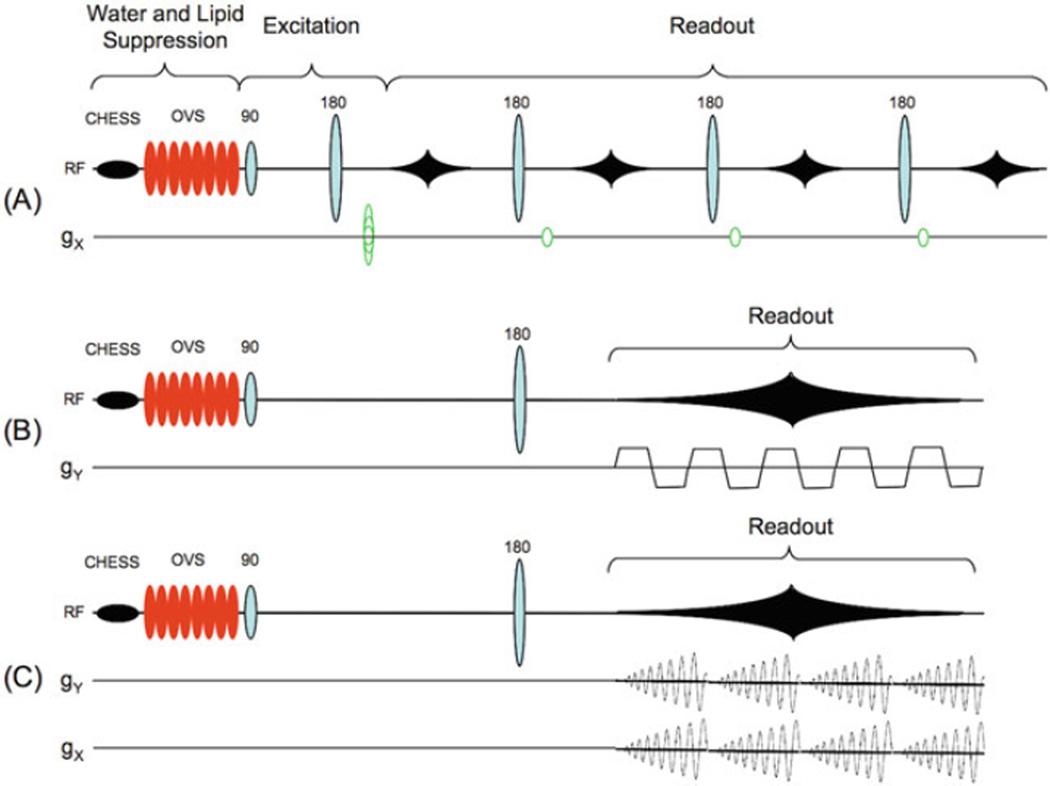
One of the earliest approaches to fast MRSI was to use a multiple-echo acquisition, with each echo having its own phase-encoding gradient (70) (Fig. 9.7a). Typically 3 or 4 echoes are used, reducing scan time by a factor of 3 or 4 if the same repetition time (TR) is used as in a single-echo experiment. This approach does suffer from several limitations, however: the spectral resolution is limited by having to keep each echo readout short, while the later echoes suffer from reduced signal due to T2 relaxation. Compounds with short T2 relaxation times cannot be observed with this technique. For multiple echoes, the minimum TR is generally longer than for a single-echo acquisition, so that time-savings may be less than expected. For these reasons, multi-echo MRSI has only seen limited adoption in practice, although it has been applied to studies of brain tumors (71).
Fig. 9.7.
Different readout strategies for fast MRSI pulse sequences. In the examples shown here, all three sequences use spin-echo excitation preceded by CHESS water suppression and OVS lipid suppression, although other excitation and suppression sequences can be used. (a) In fast spin-echo (“turbo”) MRSI, multiple spin echoes are acquired, each one with its own phase-encoding gradient; (b) in echo-planar spectroscopic imaging (EPSI), an oscillating read gradient is applied during data acquisition; and (c) in spiral-MRSI, two oscillating read gradients are applied during data acquisition. For full 3D-encoding, conventional phase-encoding gradients can be applied in the remaining directions.
3.3.2. Echo-Planar (EPSI) and Spiral-MRSI
In EPSI, an oscillating read gradient is applied during data acquisition so that both spectral and spatial information are collected simultaneously (72) (73). The oscillating read gradient can be viewed as repeatedly collecting one line of k-space at different time points. Conventional phase-encoding is then applied in the other one or two directions to extend the experiment to either two or three spatial dimensions, respectively (Fig. 9.7b). The EPSI readout reduces the number of phase-encoding steps by an order of magnitude compared to conventional MRSI, thereby achieving a large scan time reduction. EPSI-encoding can be implemented as 2D multi-slice with spin-echo excitation, or 3D with a PRESS or spin-echo thick slab excitation (74, 75).
EPSI is one of the fastest acquisition techniques for MRSI, but does have some limitations. High-performance gradient systems are required, and any imbalances between positive and negative gradient lobes can lead to “ghost” artifacts in the metabolic images. This problem can be addressed by processing the readout lines of two opposite directions separately, with subsequent combination of the two data sets after spatial transformation. This solution, however, reduces the available spectral bandwidth, which may already be quite low in EPSI (76). SNR may also be slightly lower than conventional MRSI recorded in the same scan time depending on the readout gradient waveform and whether ramp sampling is used or not. Because of its speed and much improved post-processing methods, EPSI (also called “PEPSI” (proton EPSI)) has been gaining popularity in whole-brain 3D MRSI (75) and has also been used to study various brain pathologies (77, 78).
Spiral-MRSI is similar to EPSI in that read gradients are applied during data acquisition (Fig. 9.7c). In spiral-MRSI, however, gradient waveforms in 2D are applied so that k-space data are sampled from the center to the edge along a spiral trajectory. These gradient waveforms are repeated several times concurrent with the evolution of the readout time in one TR. The k,t-space can be filled using multiple shots to satisfy the desired FOV and spatial and spectral resolutions (79). Post-processing of spiral-MRSI data usually starts with a “regridding” procedure (80) where raw data are resampled onto a Cartesian k-space grid by interpolation, after which conventional MRSI processing by Fourier transformation can be done. Spiral-MRSI has some unique advantages over EPSI, including the ability to manipulate the point-spread function, scan time, and SNR by varying the sample spacing in k-space with a variable density trajectory (81, 82). In addition, if the center of k-space is collected at the beginning of every spiral readout, it is possible to correct errors in phase or frequency associated with motion or other processes (83).
Like EPSI, spiral-MRSI applies a read gradient during data acquisition, so it shares a similar level of dependence on the gradient system performance. EPSI is being applied to clinical applications, but is partly hampered due to lack of commercial availability and the need for dedicated reconstruction software. However, spiral-MRSI has been used to map metabolic abnormalities in patients with multiple sclerosis (84).
3.3.3. Parallel Encoded-MRSI
Parallel imaging techniques originally developed for speeding up MRI can also be adopted for MRSI (85, 86). The basic principle is to use the different sensitivity profiles of multiple, phasedarray receiver coils to encode spatial information, so that fewer phase-encoding steps are required, thereby reducing scan time. In the “SENSE” approach, Fourier transformation of under-sampled k-space data leads to “aliased” spectroscopic images from each channel, which can then be unfolded and reconstructed using each coil’s sensitivity profile to produce a single spectroscopic image with uniform sensitivity. Alternatively, algorithms such as “SMASH” and “GRAPPA” (87–89) can be implemented to interpolate the missing k-space data points, which are then Fourier transformed as in conventional MRSI. Both “SENSE” (90) and “GRAPPA” (91) MRSI have been successfully implemented in humans.
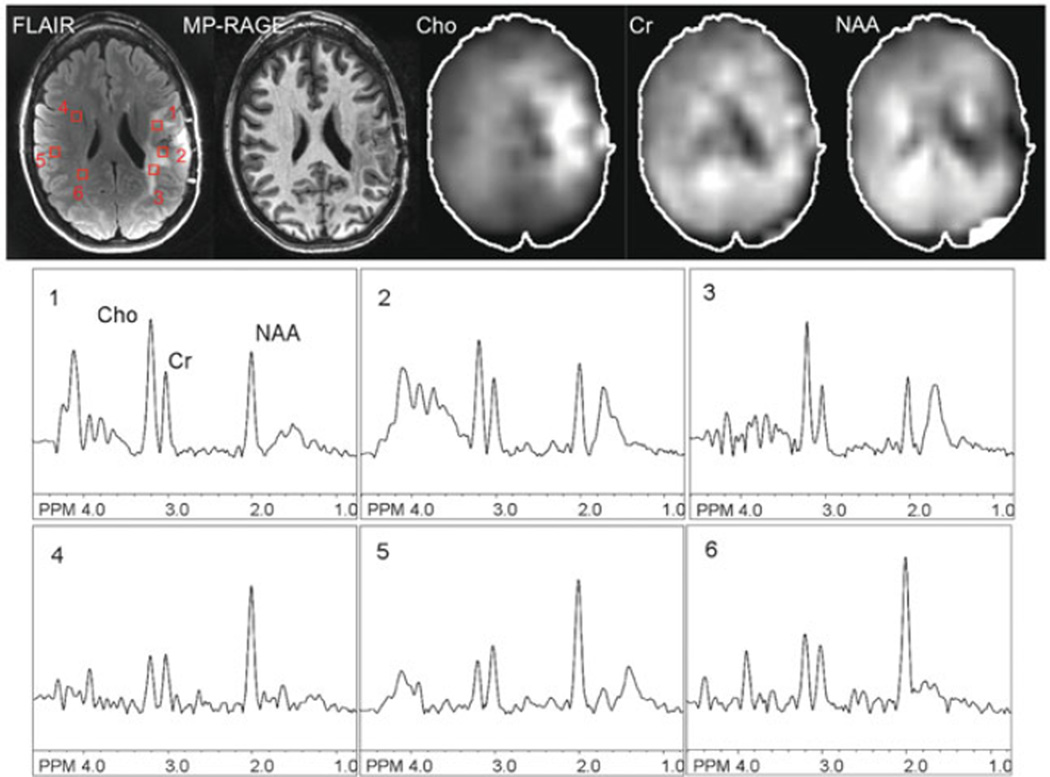
Reducing scan time using parallel encoding is an attractive option since it can be performed with any existing MRSI pulse sequence. 2D- and 3D-MRSI involve phase-encoding in multiple directions, so SENSE-encoding can also be performed in 2D or 3D (provided that receive arrays with appropriate geometry are available) leading to large scan time reductions (90). An example of a multi-slice MRSI scan with a SENSE factor of 6=3×2, in AP and RL directions, applied using a 32-channel head coil, is shown in a patient with a brain tumor in Fig. 9.8. This scan took 5:05 min; with conventional phase-encoding, scan time would have been more than 30 min. Scan times on the order of 1–2 min can be achieved by combining SENSE-MRSI with other fast MRSI techniques, such as Turbo MRSI (92) or EPSI (93), as long as sufficient SNR is available.
Fig. 9.8.
An example of 2D-SENSE-MRSI in a patient with a high-grade left frontal glioma recorded post-treatment at 3.0 T. TR 2.5 s, TE 140 ms, nominal voxel size 0.65 cm3, SENSE acceleration factor = 6, scan time 5:05 min. FLAIR and non-contrast T1-weighted (“MP-RAGE”) MR images, spectroscopic images (choline, creatine, NAA), and selected spectra are shown. The core of the lesion is characterized by reduced levels of NAA and other metabolites, consistent with necrotic tissue, while the T2 hyperintense perilesional areas demonstrate elevated Cho compared to the contralateral hemisphere, consistent with residual or recurrent tumor.
Parallel MRSI also has some potential problems. Errors in the coil sensitivity profiles and/or use of too high SENSE factors will lead to incomplete unfolding of MRSI data and the presence of artifacts. Unfolding of strong peri-cranial lipid signals is particularly challenging; successful SENSE-MRSI requires the application of efficient lipid suppression techniques (94) (see later).
3.4. Other Approaches to MRSI of the Brain
Other approaches to MRSI of the brain exist that are based on a t1 evolution period (as in high-resolution 2D NMR spectroscopy) to encode spectral information, with a fast imaging readout to determine spatial information. Scan times for these methods depend on the number of t1 values required to obtain sufficient spatial resolution and may be relatively short compared to conventional MRSI. These methods show promise in small animal studies, but for the most part have not been applied in humans. The sensitivity may be somewhat lower than in conventional MRSI because of the T2 signal decay that occurs during t1 time period. However, they do offer some unique advantages, such as using a constant evolution time with a sliding refocusing pulse, to produce “homonuclear decoupled” proton brain spectra (95).
4. Water and Lipid Suppression
Brain metabolites observed by MRS are in the millimolar concentration range, while brain water is approximately 80 M. Lipids in scalp tissue are also present in very high concentrations. Therefore, efficient water suppression (and lipid suppression for MRSI) is vital for the reliable observation and measurement of brain metabolites.
The most common method for water suppression is to presaturate the water signal using frequency-selective saturation pulses applied prior to the localization sequence (“CHESS”) (96). Multiple CHESS pulses with optimized flip angles and delays can be used to give good suppression factors over a range of transmit B1 values and water T1 relaxation times (which is important for the suppression of both brain water and CSF) (97, 98). For example, the “WET” scheme employs up to four Gaussian pulses (98), while the “VAPOR” scheme consists of seven pulses (57). Occasionally, it may be desirable to perform water suppression during the localization sequence, either opposed, or in addition, to presaturation. For instance, a water suppression pulse can be placed in the STEAM sequence between the second and third 90° pulses because the magnetization of the stimulated echo pathway is stored along the Z-axis during this time period. This can be used to improve suppression compared to presaturation only. It is also possible to include frequency-selective refocusing pulses inside a localization sequence to improve water suppression (e.g., the “MEGA” or “BASING” sequences) (99, 100).
Lipid suppression is commonly performed in three different ways. One method, to suppress lipid signals in the scalp, is to use spatial outer-volume suppression (OVS) pulses (Fig. 9.5) (53). Alternatively, an inversion recovery scheme can be used, taking advantage of the difference in T1 values between lipid (typically 300 ms at 1.5 T) and metabolites (1,000–2,000 ms) (101). At 1.5 T, an inversion time of 200 ms (= T1 * ln [2]) will selectively null the lipid signal, while most of the metabolite magnetization remains inverted. This method can suppress lipid signals anywhere in the brain because no assumption is made about the spatial distribution of the lipid, but may somewhat reduce metabolite SNR. Finally, lipid suppression may also be performed using frequency-selective saturation pulses, similar to frequency-selective water suppression techniques such as CHESS (94). Recently, methods have been designed which combine both water and lipid suppression into a single, dual band approach (94, 102, 103).
5. Spectral Editing Techniques
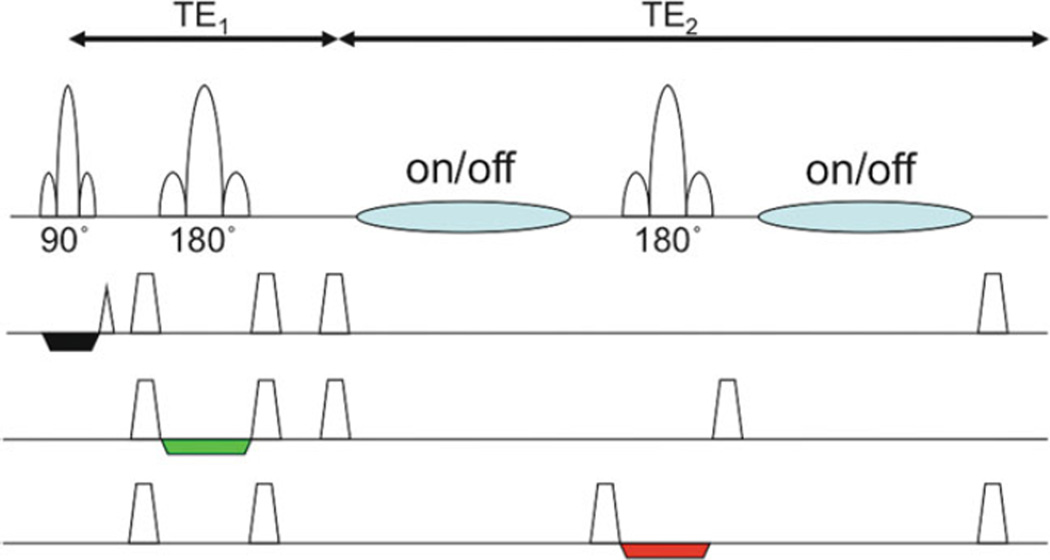
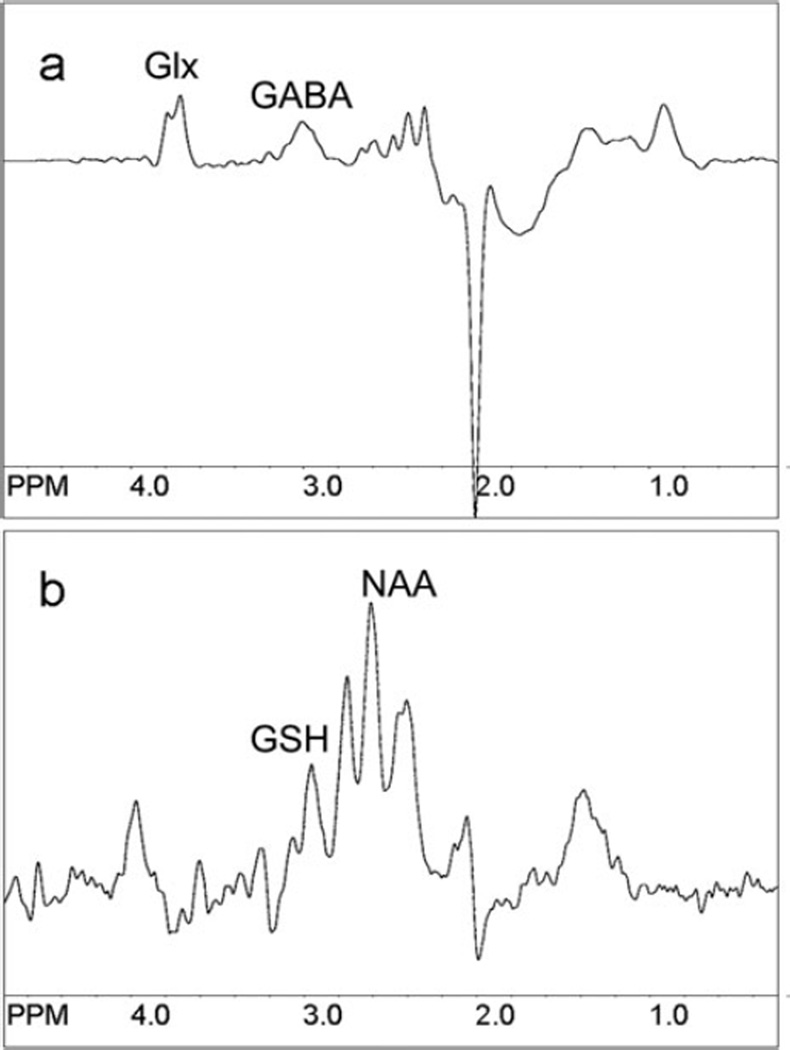
As mentioned above, certain molecules, such as GABA or glutathione, are almost totally obscured in conventional brain MRS by signals from other compounds which are present at much higher concentrations. “Spectral editing” techniques are required in order to detect these molecules while suppressing the signal from the unwanted compounds. A commonly used sequence for this purpose is the so-called “MEGA-PRESS” sequence (Fig. 9.9). Spectral editing makes use of molecules which contain “coupled” spin systems – the presence of coupling (J, measured in Hz) between functional groups allows the signal on one group to be modulated by applying a selective radiofrequency pulse on the other. For instance, for GABA, setting the frequency of the selective editing pulse to 1.9 ppm resonance of GABA will refocus the outer two peaks of the 3.02 ppm GABA pseudo-triplet. A second scan is performed without the selective pulse, and with TE=1/J (68 ms), the unaffected modulation results in two inverted peak (the outer two lines of the triplet) at 3.02 ppm. By subtracting the first scan from the second, the 3.02 GABA resonance can be selected (Fig. 9.10a) (99). For glutathione, the resonance at 2.95 ppm can be observed with the selective editing pulse set to 4.56 ppm and TE of 130 ms (Fig. 9.10b). A similar approach (called the “BASING” sequence) can be used to selectively detect brain lactate without contamination from lipids, making use of the coupled lactate resonances at 1.3 and 4.1 ppm (104).
Fig. 9.9.
Pulse sequence for spectral editing (“MEGA-PRESS”). Frequency-selective editing pulses are added (blue) to the conventional PRESS sequence on alternating scans. The TE (= TE1 + TE2) is set equal to 1/J for doublets. Subtraction of alternating scans causes cancellation of all signals not effected by the editing pulses, leaving only the target edited molecules.
Fig. 9.10.
Examples of (a) GABA- and (b) glutathione-edited spectra using the MEGA-PRESS pulse sequence. TR 2 s, voxel size 3.5×3.5×3.5 = ~43 cm3, centered on the anterior cingulate gyrus, with TE 68 ms for GABA and 130 ms for GSH. Scan time was 8 min 32 s for GABA and 17 min 4 s for GSH. Note that in (a) glutamate/glutamine (Glx) coedit with GABA, and in (b) the aspartyl resonances of NAA coedit with GSH.
6. Data Analysis and Quantification
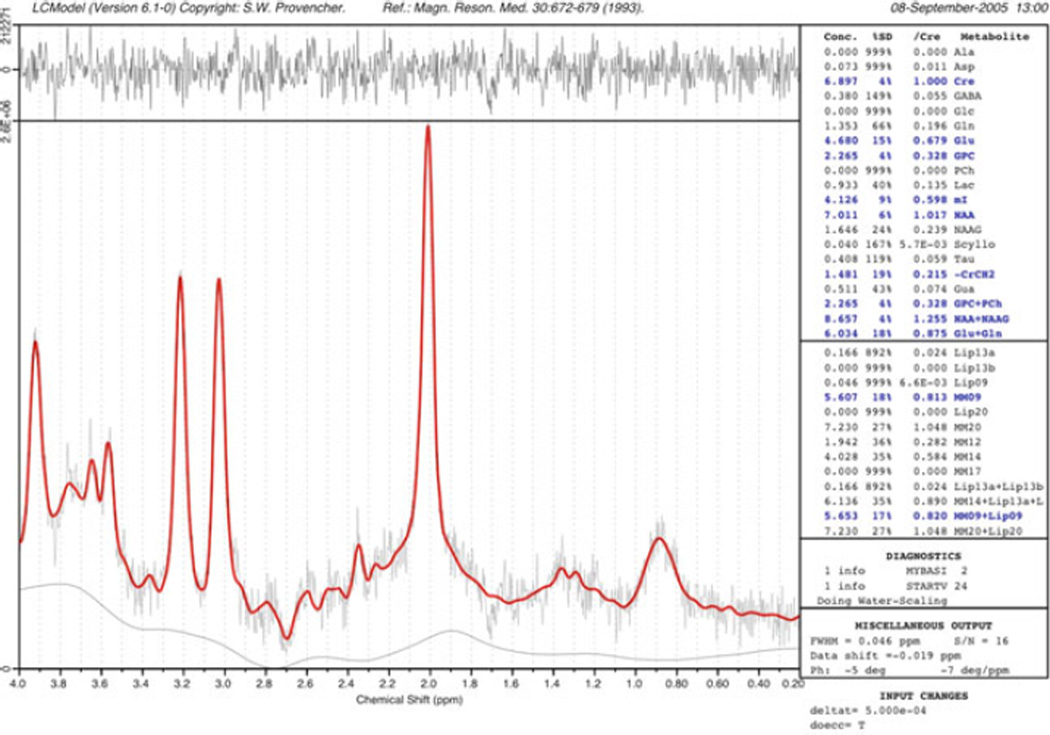
The concentration of a metabolite is linearly proportional to its spectral peak area. However, peak area measurements in in vivo spectroscopy are complicated by resonance overlap, baseline distortions, and non-ideal lineshapes and will also depend on factors such as relaxation times, pulse sequence used, and scanner hardware (e.g., receiver gain, coil loading). Various methods have been used to measure peak areas, ranging from simple integration, to fitting algorithms in the time- or frequency domains (105, 106). One of the more widely used methods for spectral quantitation in recent years is the linear combination model (“LCModel”) method developed by Provencher et al. (107) (Fig. 9.11). The LCModel fits the in vivo spectrum as a combination of pure, model spectra from each of the expected compounds in the brain (107). The model also includes automatic phase correction and baseline correction, or the baseline may also be modeled as a combination of macromolecular resonances. Provided that each scanner is properly calibrated with the appropriate model solutions, the program returns metabolite concentrations (relative to an unsuppressed water signal) as well as estimates of uncertainty (e.g., Cramer–Rao lower bounds).
Fig. 9.11.
An example of the “LCModel” analysis method. The experimental data are fit as a linear combination of spectra of pure compounds recorded under the same experimental conditions as the in vivo spectrum. Automated baseline and phase correction is performed, and an estimate of metabolite concentrations provided relative to the brain water signal. In this example of a 2×2×2 cm PRESS spectrum recorded at 3.0 T from a normal control subject (TR/TE/number of averages = 2,000/35/128), the difference between the original data and the curve-fit (red) is shown in the top trace. Metabolite concentrations in blue correspond to those with an estimated uncertainty of less than 20%.
Quantification methods based on internal or external standards have been extensively developed and tested for single-voxel spectroscopy (108). With care, it is also possible to quantify spectroscopic images (109). Many studies, however, do not attempt to quantify metabolite concentrations, but rather report relative amounts (ratios) of each metabolite, often using Cr as a reference. While ratios have some inherent advantages, for instance to account for partial volume effects or to enhance spectroscopic “contrast” in conditions where metabolites may change in opposite directions (e.g., Cho increases, NAA decreases), they also may be misleading if all metabolites are changing simultaneously. In particular, Cr shows quite marked regional variations (24), and often changes in pathology, so caution should be used when interpreting ratios of metabolites to Cr.
7. Conclusions
MRS and MRSI are mature techniques that are very commonly used for research studies in both humans and animal models. The protocols described in this chapter represent the most widely used and validated techniques currently used, but are by no means comprehensive. MRS protocol development, particularly for high-field applications, hyper-polarization, and fast MRSI techniques continue to be an active area of research investigation.
Acknowledgments
Supported in part by National Institutes of Health grant P41 RR015241.
References
- 1.Cady EB, Costello AM, Dawson MJ, Delpy DT, Hope PL, Reynolds EO, Tofts PS, Wilkie DR. Noninvasive investigation of cerebral metabolism in newborn infants by phosphorus nuclear magnetic resonance spectroscopy. Lancet. 1983;1(8333):1059–1062. doi: 10.1016/s0140-6736(83)91906-2. [DOI] [PubMed] [Google Scholar]
- 2.Bottomley PA, Edelstein WA, Foster TH, Adams WA. In vivo solvent-suppressed localized hydrogen nuclear magnetic resonance spectroscopy: A window to metabolism? Proc Natl Acad Sci USA. 1985;82(7):2148–2152. doi: 10.1073/pnas.82.7.2148. [DOI] [PMC free article] [PubMed] [Google Scholar]
- 3.Barker PB, Lin DD. In vivo proton MR spectroscopy of the human brain. Prog NMR Spect. 2006;49:99–128. [Google Scholar]
- 4.Goldman M, Johannesson H, Axelsson O, Karlsson M. Hyperpolarization of 13C through order transfer from parahydrogen: A new contrast agent for MRI. Magn Reson Imaging. 2005;23(2):153–157. doi: 10.1016/j.mri.2004.11.031. [DOI] [PubMed] [Google Scholar]
- 5.Barker PB, Gillard JH, van Zijl PC, Soher BJ, Hanley DF, Agildere AM, Oppenheimer SM, Bryan RN. Acute stroke: Evaluation with serial proton MR spectroscopic imaging. Radiology. 1994;192(3):723–732. doi: 10.1148/radiology.192.3.8058940. [DOI] [PubMed] [Google Scholar]
- 6.Remy C, Grand S, Lai ES, Belle V, Hoffmann D, Berger F, Esteve F, Ziegler A, Le Bas JF, Benabid AL, Decorps M, Segebarth CM. 1H MRS of human brain abscesses in vivo and in vitro. Magn Reson Med. 1995;34(4):508–514. doi: 10.1002/mrm.1910340404. [DOI] [PubMed] [Google Scholar]
- 7.Lin DD, Crawford TO, Barker PB. Proton MR spectroscopy in the diagnostic evaluation of suspected mitochondrial disease. AJNR Am J Neuroradiol. 2003;24(1):33–41. [PMC free article] [PubMed] [Google Scholar]
- 8.Govindaraju V, Young K, Maudsley AA. Proton NMR chemical shifts and coupling constants for brain metabolites. NMR Biomed. 2000;13(3):129–153. doi: 10.1002/1099-1492(200005)13:3<129::aid-nbm619>3.0.co;2-v. [DOI] [PubMed] [Google Scholar]
- 9.Frahm J, Michaelis T, Merboldt KD, Hanicke W, Gyngell ML, Bruhn H. On the N-acetyl methyl resonance in localized 1H NMR spectra of human brain in vivo. NMR Biomed. 1991;4(4):201–204. doi: 10.1002/nbm.1940040408. [DOI] [PubMed] [Google Scholar]
- 10.Pouwels PJ, Frahm J. Differential distribution of NAA and NAAG in human brain as determined by quantitative localized proton MRS. NMR Biomed. 1997;10(2):73–78. doi: 10.1002/(sici)1099-1492(199704)10:2<73::aid-nbm448>3.0.co;2-4. [DOI] [PubMed] [Google Scholar]
- 11.Barker PB. N-acetyl aspartate – a neuronal marker? Ann Neurol. 2001;49(4):423–424. [PubMed] [Google Scholar]
- 12.Simmons ML, Frondoza CG, Coyle JT. Immunocytochemical localization of N-acetyl-aspartate with monoclonal antibodies. Neuroscience. 1991;45(1):37–45. doi: 10.1016/0306-4522(91)90101-s. [DOI] [PubMed] [Google Scholar]
- 13.Bhakoo KK, Pearce D. In vitro expression of N-acetyl aspartate by oligodendrocytes: Implications for proton magnetic resonance spectroscopy signal in vivo. J Neurochem. 2000;74(1):254–262. doi: 10.1046/j.1471-4159.2000.0740254.x. [DOI] [PubMed] [Google Scholar]
- 14.Burlina AP, Ferrari V, Facci L, Skaper SD, Burlina AB. Mast cells contain large quantities of secretagogue-sensitive N-acetylaspartate. J Neurochem. 1997;69(3):1314–1317. doi: 10.1046/j.1471-4159.1997.69031314.x. [DOI] [PubMed] [Google Scholar]
- 15.Urenjak J, Williams SR, Gadian DG, Noble M. Specific expression of N-acetylaspartate in neurons, oligodendrocyte-type-astrocyte progenitors, and immature oligodendrocytes in vitro. J Neurochem. 1992;59(1):55–61. doi: 10.1111/j.1471-4159.1992.tb08875.x. [DOI] [PubMed] [Google Scholar]
- 16.Barker P, Breiter S, Soher B, Chatham J, Forder J, Samphilipo M, Magee C, Anderson J. Quantitative proton spectroscopy of canine brain: In vivo and in vitro correlations. Magn Reson Med. 1994;32:157–163. doi: 10.1002/mrm.1910320202. [DOI] [PubMed] [Google Scholar]
- 17.Gill SS, Small RK, Thomas DG, Patel P, Porteous R, van Bruggen N, Gadian DG, Kauppinen RA, Williams SR. Brain metabolites as 1H NMR markers of neuronal and glial disorders. NMR Biomed. 1989;2(5–6):196–200. doi: 10.1002/nbm.1940020505. [DOI] [PubMed] [Google Scholar]
- 18.Gill SS, Thomas DG, Van BN, Gadian DG, Peden CJ, Bell JD, Cox IJ, Menon DK, Iles RA, Bryant DJ. Proton MR spectroscopy of intracranial tumours: In vivo and in vitro studies. J Comput Assist Tomogr. 1990;14(4):497–504. doi: 10.1097/00004728-199007000-00001. [DOI] [PubMed] [Google Scholar]
- 19.Davie CA, Hawkins CP, Barker GJ, Brennan A, Tofts PS, Miller DH, McDonald WI. Detection of myelin breakdown products by proton magnetic resonance spectroscopy. Lancet. 1993;341(8845):630–631. doi: 10.1016/0140-6736(93)90390-3. [DOI] [PubMed] [Google Scholar]
- 20.Brenner RE, Munro PM, Williams SC, Bell JD, Barker GJ, Hawkins CP, Landon DN, McDonald WI. The proton NMR spectrum in acute EAE: The significance of the change in the Cho:Cr ratio. Magn Reson Med. 1993;29(6):737–745. doi: 10.1002/mrm.1910290605. [DOI] [PubMed] [Google Scholar]
- 21.Kreis R, Ross BD, Farrow NA, Ackerman Z. Metabolic disorders of the brain in chronic hepatic encephalopathy detected with H-1 MR spectroscopy. Radiology. 1992;182(1):19–27. doi: 10.1148/radiology.182.1.1345760. [DOI] [PubMed] [Google Scholar]
- 22.Stoll AL, Renshaw PF, De Micheli E, Wurtman R, Pillay SS, Cohen BM. Choline ingestion increases the resonance of choline-containing compounds in human brain: An in vivo proton magnetic resonance study. Biol Psychiatry. 1995;37(3):170–174. doi: 10.1016/0006-3223(94)00120-R. [DOI] [PubMed] [Google Scholar]
- 23.Urenjak J, Williams SR, Gadian DG, Noble M. Proton nuclear magnetic resonance spectroscopy unambiguously identifies different neural cell types. J Neurosci. 1993;13:981–989. doi: 10.1523/JNEUROSCI.13-03-00981.1993. [DOI] [PMC free article] [PubMed] [Google Scholar]
- 24.Jacobs MA, Horska A, van Zijl PC, Barker PB. Quantitative proton MR spectroscopic imaging of normal human cerebellum and brain stem. Magn Reson Med. 2001;46(4):699–705. doi: 10.1002/mrm.1248. [DOI] [PubMed] [Google Scholar]
- 25.Penrice J, Cady EB, Lorek A, Wylezinska M, Amess PN, Aldridge RF, Stewart A, Wyatt JS, Reynolds EO. Proton magnetic resonance spectroscopy of the brain in normal preterm and term infants, and early changes after perinatal hypoxiaischemia. Pediatr Res. 1996;40(1):6–14. doi: 10.1203/00006450-199607000-00002. [DOI] [PubMed] [Google Scholar]
- 26.Petroff OA, Graham GD, Blamire AM, al-Rayess M, Rothman DL, Fayad PB, Brass LM, Shulman RG, Prichard JW. Spectroscopic imaging of stroke in humans: Histopathology correlates of spectral changes. Neurology. 1992;42(7):1349–1354. doi: 10.1212/wnl.42.7.1349. [DOI] [PubMed] [Google Scholar]
- 27.Alger JR, Frank JA, Bizzi A, Fulham MJ, DeSouza BX, Duhaney MO, Inscoe SW, Black JL, van Zijl PC, Moonen CT. Metabolism of human gliomas: Assessment with H-1 MR spectroscopy and F-18 fluorodeoxyglucose PET. Radiology. 1990;177(3):633–641. doi: 10.1148/radiology.177.3.2243962. [DOI] [PubMed] [Google Scholar]
- 28.Mathews PM, Andermann F, Silver K, Karpati G, Arnold DL. Proton MR spectroscopic characterization of differences in regional brain metabolic abnormalities in mitochondrial encephalomyopathies. Neurology. 1993;43(12):2484–2490. doi: 10.1212/wnl.43.12.2484. [DOI] [PubMed] [Google Scholar]
- 29.Brand A, Richter-Landsberg C, Leibfritz D. Multinuclear NMR studies on the energy metabolism of glial and neuronal cells. Dev Neurosci. 1993;15(3–5):289–298. doi: 10.1159/000111347. [DOI] [PubMed] [Google Scholar]
- 30.Flogel U, Willker W, Leibfritz D. Regulation of intracellular pH in neuronal and glial tumour cells, studied by multinuclear NMR spectroscopy. NMR Biomed. 1994;7(4):157–166. doi: 10.1002/nbm.1940070402. [DOI] [PubMed] [Google Scholar]
- 31.Ross BD, Michaelis T. Clinical applications of magnetic resonance spectroscopy. Magn Reson Q. 1994;10:191–247. [PubMed] [Google Scholar]
- 32.Shonk TK, Moats RA, Gifford P, Michaelis T, Mandigo JC, Izumi J, Ross BD. Probable Alzheimer disease: Diagnosis with proton MR spectroscopy. Radiology. 1995;195(1):65–72. doi: 10.1148/radiology.195.1.7892497. [DOI] [PubMed] [Google Scholar]
- 33.Kruse B, Hanefeld F, Christen HJ, Bruhn H, Michaelis T, Hanicke W, Frahm J. Alterations of brain metabolites in metachromatic leukodystrophy as detected by localized proton magnetic resonance spectroscopy in vivo. J Neurol. 1993;241(2):68–74. doi: 10.1007/BF00869766. [DOI] [PubMed] [Google Scholar]
- 34.Magistretti PJ, Pellerin L, Rothman DL, Shulman RG. Energy on demand. Science. 1999;283(5401):496–497. doi: 10.1126/science.283.5401.496. [DOI] [PubMed] [Google Scholar]
- 35.Tkac I, Andersen P, Adriany G, Merkle H, Ugurbil K, Gruetter R. In vivo 1H NMR spectroscopy of the human brain at 7 T. Magn Reson Med. 2001;46(3):451–456. doi: 10.1002/mrm.1213. [DOI] [PubMed] [Google Scholar]
- 36.Srinivasan R, Sailasuta N, Hurd R, Nelson S, Pelletier D. Evidence of elevated glutamate in multiple sclerosis using magnetic resonance spectroscopy at 3 T. Brain. 2005;128(Pt 5):1016–1025. doi: 10.1093/brain/awh467. [DOI] [PubMed] [Google Scholar]
- 37.Kreis R, Pfenninger J, Herschkowitz N, Boesch C. In vivo proton magnetic resonance spectroscopy in a case of Reye’s syndrome. Intensive Care Med. 1995;21(3):266–269. doi: 10.1007/BF01701487. [DOI] [PubMed] [Google Scholar]
- 38.van Zijl PCM, Barker PB. Magnetic Resonance Spectroscopy and Spectroscopic Imaging for the Study of Brain Metabolism. Imaging Brain Structure and Function. Vol. 820. New York, NY: Annals of the New York Academy of Sciences; 1997. pp. 75–96. [DOI] [PubMed] [Google Scholar]
- 39.Rothman DL, Petroff OA, Behar KL, Mattson RH. Localized 1H NMR measurements of gamma-aminobutyric acid in human brain in vivo. Proc Natl Acad Sci USA. 1993;90(12):5662–5666. doi: 10.1073/pnas.90.12.5662. [DOI] [PMC free article] [PubMed] [Google Scholar]
- 40.Terpstra M, Henry PG, Gruetter R. Measurement of reduced glutathione (GSH) in human brain using LCModel analysis of difference-edited spectra. Magn Reson Med. 2003;50(1):19–23. doi: 10.1002/mrm.10499. [DOI] [PubMed] [Google Scholar]
- 41.Pan JW, Telang FW, Lee JH, de Graaf RA, Rothman DL, Stein DT, Hetherington HP. Measurement of beta-hydroxybutyrate in acute hyperketonemia in human brain. J Neurochem. 2001;79(3):539–544. doi: 10.1046/j.1471-4159.2001.00575.x. [DOI] [PubMed] [Google Scholar]
- 42.Seymour KJ, Bluml S, Sutherling J, Sutherling W, Ross BD. Identification of cerebral acetone by 1H-MRS in patients with epilepsy controlled by ketogenic diet. Magma. 1999;8(1):33–42. doi: 10.1007/BF02590633. [DOI] [PubMed] [Google Scholar]
- 43.Kreis R, Pietz J, Penzien J, Herschkowitz N, Boesch C. Identification and quantitation of phenylalanine in the brain of patients with phenylketonuria by means of localized in vivo 1H magnetic-resonance spectroscopy. J Magn Reson B. 1995;107(3):242–251. doi: 10.1006/jmrb.1995.1084. [DOI] [PubMed] [Google Scholar]
- 44.van der Knaap MS, Wevers RA, Struys EA, Verhoeven NM, Pouwels PJ, Engelke UF, Feikema W, Valk J, Jakobs C. Leukoencephalopathy associated with a disturbance in the metabolism of polyols. Ann Neurol. 1999;46(6):925–928. doi: 10.1002/1531-8249(199912)46:6<925::aid-ana18>3.0.co;2-j. [DOI] [PubMed] [Google Scholar]
- 45.Cady EB, Lorek A, Penrice J, Reynolds EO, Iles RA, Burns SP, Coutts GA, Cowan FM. Detection of propan-1,2-diol in neonatal brain by in vivo proton magnetic resonance spectroscopy. Magn Reson Med. 1994;32(6):764–767. doi: 10.1002/mrm.1910320611. [DOI] [PubMed] [Google Scholar]
- 46.Hanstock CC, Rothman DL, Shulman RG, Novotny EJ, Jr, Petroff OA, Prichard JW. Measurement of ethanol in the human brain using NMR spectroscopy. J Stud Alcohol. 1990;51(2):104–107. doi: 10.15288/jsa.1990.51.104. [DOI] [PubMed] [Google Scholar]
- 47.Rose SE, Chalk JB, Galloway GJ, Doddrell DM. Detection of dimethyl sulfone in the human brain by in vivo proton magnetic resonance spectroscopy. Magn Reson Imaging. 2000;18(1):95–98. doi: 10.1016/s0730-725x(99)00110-1. [DOI] [PubMed] [Google Scholar]
- 48.Vermathen P, Capizzano AA, Maudsley AA. Administration and (1)H MRS detection of histidine in human brain: Application to in vivo pH measurement. Magn Reson Med. 2000;43(5):665–675. doi: 10.1002/(sici)1522-2594(200005)43:5<665::aid-mrm8>3.0.co;2-3. [DOI] [PubMed] [Google Scholar]
- 49.Rothman DL, Behar KL, Prichard JW, Petroff OA. Homocarnosine and the measurement of neuronal pH in patients with epilepsy. Magn Reson Med. 1997;38(6):924–929. doi: 10.1002/mrm.1910380611. [DOI] [PubMed] [Google Scholar]
- 50.Mori S, Eleff SM, Pilatus U, Mori N, van Zijl PC. Proton NMR spectroscopy of solvent-saturable resonances: A new approach to study pH effects in situ. Magn Reson Med. 1998;40(1):36–42. doi: 10.1002/mrm.1910400105. [DOI] [PubMed] [Google Scholar]
- 51.Frahm J. Localized proton spectroscopy using stimulated echoes. J Magn Reson. 1987;72(3):502–508. [Google Scholar]
- 52.van Zijl PC, Moonen CT, Alger JR, Cohen JS, Chesnick SA. High field localized proton spectroscopy in small volumes: Greatly improved localization and shimming using shielded strong gradients. Magn Reson Med. 1989;10(2):256–265. doi: 10.1002/mrm.1910100210. [DOI] [PubMed] [Google Scholar]
- 53.Duyn JH, Gillen J, Sobering G, van Zijl PC, Moonen CT. Multisection proton MR spectroscopic imaging of the brain. Radiology. 1993;188(1):277–282. doi: 10.1148/radiology.188.1.8511313. [DOI] [PubMed] [Google Scholar]
- 54.Ordidge RJ. Random noise selective excitation pulses. Magn Reson Med. 1987;5(1):93–98. doi: 10.1002/mrm.1910050113. [DOI] [PubMed] [Google Scholar]
- 55.Moonen CTW, Sobering G, van Zijl PCM, Gillen J, von Kienlin M, Bizzi A. Proton spectroscopic imaging of human brain. J Magn Reson. 1992;98(3):556–575. [Google Scholar]
- 56.Moonen CT, von Kienlin M, van Zijl PC, Cohen J, Gillen J, Daly P, Wolf G. Comparison of single-shot localization methods (STEAM and PRESS) for in vivo proton NMR spectroscopy. NMR Biomed. 1989;2(5–6):201–208. doi: 10.1002/nbm.1940020506. [DOI] [PubMed] [Google Scholar]
- 57.Tkac I, Starcuk Z, Choi IY, Gruetter R. In vivo 1H NMR spectroscopy of rat brain at 1 ms echo time. Magn Reson Med. 1999;41(4):649–656. doi: 10.1002/(sici)1522-2594(199904)41:4<649::aid-mrm2>3.0.co;2-g. [DOI] [PubMed] [Google Scholar]
- 58.Collins CM, Liu W, Schreiber W, Yang QX, Smith MB. Central brightening due to constructive interference with, without, and despite dielectric resonance. J Magn Reson Imaging. 2005;21(2):192–196. doi: 10.1002/jmri.20245. [DOI] [PubMed] [Google Scholar]
- 59.Slotboom J, Mehlkopf AF, Bovee WMMJ. A single-shot localization pulse sequence suited for coils with inhomogeneous RF fields using adiabatic slice-selective RF pulses. J Magn Reson. 1991;95:396–404. [Google Scholar]
- 60.Garwood M, DelaBarre L. The return of the frequency sweep: Designing adiabatic pulses for contemporary NMR. JMagnReson. 2001;153(2):155–177. doi: 10.1006/jmre.2001.2340. [DOI] [PubMed] [Google Scholar]
- 61.Scheenen TW, Heerschap A, Klomp DW. Towards 1H-MRSI of the human brain at 7T with slice-selective adiabatic refocusing pulses. Magma. 2008;21(1–2):95–101. doi: 10.1007/s10334-007-0094-y. [DOI] [PMC free article] [PubMed] [Google Scholar]
- 62.Scheenen TW, Klomp DW, Wijnen JP, Heerschap A. Short echo time 1HMRSI of the human brain at 3T with minimal chemical shift displacement errors using adiabatic refocusing pulses. Magn Reson Med. 2008;59(1):1–6. doi: 10.1002/mrm.21302. [DOI] [PubMed] [Google Scholar]
- 63.Hwang TL, Shaka AJ. Water suppression that works. Excitation sculpting using arbitrary waveforms and pulsed field gradients. J Magn Reson Ser A. 1995;112:275–279. [Google Scholar]
- 64.Levitt MH, Freeman R. Compensation for pulse imperfections in NMR spin echo experiments. J Magn Reson. 1981;43:65–80. [Google Scholar]
- 65.Mekle R, Mlynarik V, Gambarota G, Hergt M, Krueger G, Gruetter R. MR spectroscopy of the human brain with enhanced signal intensity at ultrashort echo times on a clinical platform at 3T and 7T. Magn Reson Med. 2009;61(6):1279–1285. doi: 10.1002/mrm.21961. [DOI] [PubMed] [Google Scholar]
- 66.Ordidge RJ, Connelly A, Lohman JAB. Image-selected in vivo spectroscopy (ISIS) – a new technique for spatially selective NMR-spectroscopy. J Magn Reson. 1986;66(2):283–294. [Google Scholar]
- 67.Ernst RR, Bodenhausen G, Wokaun A. Principles of Nuclear Magnetic Resonance in One and Two Dimensions. New York, NY: Oxford University Press; 1990. 640 pp. [Google Scholar]
- 68.Golay X, Gillen J, van Zijl PC, Barker PB. Scan time reduction in proton magnetic resonance spectroscopic imaging of the human brain. Magn Reson Med. 2002;47(2):384–387. doi: 10.1002/mrm.10038. [DOI] [PubMed] [Google Scholar]
- 69.Pohmann R, von Kienlin M, Haase A. Theoretical evaluation and comparison of fast chemical shift imaging methods. J Magn Reson. 1997;129(2):145–160. doi: 10.1006/jmre.1997.1245. [DOI] [PubMed] [Google Scholar]
- 70.Duyn JH, Moonen CT. Fast proton spectroscopic imaging of human brain using multiple spin-echoes. Magn Reson Med. 1993;30(4):409–414. doi: 10.1002/mrm.1910300403. [DOI] [PubMed] [Google Scholar]
- 71.Martin AJ, Liu H, Hall WA, Truwit CL. Preliminary assessment of turbo spectroscopic imaging for targeting in brain biopsy. AJNR Am J Neuroradiol. 2001;22(5):959–968. [PMC free article] [PubMed] [Google Scholar]
- 72.Mansfield P. Spatial mapping of chemical shift in NMR. Magn Reson Med. 1984;1:370–386. doi: 10.1002/mrm.1910010308. [DOI] [PubMed] [Google Scholar]
- 73.Posse S, Tedeschi G, Risinger R, Ogg R, Le Bihan D. High speed 1H spectroscopic imaging in human brain by echo planar spatial-spectral encoding. Magn Reson Med. 1995;33(1):34–40. doi: 10.1002/mrm.1910330106. [DOI] [PubMed] [Google Scholar]
- 74.Posse S, DeCarli C, Le Bihan D. Three-dimensional echo-planar MR spectroscopic imaging at short echo times in the human brain. Radiology. 1994;192(3):733–738. doi: 10.1148/radiology.192.3.8058941. [DOI] [PubMed] [Google Scholar]
- 75.Ebel A, Soher BJ, Maudsley AA. Assessment of 3D proton MR echo-planar spectroscopic imaging using automated spectral analysis. Magn Reson Med. 2001;46(6):1072–1078. doi: 10.1002/mrm.1301. [DOI] [PubMed] [Google Scholar]
- 76.Ebel A, Maudsley AA, Weiner MW, Schuff N. Achieving sufficient spectral bandwidth for volumetric 1H echo-planar spectroscopic imaging at 4 Tesla. Magn Reson Med. 2005;54(3):697–701. doi: 10.1002/mrm.20593. [DOI] [PMC free article] [PubMed] [Google Scholar]
- 77.Pelletier D, Nelson SJ, Grenier D, Lu Y, Genain C, Goodkin DE. 3-D echo planar (1)HMRS imaging in MS: Metabolite comparison from supratentorial vs. central brain. Magn Reson Imaging. 2002;20(8):599–606. doi: 10.1016/s0730-725x(02)00533-7. [DOI] [PubMed] [Google Scholar]
- 78.Govindaraju V, Gauger GE, Manley GT, Ebel A, Meeker M, Maudsley AA. Volumetric proton spectroscopic imaging of mild traumatic brain injury. AJNR Am J Neuroradiol. 2004;25(5):730–737. [PMC free article] [PubMed] [Google Scholar]
- 79.Adalsteinsson E, Irarrazabal P, Topp S, Meyer C, Macovski A, Spielman DM. Volumetric spectroscopic imaging with spiral-based K-space trajectories. Magn Reson Med. 1998;39(6):889–898. doi: 10.1002/mrm.1910390606. [DOI] [PubMed] [Google Scholar]
- 80.Block KT, Frahm J. Spiral imaging: A critical appraisal. J Magn Reson Imaging. 2005;21(6):657–668. doi: 10.1002/jmri.20320. [DOI] [PubMed] [Google Scholar]
- 81.Adalsteinsson E, Star-Lack J, Meyer CH, Spielman DM. Reduced spatial side lobes in chemical-shift imaging. Magn Reson Med. 1999;42(2):314–323. doi: 10.1002/(sici)1522-2594(199908)42:2<314::aid-mrm14>3.0.co;2-x. [DOI] [PubMed] [Google Scholar]
- 82.Sarkar S, Heberlein K, Hu X. Truncation artifact reduction in spectroscopic imaging using a dual-density spiral K-space trajectory. Magn Reson Imaging. 2002;20(10):743–757. doi: 10.1016/s0730-725x(02)00608-2. [DOI] [PubMed] [Google Scholar]
- 83.Kim DH, Adalsteinsson E, Spielman DM. Spiral readout gradients for the reduction of motion artifacts in chemical shift imaging. Magn Reson Med. 2004;51(3):458–463. doi: 10.1002/mrm.20004. [DOI] [PubMed] [Google Scholar]
- 84.Adalsteinsson E, Langer-Gould A, Homer RJ, Rao A, Sullivan EV, Lima CA, Pfefferbaum A, Atlas SW. Gray matter N-acetyl aspartate deficits in secondary progressive but not relapsing-remitting multiple sclerosis. AJNR Am J Neuroradiol. 2003;24(10):1941–1945. [PMC free article] [PubMed] [Google Scholar]
- 85.Pruessmann KP, Weiger M, Scheidegger MB, Boesiger P. SENSE: Sensitivity encoding for fast MRI. Magn Reson Med. 1999;42:952–962. [PubMed] [Google Scholar]
- 86.Sodickson DK, Manning WJ. Simultaneous acquisition of spatial harmonics (SMASH): Fast imaging with radiofrequency coil arrays. Magn Reson Med. 1997;38(4):591–603. doi: 10.1002/mrm.1910380414. [DOI] [PubMed] [Google Scholar]
- 87.Jakob PM, Griswold MA, Edelman RR, Sodickson DK. AUTO-SMASH: A self-calibrating technique for SMASH imaging. Simultaneous acquisition of spatial harmonics. Magma. 1998;7(1):42–54. doi: 10.1007/BF02592256. [DOI] [PubMed] [Google Scholar]
- 88.McKenzie CA, Yeh EN, Ohliger MA, Price MD, Sodickson DK. Self-calibrating parallel imaging with automatic coil sensitivity extraction. Magn Reson Med. 2002;47(3):529–538. doi: 10.1002/mrm.10087. [DOI] [PubMed] [Google Scholar]
- 89.Griswold MA, Jakob PM, Heidemann RM, Nittka M, Jellus V, Wang J, Kiefer B, Haase A. Generalized autocalibrating partially parallel acquisitions (GRAPPA) Magn Reson Med. 2002;47(6):1202–1210. doi: 10.1002/mrm.10171. [DOI] [PubMed] [Google Scholar]
- 90.Dydak U, Weiger M, Pruessmann KP, Meier D, Boesiger P. Sensitivity-encoded spectroscopic imaging. Magn Reson Med. 2001;46(4):713–722. doi: 10.1002/mrm.1250. [DOI] [PubMed] [Google Scholar]
- 91.Tsai SY, Otazo R, Posse S, Lin YR, Chung HW, Wald LL, Wiggins GC, Lin FH. Accelerated proton echo planar spectroscopic imaging (PEPSI) using GRAPPA with a 32-channel phased-array coil. Magn Reson Med. 2008;59(5):989–998. doi: 10.1002/mrm.21545. [DOI] [PubMed] [Google Scholar]
- 92.Dydak U, Pruessmann KP, Weiger M, Tsao J, Meier D, Boesiger P. Parallel spectroscopic imaging with spin-echo trains. Magn Reson Med. 2003;50(1):196–200. doi: 10.1002/mrm.10495. [DOI] [PubMed] [Google Scholar]
- 93.Lin FH, Tsai SY, Otazo R, Caprihan A, Wald LL, Belliveau JW, Posse S. Sensitivity-encoded (SENSE) proton echo-planar spectroscopic imaging (PEPSI) in the human brain. Magn Reson Med. 2007;57(2):249–257. doi: 10.1002/mrm.21119. [DOI] [PubMed] [Google Scholar]
- 94.Smith MA, Gillen J, McMahon MT, Barker PB, Golay X. Simultaneous water and lipid suppression for in vivo brain spectroscopy in humans. Magn Reson Med. 2005;54(3):691–696. doi: 10.1002/mrm.20592. [DOI] [PubMed] [Google Scholar]
- 95.Dreher W, Leibfritz D. Detection of homonuclear decoupled in vivo proton NMR spectra using constant time chemical shift encoding: CT-PRESS. Magn Reson Imaging. 1999;17(1):141–150. doi: 10.1016/s0730-725x(98)00156-8. [DOI] [PubMed] [Google Scholar]
- 96.Haase A, Frahm J, Hanicke W, Matthei D. 1H NMR chemical shift selective imaging. Phys Med Biol. 1985;30(4):341–344. doi: 10.1088/0031-9155/30/4/008. [DOI] [PubMed] [Google Scholar]
- 97.Moonen CTW, van Zijl PCM. Highly efficient water suppression for in vivo proton NMR spectroscopy. J Magn Reson. 1990;88:28–41. [Google Scholar]
- 98.Ogg RJ. WET a T1- and B1-insensitive water-suppression method for in vivo localized 1H NMR spectroscopy. J Magn Reson B. 1994;104:1–10. doi: 10.1006/jmrb.1994.1048. [DOI] [PubMed] [Google Scholar]
- 99.Mescher M, Merkle H, Kirsch J, Garwood M, Gruetter R. Simultaneous in vivo spectral editing and water suppression. NMR Biomed. 1998;11(6):266–272. doi: 10.1002/(sici)1099-1492(199810)11:6<266::aid-nbm530>3.0.co;2-j. [DOI] [PubMed] [Google Scholar]
- 100.Star-Lack J, Nelson SJ, Kurhanewicz J, Huang LR, Vigneron DB. Improved water and lipid suppression for 3D PRESS CSI using RF band selective inversion with gradient dephasing (BASING) Magn Reson Med. 1997;38(2):311–321. doi: 10.1002/mrm.1910380222. [DOI] [PubMed] [Google Scholar]
- 101.Spielman DM, Pauly JM, Macovski A, Glover GH, Enzmann DR. Lipid-suppressed single- and multisection proton spectroscopic imaging of the human brain. J Magn Reson Imaging. 1992;2(3):253–262. doi: 10.1002/jmri.1880020302. [DOI] [PubMed] [Google Scholar]
- 102.Gu M, Spielman DM. B1 and T1 insensitive water and lipid suppression using optimized multiple frequency-selective preparation pulses for whole-brain 1H spectroscopic imaging at 3T. Magn Reson Med. 2009;61(2):462–466. doi: 10.1002/mrm.21843. [DOI] [PMC free article] [PubMed] [Google Scholar]
- 103.Zhu H, Ouwerkerk R, Barker PB. Dual band water and lipid suppression for MR spectroscopic imaging at 3 Tesla. Magn Reson Med. 2009 doi: 10.1002/mrm.22324. (accepted for publication). [DOI] [PMC free article] [PubMed] [Google Scholar]
- 104.Kelley DA, Wald LL, Star-Lack JM. Lactate detection at 3T: Compensating J coupling effects with BASING. J Magn Reson Imaging. 1999;9(5):732–737. doi: 10.1002/(sici)1522-2586(199905)9:5<732::aid-jmri17>3.0.co;2-q. [DOI] [PubMed] [Google Scholar]
- 105.Raphael C. In vivo NMR spectral parameter estimation: A comparison between time and frequency domain methods. Magn Reson Med. 1991;18:358–370. doi: 10.1002/mrm.1910180210. [DOI] [PubMed] [Google Scholar]
- 106.de Beer R, van den Boogaart A, van Ormondt D, Pijnappel WW, den Hollander JA, Marien AJ, Luyten PR. Application of time-domain fitting in the quantification of in vivo 1H spectroscopic imaging data sets. NMR Biomed. 1992;5(4):171–178. doi: 10.1002/nbm.1940050403. [DOI] [PubMed] [Google Scholar]
- 107.Provencher SW. Estimation of metabolite concentrations from localized in vivo proton NMR spectra. Magn Reson Med. 1993;30(6):672–679. doi: 10.1002/mrm.1910300604. [DOI] [PubMed] [Google Scholar]
- 108.Henriksen O. In vivo quantitation of metabolite concentrations in the brain by means of proton MRS. NMR Biomed. 1995;8(4):139–148. doi: 10.1002/nbm.1940080402. [DOI] [PubMed] [Google Scholar]
- 109.Soher BJ, van Zijl PC, Duyn JH, Barker PB. Quantitative proton MR spectroscopic imaging of the human brain. Magn Reson Med. 1996;35(3):356–363. doi: 10.1002/mrm.1910350313. [DOI] [PubMed] [Google Scholar]


