

Abstract
Hepatic lipid metabolism is under elaborate regulation, and perturbations in this regulatory process at the transcriptional level lead to pathological conditions. NF-E2-related factor 1 (Nrf1) is a member of the cap'n'collar (CNC) transcription factor family. Hepatocyte-specific Nrf1 gene conditional-knockout mice are known to develop hepatic steatosis, but it remains unclear how Nrf1 contributes to the lipid homeostasis. Therefore, in this study we examined the gene expression profiles of Nrf1-deficient mouse livers. A pathway analysis based on the profiling results revealed that the levels of expression of the genes related to lipid metabolism, amino acid metabolism, and mitochondrial respiratory function were decreased in Nrf1-deficient mouse livers, indicating the profound effects that the Nrf1 deficiency conferred to various metabolic pathways. We discovered that the Nrf1 deficiency leads to the reduced expression of the transcriptional coactivator genes Lipin1 and PGC-1β (for peroxisome proliferator-activated receptor γ coactivator 1β). Chromatin immunoprecipitation analyses showed that Nrf1 binds to the antioxidant response elements (AREs) in regulatory regions of the Lipin1 and PGC-1β genes and the binding of Nrf1 to the AREs activates reporter gene transcription. These results thus identified Nrf1 to be a novel regulator of the Lipin1 and PGC-1β genes, providing new insights into the Nrf1 function in hepatic lipid metabolism.
INTRODUCTION
The liver is the central organ for the metabolism of fatty acids, which are processed through triglyceride synthesis or oxidative metabolism. These metabolic pathways are in part regulated at the transcriptional level, and perturbation of the regulation leads to pathological changes. One of the most common hepatic alterations is a fatty liver syndrome, which is associated with a progressive cascade of lipid disorders, including the hepatic steatosis, nonalcoholic steatohepatitis (NASH), cirrhosis, and eventually, hepatocellular carcinoma (4). Elucidation of the transcriptional networks regulating lipid metabolism is expected to provide new insights into the pathogenesis of these hepatic disorders.
In the past decade, various transcription factors have been implicated in hepatic lipid metabolism. For example, peroxisome proliferator-activated receptor α (PPARα) plays an important role in fatty acid degradation (1, 18, 25). In response to ligands, PPARα induces the expression of various enzyme genes involved in the lipid metabolisms. In PPARα-knockout (KO) mice, impaired mitochondrial β oxidation and fasting-induced steatosis are observed (1, 18, 25). Sterol regulatory element-binding proteins (SREBPs) also play key roles in lipid synthesis. Transgenic mice expressing a constitutively active form of SREBP1 develop fatty livers (41). Emerging lines of evidence suggest that lipid metabolism is regulated by various stress-inducible transcription factors, such as hypoxia-inducible factors (HIFs) and endoplasmic reticulum (ER) stress-induced transcription factors (8, 9), indicating that energy metabolism is elaborately coupled with the adaptive stress response.
In the adaptive stress response, NF-E2-related factor 2 (Nrf2) is known to be a general regulator of antioxidative and detoxifying enzyme genes (31, 47). Nrf2 is a member of the cap'n'collar (CNC) family of transcription factors. Under static conditions, Nrf2 is rapidly ubiquitinated by the Keap1-Cul3 E3 ubiquitin ligase complex and degraded through the ubiquitin-proteasome pathway (5, 19, 53). However, upon exposure to electrophiles or oxidative stresses, Nrf2 accumulates in the nucleus, where it forms a heterodimer with small Maf proteins, binds to the antioxidant response element (ARE) or electrophile response element (EpRE) (7, 39), and activates gene expression (12, 13). Nrf2 gene-knockout mice show an increased susceptibility to stresses due to the impaired induction of ARE-dependent cytoprotective genes (12). Recent studies revealed that Nrf2 also contributes to lipid metabolism (10, 35). The genetic deletion of Nrf2 results in the rapid onset and progression of hepatic steatosis induced by a methionine-choline-deficient diet (3, 46, 56) and in differential gene expression of hepatic metabolism (49), while Nrf2 activation ameliorates high-fat diet-induced fatty liver (42).
Nrf1, another member of the CNC family, has emerged as an important transcription factor for functions in various types of cells (20, 23). Nrf1 gene knockout in mice is lethal at embryonic day 13.5 due to anemia and liver dysfunction (2). Central nervous system-specific Nrf1-knockout mice show progressive motor ataxia and neurodegeneration with an accumulation of polyubiquitinated proteins in their neurons (20, 23). Importantly, hepatocyte-specific Nrf1-knockout mice develop hepatic steatosis (33, 52). Nrf1 is also involved in the induction of the proteasome subunit genes (36, 45). However, in contrast to Nrf2, the molecular mechanism of how Nrf1 contributes to these functions has not been well-defined. While it has been reported that Nrf1 is anchored to the ER membrane (45, 51, 55), how Nrf1 activity is regulated through the interaction with the ER membrane remains to be elucidated. Similarly, relevant downstream target genes related to the hepatic steatosis in the Nrf1 mutant mice remain to be clarified.
To delineate the contribution of Nrf1 to hepatic lipid metabolism, in this study we examined the gene expression profiles of Nrf1-deficient mouse livers. We found that the expression of genes related to lipid metabolism, amino acid metabolism, and mitochondrial respiratory function was dysregulated in the Nrf1-deficient livers, suggesting that the lack of Nrf1 function leads to the perturbation of these metabolic pathways. An important observation is that these pathways were not substantially affected in the livers of either Nrf2-deficient or Keap1 gene-knockdown (KD) mice, implying that Nrf1 and Nrf2 play distinct roles in liver metabolism. We found that the mRNA levels of two important transcriptional coactivators for metabolic enzyme genes, Lipin1 and PGC-1β (for PPARγ coactivator 1β), were markedly decreased in the Nrf1-deficient mouse livers. Chromatin immunoprecipitation (ChIP) analyses showed that Nrf1 binds to the AREs in regulatory regions of the Lipin1 and PGC-1β genes. These results thus demonstrate that Nrf1 serves as a novel regulator of hepatic lipid metabolism through regulation of the Lipin1 and PGC-1β genes.
MATERIALS AND METHODS
DNA constructs.
For the reporter analysis, DNA fragments containing the AREs in the Lipin1 promoter (5′-ACG CTC CTG CCG CTG AGC TGT GAC TCA GCC AGA GAA CTG AG-3′), Lipin1 intron (5′-CAC ACC CTG CCC AGA GGC ACA CTT GCT GAG TCA GCA CCC CGG-3′), and PGC-1β intron (5′-TTG ATA GTG AGG GGA ACA TGC TGA CTC AGC AGC TCC GAA TAA-3′) were flanked by MluI and NheI sites and cloned into the pRBGP3 vector (11) to generate Lipin1 promoter ARE-Luc, Lipin1 intron ARE-Luc, and PGC-1β intron ARE-Luc, respectively. The short hairpin RNA (shRNA) expression construct targeting Nrf1 was based on a 19-mer sequence (5′-GGG ATT CGG TGA AGA TTT G-3′) present in the coding region of both human and mouse Nrf1 genes (36), followed by a complementary 19-nucleotide sequence, which was separated by a 9-nucleotide sequence (TTCAAGAGA), and cloned into the BglII and HindIII sites of the pSUPER.retro.puro vector (Oligoengine). The pSUPER control vector was used as previously described (54). To generate constructs expressing the carboxyl-terminal half of Nrf1, the mouse Nrf1 cDNA (G341-K741) was amplified by PCR using 3× FLAG-Nrf1 as a template with forward (5′-AGC CAT ATG GGC TGC AGT CAG GAC TTC TCC-3′) and reverse (5′-ATC CTC GAG TCA CTT CCT CCG GTC CTT TGG-3′) primers. The PCR products were digested with NdeI and XhoI and cloned into the pET-15b vector (Novagen) to generate 6×His-Nrf1CT.
Mouse.
The Nrf1-conditional-knockout (CKO) and -knockout alleles (33), Nrf2-knockout allele (12), and Keap1-KD allele (48) were as described previously. Albumin (Alb)-Cre transgenic mice were kindly supplied by the Jackson Laboratory. The mice were given water and rodent chow ad libitum and kept under specific-pathogen-free conditions. All mice were handled according to the regulations of the Standards for Humane Care and Use of Laboratory Animals of Tohoku University and Guidelines for Proper Conduct of Animal Experiments of the Ministry of Education, Culture, Sports, Science, and Technology of Japan.
Histological and biochemical analyses.
To visualize the hepatic lipid content, the livers were embedded in OCT compound (Tissue-Tek). The frozen sections were stained with oil red O (Muto Pure Chemicals) and counterstained with hematoxylin. The plasma alanine aminotransferase (ALT) activity was measured as previously described (33).
RNA purification and qPCR analyses.
Total RNA was extracted using an Isogen RNA extract kit (Nippon Gene) and reverse transcribed to cDNA using SuperScript III (Invitrogen). Quantitative PCR (qPCR) was performed with PCR master mix using a TaqMan probe or SYBR green and an ABI 7300 system (Applied Biosystems). The primers and probes for NAD(P)H:quinone oxidoreductase (Nqo1), glutamate-cysteine ligase catalytic subunit (Gclc), and thioredoxin reductase 1 (Txnrd1) detection were described previously (16). The sequences for the other primers used are shown in Table S1 in the supplemental material. The expression levels were normalized to those of the hypoxanthine-guanine phosphoribosyltransferase (HPRT) gene.
Microarray analyses and data mining.
Three independent RNA samples from each genotype of female mice were used for the microarray analyses. Agilent 4 × 44K whole-mouse genome oligonucleotide microarray slides were hybridized, washed, and scanned on an Agilent microarray scanner according to the Agilent protocol. The expression data were subjected to statistical analysis using GeneSpring software (Silicon Genetics, Redwood City, CA). The pathway analysis was conducted using the Reactome pathway enrichment tool (http://www.reactome.org). The gene set analysis was performed using the gene set enrichment analysis (GSEA) methods as default parameters (http://www.broadinstitute.org/gsea). Cluster (version 3.0) software was used for clustering, and the results were visualized using the Java Treeview program (http://jtreeview.sourceforge.net/).
Metabolome analysis.
Metabolome analysis was carried out by Human Metabolome Technologies (Yamagata, Japan), as previously reported (43). Briefly, livers were collected from female mice at 6 weeks of age and snap-frozen in liquid nitrogen. After homogenization in methanol, the water-extractable phase was subjected to capillary electrophoresis time-of-flight mass spectrometry (CE-TOF MS; Agilent Technologies). Signal peaks corresponding to isotopomers of 108 compounds, including the intermediates of the glycolytic system, the intermediates of the tricarboxylic acid (TCA) cycle, and amino acids, were extracted and quantified.
ChIP assays.
ChIP analysis was performed as described previously (40) with minor modifications. Briefly, liver tissues or cells were fixed with 1% formaldehyde for 10 min at room temperature and subsequently quenched with 0.125 M glycine. The fixed samples were lysed and sonicated. The antibody incubations were performed overnight at 4°C. The cross-linking was reversed overnight at 65°C. The purified DNA was analyzed by qPCR. The primer sequences used are shown in Table S1 in the supplemental material. The antibodies used were anti-Nrf1 (sc-13031; Santa Cruz), anti-Nrf2 (sc-13032; Santa Cruz), anti-MafG (30), and normal rabbit IgG (Santa Cruz). The values obtained from the immunoprecipitated samples were normalized to the input DNA.
Cell culture and generation of stable cell lines.
The mouse hepatoma cell line Hepa1c1c7 (Hepa1) was cultured in Dulbecco's modified Eagle's medium (Wako) supplemented with 10% fetal bovine serum and 1% penicillin-streptomycin (Gibco). To establish the Nrf1-knockdown cell lines, the Nrf1 shRNA plasmid was transfected into Hepa1 cells using Lipofectamine 2000 transfection reagent (Invitrogen). Stable transformants were selected by 2-μg/ml puromycin, and several clonal cell lines were established. To induce Nrf2 activity, the Hepa1 cells were treated with 100 μM diethylmaleate (DEM) for 4 or 6 h.
Luciferase assay.
Hepa1 cells were seeded at a density of 2 × 10⁵ cells per well in a 24-well plate. Luciferase vectors were cotransfected with or without the Nrf1 expression vector and pRL-TK (Promega) using Lipofectamine 2000 (Invitrogen). At 24 h posttransfection, the luciferase activities were measured using a luminometer (Berthold). The firefly luciferase activity was normalized to the Renilla luciferase activity. All samples were prepared in triplicate.
EMSA.
Electrophoretic mobility shift assay (EMSA) was performed as described previously (15) with minor modifications. Briefly, the expression vectors 6×His-Nrf1CT, 6×His-Nrf2CT, and 6×His-MafG 1-123 (22) were transformed into Escherichia coli BL21 Codon Plus (DE3)-RIL (Stratagene), and the induced proteins were purified using Ni-nitrilotriacetic acid agarose (Qiagen). The forward oligonucleotides were labeled with biotin at the 5′ end, annealed with the reverse oligonucleotides, and used as probes. The oligonucleotide sequences used are shown in Table S1 in the supplemental material. In the competition assays, a 200-fold excess of unlabeled annealed DNA was added. The reaction mixtures were incubated for 20 min at room temperature, and the reaction mixtures were loaded onto 5% TBE (Tris-borate-EDTA) polyacrylamide gels, transferred to a Zeta Probe nylon membrane (Bio-Rad), and visualized using a LightShift EMSA kit (Thermo Fisher Scientific). The sequences of the oligonucleotides used for EMSA are shown in Table S1 in the supplemental material.
Microarray data accession number.
The gene expression data are available through the Gene Expression Omnibus database (www.ncbi.nlm.nih.gov/projects/geo/) under accession number GSE35124.
RESULTS
Loss of Nrf1 leads to impairment of various hepatocellular functions.
In order to delineate the contribution of Nrf1 to the hepatic metabolisms, we investigated the gene expression patterns of the Nrf1-deficient mouse livers. For this purpose, we used mice harboring the floxed (flox) allele of Nrf1 (33). In this study, we first removed the neomycin resistance (Neo) gene from the Nrf1 floxed allele to attain efficient deletion of the Nrf1 gene by Cre enzyme (see Fig. S1A in the supplemental material). The resulting Nrf1 Neo-deleted (dN) allele was used in combination with Alb-Cre transgenic mice to knock out Nrf1 gene expression specifically in hepatocytes. The hepatocyte-specific Nrf1 gene-conditional-knockout mice (Nrf1-CKO; Nrf1dN/−:Alb-Cre) showed a significant increase in plasma ALT levels at 4 weeks of age, in accordance with the progressive loss of Nrf1 expression (Fig. 1A and B). While no obvious lipid deposits were found at 3 weeks of age (Fig. 1C and D), marked lipid accumulation was observed in the livers of Nrf1-CKO mice at 5 weeks of age (Fig. 1E and F). Serum triglyceride and total cholesterol levels were not significantly different between genotypes (see Fig. S1B in the supplemental material). These results showed that the Alb-Cre-mediated excision of the Nrf1 gene immediately results in impaired lipid metabolism.
Fig 1.

Deficiency of Nrf1 leads to impairment of hepatocellular functions. (A) Nrf1 mRNA expression in the livers from Nrf1dN/+ (control) and Nrf1dN/−:Alb-Cre (CKO) mice at 3, 4, and 6 weeks of age. Nrf1 mRNA expression was examined by qPCR. (B) Serum ALT activity in control and Nrf1-CKO mice. The data represent the mean ± SD (n = 3). P values are from Student's unpaired t test: *, P < 0.05; **, P < 0.01. (C to F) Liver sections from control and Nrf1-CKO mice at 3 weeks (C and D) and 5 weeks (E and F) of age were stained with oil red O. Bars, 100 μm.
We then performed transcriptional profiling of livers in Nrf1-CKO and control (Nrf1dN/+) mice at 6 weeks of age using microarray analyses. To minimize differences in age and time of sacrifice, which could affect metabolism, all animals were sacrificed at Zeitgeber time 9 (3 h before lights off). Using the statistical criterion of a ≥1.5-fold change with a probability P of ≤0.05 (t test), we identified approximately 1,500 upregulated and 1,700 downregulated genes in the Nrf1-CKO mice compared with the gene expression in the control mice. The differentially expressed genes were mapped to known pathways using the Reactome database (14). Consistent with previous studies (36, 45), the expression levels of the proteasome subunit genes were decreased in the Nrf1-CKO mice (Fig. 2A), suggesting that Nrf1 is indeed functional in the liver under normal conditions. In addition, genes involved in lipid metabolism, amino acid metabolism, the TCA cycle, and the mitochondrial respiratory chain were overrepresented among the downregulated gene sets (Fig. 2A; see Table S2 in the supplemental material). In contrast, genes involved in the cell cycle and DNA replication were also overrepresented in the upregulated gene sets (Fig. 2A; see Table S2 in the supplemental material), suggesting that cell cycle regulation is constitutively repressed by Nrf1 or aberrantly affected in the livers of Nrf1-deficient mice. To further confirm these observations, the whole expression data were subjected to GSEA. Again, the gene sets related to lipid metabolism, amino acid metabolism, and the mitochondrial respiratory chain and the gene set related to the cell cycle were enriched among the downregulated and upregulated genes in the Nrf1-CKO mice, respectively (Fig. 2B and data not shown). To identify phenotypes associated with gene expression alterations in Nrf1-CKO mice, we performed a metabolome analysis using a CE-TOF MS that targets water-soluble, charged metabolites. We observed several metabolic changes, such as an increase in amino acids and a decrease in TCA cycle metabolites, which are in line with the decreased expression of amino acid metabolism enzyme and TCA cycle enzyme genes in Nrf1-CKO mice (Nrf1dN/dN:Alb-Cre) (Fig. 3A and B; see Table S3 in the supplemental material).
Fig 2.

Microarray analyses to identify the enrichment of genes associated with various metabolic pathways. (A) Table of Reactome pathways significantly enriched with genes that are downregulated or upregulated in Nrf1-CKO mouse livers. Complete lists of the downregulated and upregulated genes are shown in Table S2 in the supplemental material. (B) GSEA histograms for the gene sets involved in fatty acid metabolism, oxidative phosphorylation, and cell cycle regulation. The nominal P values of these gene sets are all less than 0.001, and the normalized enrichment scores are 1.28, 1.52, and −1.70, respectively. At the bottom of each plot, the spectrum of gene expression observed in the microarray is shown. The left side of the graphs indicates reduced expression and the right side indicates increased expression in the Nrf1-CKO mice. (C) Expression of representative PPARα target genes (Acox1, Hadh, Akr1d1, Hmgcs2, and Fads1) was examined by qPCR. (D) Expression of genes related to methionine metabolism (Mat1a, Ahcy, Gnmt, and Nnmt) was examined by qPCR. RNA samples were prepared from the livers of control and Nrf1-CKO mice at 6 weeks of age. These data represent the mean ± SD (n = 3). P values are from Student's unpaired t test: *, P < 0.05. The expression of each gene in the control mouse was set to 1.
Fig 3.

Metabolome analyses of Nrf1-deficient liver. (A and B) Relative concentrations of amino acids (A) and TCA cycle metabolites (B) in control (Nrf1dN/dN) and Nrf1-CKO (Nrf1dN/dN:Alb-Cre) mouse livers are shown as the mean ± SD (n = 3). P values are from Student's unpaired t test: *, P < 0.05; **, P < 0.01.
We noticed that the levels of expression of a group of PPARα target genes (37) were decreased in Nrf1-CKO mice (see Table S2 in the supplemental material). The qPCR results confirmed that the levels of expression of PPARα target genes, such as those for acyl coenzyme A oxidase 1, palmitoyl (Acox1), hydroxyacyl coenzyme A dehydrogenase (Hadh), aldo-keto reductase family 1, member D1 (Akr1d1), 3-hydroxy-3-methylglutaryl coenzyme A synthase 2 (Hmgcs2), and fatty acid desaturase 1 (Fads1), were decreased in the Nrf1-CKO mice (Fig. 2C), suggesting a dysregulation of PPARα-mediated gene expression. We also noticed that several genes related to methionine metabolism, those for including methionine adenosyltransferase I alpha (Mat1a), S-adenosylhomocysteine hydrolase (Ahcy), glycine N-methyltransferase (Gnmt), and nicotinamide N-methyltransferase (Nnmt), were also downregulated in the livers of the Nrf1-deficient mice (Fig. 2D). These results clearly showed that the loss of Nrf1 leads to an impairment of various hepatocellular functions, including lipid and amino acid metabolism.
Loss of Nrf2 does not significantly affect the gene sets regulated by Nrf1.
As Nrf1 and Nrf2 share certain functional properties (26), there exists a possibility that these transcription factors regulate the same gene sets. To test this possibility, we examined the gene expression profiles of the Nrf2-knockout and Keap1-KD (Keap1KD/−) mouse livers, in which Nrf2 was constitutively activated, by microarray analyses and compared the results with those for the Nrf1-deficient mouse livers (Fig. 4A). Among the downregulated genes in the Nrf1-CKO mice, the expression of only a small fraction was significantly changed in the Nrf2-knockout or Keap1-KD mice (Fig. 4B and C). We examined whether the metabolic pathways that were impaired in the Nrf1-CKO mice (Fig. 2A) were also altered in the Nrf2-knockout or Keap1-KD mice. The results indicated that the pathways related to lipid metabolism, amino acid metabolism, proteasomal degradation, the TCA cycle, and the mitochondrial respiratory chain were not significantly affected in the Nrf2-knockout or Keap1-KD mouse livers (Fig. 4D). In contrast, typical Nrf2 target genes, such as phase II detoxification enzyme genes and antioxidant enzyme genes, were significantly reduced and induced in Nrf2-knockout and Keap1-KD mice, respectively (Fig. 4E). These results thus support our contention that Nrf1 and Nrf2 play distinct roles in hepatocellular functions.
Fig 4.

Microarray analyses reveal differential gene expression profiles in the livers of Nrf1-CKO, Nrf2-knockout, and Keap1-KD mice. (A) The genotypes used for microarray analyses are shown. (B) Heat map of differentially regulated genes (≥1.5-fold change at P ≤ 0.05 [t test]) in Nrf1-CKO mice and expression data for the Nrf2-knockout and Keap1-KD mice are shown. (C) Venn diagram indicating the degree of overlap among the genes decreased in the Nrf1-CKO mice, the genes decreased in Nrf2-knockout mice, and the genes increased in Keap1-KD mice. (D and E) Heat maps of the genes that were differentially expressed in the Nrf1-CKO mice and that belong to the categories of lipid metabolism (asterisks indicate PPARα target genes), amino acid metabolism, proteasome subunits, TCA cycle, mitochondrial respiratory chain, and typical Nrf2 target genes are shown together with the expression data for the Nrf2-knockout and Keap1-KD mice. The colors of the heat map reflect the log2-fold-change values relative to the expression of each gene in the control mice. The gene symbols used here are consistent with those used in the Mouse Genome Informatics database.
Nrf1-dependent expression of transcriptional coregulators for metabolic enzyme genes.
We characterized the Nrf1 contribution to the regulation of various metabolic pathways. In this regard, it should be noted that in microarray analyses the expression of several transcription factors and coactivators for metabolic enzyme genes, such as PPARα, Lipin1, and PGC-1β, were decreased in the livers of Nrf1-CKO mice (Fig. 4D and data not shown). To gain further insights into the Nrf1-dependent regulation of the metabolic pathways, we examined expression levels of the mRNAs for transcription factors and coactivators regulating hepatic lipid metabolisms. Consistent with the microarray analysis data, the levels of expression of the PPARα, Lipin1, and PGC-1β genes were all decreased in the livers of Nrf1-CKO mice at 6 weeks of age (Fig. 5A), while the levels of expression of PGC-1α and SREBP1 were not significantly changed in the control and Nrf1-CKO mice (Fig. 5A). The PPARγ transcript level was rather increased in the Nrf1-CKO mice compared with that in control mice (Fig. 5A). Similar results were obtained in the 4-week-old Nrf1-CKO mice that did not show severe steatosis (Fig. 5A). These results showed that Nrf1 is a potential regulator of PPARα, Lipin1, and PGC-1β.
Fig 5.

Expression of transcriptional regulators associated with hepatic lipid metabolism in Nrf1-deficient livers. (A) mRNA expression was examined by qPCR in the livers of Nrf1dN/+ (control) and Nrf1dN/−:Alb-Cre (CKO) mice at 4 and 6 weeks of age. The data represent the mean ± SD (n = 3). P values are from Student's unpaired t test: *, P < 0.05; **, P < 0.01. The expression of each gene in the control mouse was set to 1. (B) Nrf1 knockdown results in the reduced expression of PPARα, Lipin1, and PGC-1β. Hepa1 cells stably expressing shRNA targeting Nrf1 (KD) or a nonsilencing control gene were used. mRNA expression in five independent clones was detected by qPCR. The data represent the mean ± SD (n = 5); **, P < 0.01. The expression of each gene in the control mouse was set to 1.
There remains a possibility that the reduction of PPARα, Lipin1, and PGC-1β mRNAs was secondary to the hepatic steatosis. To exclude this possibility, we examined how reduction of Nrf1 expression affected the expression of these genes in a cell culture system. We knocked down Nrf1 expression in the mouse hepatoma cell line Hepa1 using RNA interference-mediated gene silencing. We made five independent cell lines by stably expressing shRNA that specifically targeted Nrf1. The shRNA resulted in the effective reduction of the endogenous Nrf1 mRNA level but not the Nrf2 mRNA level (Fig. 5B). Showing very good agreement with the in vivo data, the Nrf1 knockdown significantly reduced PPARα, Lipin1, and PGC-1β gene expression, while the levels of expression of the Nrf2 target genes, such as Nqo1 and Txnrd1, were not changed significantly (Fig. 5B). Collectively, these in vivo and in vitro experiments argue that PPARα, Lipin1, and PGC-1β are target genes of Nrf1.
Nrf1 and small Maf proteins bind to the regulatory regions of Lipin1 and PGC-1β.
These observations prompted us to determine whether Nrf1 directly regulates the expression of PPARα, Lipin1, and PGC-1β genes. We searched the sequences of the PPARα, Lipin1, and PGC-1β genes and found several putative ARE motifs in their regulatory regions (Fig. 6A). To determine whether Nrf1 and its obligatory heterodimeric partner, small Maf proteins, directly bound to these ARE motifs, we performed ChIP analyses. The chromatin from Hepa1 cells was immunoprecipitated using specific antibodies, and the amount of precipitated DNA was examined by using qPCR. The results showed that Nrf1 was recruited to the AREs in the Lipin1 promoter and the intron regions of the Lipin1 and PGC-1β genes but not to those in the PPARα promoter and 3′ untranslated region (UTR) (Fig. 6B). MafG, the most abundant small Maf protein in the liver, was recruited to all AREs tested in this analysis (Fig. 6C). Notably, MafG strongly bound to the AREs in the intron regions of the Lipin1 and PGC-1β genes. This binding might reflect the presence of Maf recognition elements (MAREs) overlapping the AREs (Fig. 6A). MAREs have GC sequences located at both ends of the core sequence and are specifically recognized by small Maf homodimers (21, 32). These ChIP analyses support the notion that Nrf1 directly regulates the expression of Lipin1 and PGC-1β through the AREs.
Fig 6.
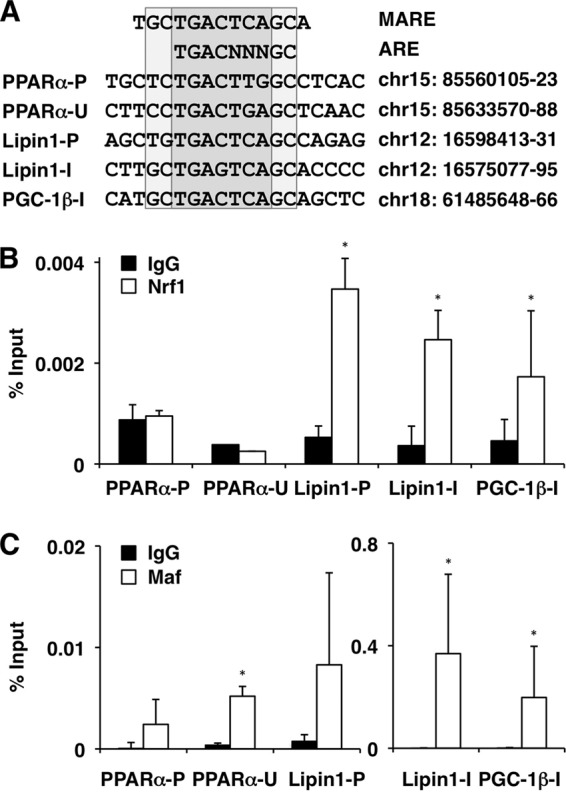
Nrf1 and MafG are recruited to the AREs of the Lipin1 and PGC-1β genes. (A) Alignment of MARE and ARE found in the regulatory regions of PPARα, Lipin1, and PGC-1β. The chromosome numbers and positions on the chromosome are indicated according to the Mouse Genome Informatics database (NCBI37/mm9). P, promoter; U, 3′ UTR; I, intron. (B and C) ChIP assays were performed with chromatin extracts from Hepa1 cells using normal IgG and anti-Nrf1 or anti-MafG antibodies and analyzed by qPCR with primers flanking the AREs in the promoter and 3′ UTR of PPARα, the promoter and intron of Lipin1, and the intron of PGC-1β. The data represent the mean ± SD (n = 3 to 6). P values are from Student's unpaired t test: *, P < 0.05.
Nrf1 activates transcription via the AREs of Lipin1 and PGC-1β.
We then wished to analyze whether these putative AREs confer Nrf1-dependent transcriptional activity to these transcriptional coactivators. To this end, DNA fragments containing the ARE motif were inserted upstream of luciferase reporter genes, and the resulting constructs were transfected into Hepa1 cells with or without the Nrf1 expression vector. The reporter constructs containing the ARE of either the Lipin1 or PGC-1β intron showed significantly increased luciferase activities upon the expression of Nrf1 (Fig. 7A). In contrast, the construct containing the ARE of the Lipin1 promoter showed an increase of basal reporter activity, but no further activation was observed upon the addition of the Nrf1 expression vector (Fig. 7A). These results suggest that Nrf1 activates transcription through binding to the AREs in the Lipin1 and PGC-1β gene introns.
Fig 7.
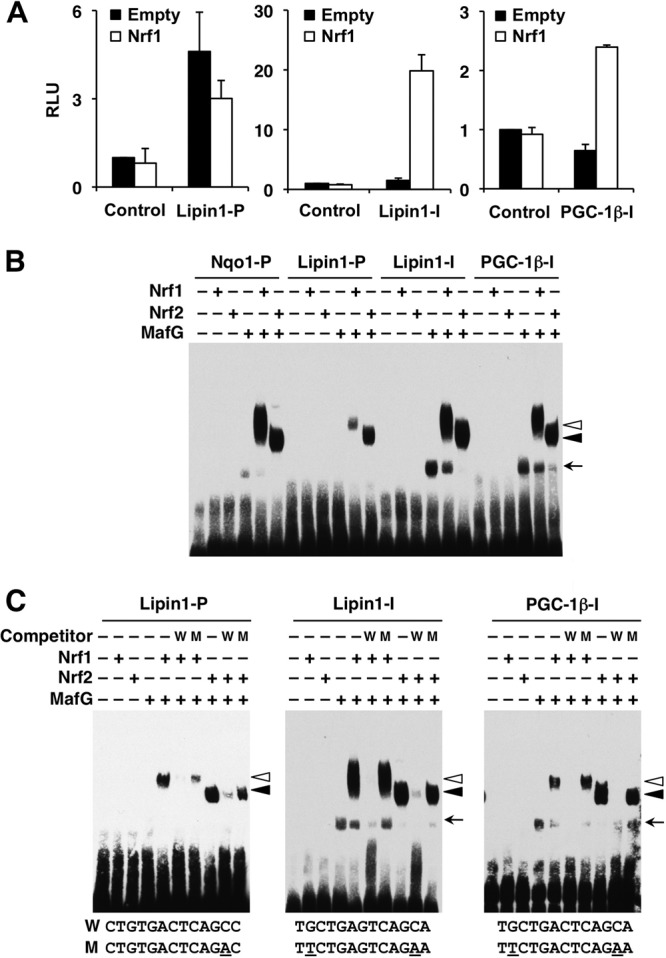
Nrf1 binds to the AREs of the Lipin1 and PGC-1β genes and activates transcription in vitro. (A) Hepa1 cells were cotransfected with luciferase reporter constructs containing the AREs from the Lipin1 promoter, Lipin1 intron, or PGC-1β intron with or without the Nrf1 expression vector. The average values ± SD are shown (n = 3). The vertical axis indicates relative luciferase units (RLU). The normalized firefly luciferase activity in the absence of effector plasmids is set to 1. (B) EMSA analysis was performed with biotin-labeled probes containing the AREs from the Nqo1 promoter, Lipin1 promoter, Lipin1 intron, and PGC-1β intron regions. MafG and Nrf1 or Nrf2 proteins were incubated with the probes, and the protein-DNA complexes and free probes were resolved by electrophoresis. (C) MafG and Nrf1 or Nrf2 proteins were incubated in combination in the absence or presence of a 200-fold molar excess of unlabeled competitor DNA. The wild-type (W) and mutated (M) ARE or MARE sequences are shown. The mutated sequences are underlined. Open arrowheads, closed arrowheads, and arrows, Nrf1-MafG heterodimer, Nrf2-MafG heterodimer, and MafG homodimer complex, respectively.
To obtain in vitro evidence that the Nrf1-MafG heterodimer binds to the AREs in the Lipin1 and PGC-1β genes, we performed EMSA. To examine the binding specificity of Nrf1 and Nrf2, we exploited Nrf1-MafG and Nrf2-MafG heterodimers and assessed their binding to these AREs and the ARE from the Nqo1 gene, a typical Nrf2 target gene. The results showed that both Nrf1-MafG and Nrf2-MafG heterodimers bound to the AREs of the Lipin1 promoter, Lipin1 and PGC-1β introns, and Nqo1 promoter with almost comparable affinity (Fig. 7B), except the binding affinity of the Nrf1-MafG heterodimer for the ARE from the Lipin1 promoter was slightly weaker than that for the ARE from Nqo1. Notably, the MafG homodimer also bound to the AREs in the Lipin1 and PGC-1β introns (Fig. 7B), consistent with the ChIP data showing that MafG is strongly enriched in these regions (Fig. 6C). The binding specificity was confirmed by a competition analysis using mutant or wild-type oligonucleotides. The addition of excess amounts of unlabeled wild-type oligonucleotides abolished the binding activity of both Nrf1-MafG and Nrf2-MafG heterodimers, but mutant oligonucleotides did not show such competition (Fig. 7C). These results demonstrate that both Nrf1-MafG and Nrf2-MafG heterodimers bind to the AREs of the Lipin1 promoter, Lipin1 and PGC-1β introns, and Nqo1 promoter in vitro.
Nrf2 does not participate in the regulation of Lipin1 and PGC-1β.
We finally examined the possibility that Nrf2 might regulate the expression of the Lipin1 and PGC-1β genes, as the EMSA showed that not only Nrf1 but also Nrf2 bound to the AREs in the Lipin1 and PGC-1β genes in vitro. To this end, we treated Hepa1 cells with an Nrf2 inducer, DEM, and examined gene expression by qPCR. While Nrf2 target genes, such as Nqo1 and Gclc, were induced by DEM, the Lipin1 and PGC-1β genes were not induced (Fig. 8A, left). Similarly, the levels of expression of Nqo1 and Gclc were significantly induced in Keap1-KD mouse livers, but the levels of expression of Lipin1 and PGC-1β were not changed (Fig. 8A, right). Consistent with these data, ChIP analyses clearly demonstrated that Nrf2 was strongly recruited to the ARE of the Nqo1 promoter region but not to the AREs of the Lipin1 and PGC-1β genes in both DEM-treated Hepa1 cells and the Keap1-KD mouse livers (Fig. 8B). MafG was recruited not only to the ARE of Nqo1 but also to the AREs in the Lipin1 and PGC-1β gene regulatory regions (Fig. 8C). These results thus indicate that while Nrf2 can bind to the AREs of the Lipin1 and PGC-1β genes in vitro, Nrf2 does not participate in the regulation of Lipin1 and PGC-1β gene expression in vivo. Taken together, these results demonstrate the direct involvement of Nrf1 in the regulation of Lipin1 and PGC-1β gene expression and support our contention that Nrf1 and Nrf2 play distinct roles in the regulation of hepatic lipid metabolism.
Fig 8.

Nrf2 does not participate in the regulation of Lipin1 and PGC-1β genes. (A) Expression of Nqo1, Gclc, Lipin1, and PGC-1β in Hepa1 cells treated with 100 μM DEM or dimethyl sulfoxide (vehicle [Veh]) for 6 h (left) or in the livers of Keap1-KD mice (right). WT, wild type. mRNA expression was analyzed by qPCR. The data represent the mean ± SD (n = 3). (B and C) ChIP analyses were performed with chromatin extracts from Hepa1 cells (left) treated with 100 μM DEM or dimethyl sulfoxide (vehicle) for 4 h or from the livers of Keap1-KD mice (right) using anti-Nrf2 (B) or anti-MafG (C) antibodies. Normal IgG was used as a negative control. The amount of immunoprecipitated DNA was analyzed by qPCR with primers flanking the ARE regions in the Nqo1 promoter, the Lipin1 promoter, and the Lipin1 and PGC-1β introns. The third intron of the thromboxane synthase (Txs) gene was used as a negative control. The data represent the mean ± SD (n = 3 to 4). P values are from Student's unpaired t test between specific antibody and IgG control: *, P < 0.05; **, P < 0.01.
DISCUSSION
While it has been well documented that liver-specific Nrf1 knockout results in the display of hepatic steatosis in mouse (33, 52), how Nrf1 contributes to the hepatic lipid homeostasis has been largely unknown. In this study, we executed extensive transcriptional profiling with the livers of Nrf1-deficient mice and found that the Nrf1 deficiency leads to the dysregulation of several metabolic pathways. Of the various important target genes identified in the analyses, we focused on the transcriptional coactivators related to lipid metabolism. We found that Nrf1 directly regulates the expression of the Lipin1 and PGC-1β genes but that Nrf2 does not contribute to the regulation of these coactivator genes. These results demonstrate that Nrf1 regulates hepatic lipid metabolism by controlling the expression of key transcriptional regulators for the expression of metabolic enzyme genes.
Our gene expression profiling analyses revealed that the loss of Nrf1 significantly affects various cellular functions. The pathways related to lipid metabolism, amino acid metabolism, and the mitochondrial respiratory chain were especially impaired as a consequence of the Nrf1 deficiency. This dysregulation of metabolic enzyme levels of expression suggests that Nrf1 may also contribute to protein catabolism through regulation of the amino acid metabolism and proteasomal degradation of proteins. We surmise that the overall function of Nrf1 is to lead the energy homeostasis to catabolism. In this regard, it is interesting to note that in the microarray analyses the genes related to cell cycle control and DNA replication appear to be upregulated in the livers of Nrf1-CKO mice, suggesting that in the absence of Nrf1 the anabolic reactions within the cells are stimulated. The dysfunction of cell cycle regulation may also contribute to the pathogenesis of the livers in the Nrf1-CKO mice. However, there remains a possibility that the gene expression changes in Nrf1-deficient mouse livers might reflect the genome-wide compensatory reaction to the loss of Nrf1. Thus, it is important to assess the direct effect of Nrf1 loss, for instance, by means of genome-wide Nrf1 binding site studies.
In this study, we found that the Lipin1 and PGC-1β genes are the direct targets of Nrf1. The Lipin1 gene was discovered using a positional cloning approach to identify the genetic mutation responsible for the fatty liver dystrophic (fld) mouse phenotype (34). Lipin1 possesses phosphatidic acid phosphatase activity. Thus, the dysregulation of phosphatidic acid metabolism may also contribute to the phenotypes of the Nrf1-CKO mice. Lipin1 also acts as a coactivator of the PPARα/PGC-1α regulatory pathway and positively regulates oxidative metabolism of fatty acids (6). fld mice exhibit neonatal hepatic steatosis associated with the reduced expression of the proteins involved in lipid metabolism and a diminished rate of hepatic fatty acid oxidation (38). On the other hand, PGC-1β is required for the activation of estrogen-related receptor α (ERRα) and nuclear respiratory factor 1 (50), both of which are key transcription factors in regulating the respiratory chain reaction through the control of mitochondrial biogenesis (17). PGC-1β gene-knockout mice show an altered expression of mitochondrial oxidative metabolism genes and high-fat diet-induced hepatic steatosis (24, 44, 50). Therefore, one of the most intriguing possibilities deduced from this study is that the reduced levels of expression of Lipin1 and PGC-1β affect the transcriptional regulation assisted by PPARα, ERRα, and nuclear respiratory factor 1, eventually leading to the decreased expression of their target genes and to the steatosis in Nrf1-CKO mouse livers.
In addition to the compromised expression of the two metabolic coactivators, it seems likely that other abnormalities also contribute to the disturbance of lipid metabolism observed in the Nrf1-deficient livers. For example, the dysregulation of the methionine metabolic pathway (Fig. 2D) might be related to the progress of steatosis, as a choline-methionine-deficient diet induces hepatic steatosis (29). Mat1a and Gnmt genes were downregulated in the Nrf1-CKO mice, and loss of these genes is known to provoke liver steatosis (27, 28). However, the metabolome analysis shows that there are no significant differences in the levels of methionine and S-adenosylmethionine (see Table S3 in the supplemental material). Further studies are necessary to clarify the association between dysregulation of methionine metabolism genes and fatty liver phenotype in the Nrf1-deficient mouse liver.
This study has revealed that Nrf1 and Nrf2 play different roles. In contrast, one report suggests that these two factors share similar functions (26). Supporting the former notion, we previously found that Nrf1 selectively regulates the expression of metallothionein-1 and -2 in the liver (33). The present study showed that Nrf1 directly regulates the expression of the Lipin1 and PGC-1β genes but that Nrf2 does not regulate these genes. While our EMSA study showed that both Nrf1 and Nrf2 bind to the AREs in the Lipin1 and PGC-1β genes in vitro, ChIP analyses demonstrated that Nrf1 is specifically recruited to the AREs in the Lipin1 and PGC-1β genes. The molecular basis for this differential recruitment of Nrf1 and Nrf2 and the differential transactivation activity of Nrf1 and Nrf2 in vivo is under investigation, but our observations suggest that additional molecular mechanisms, such as the differential recruitment of cofactors or epigenetic modifications, might be involved in the establishment of target gene specificity of these CNC factors.
In conclusion, we identified Nrf1 to be a novel regulator of the Lipin1 and PGC-1β genes. The comprehensive gene expression analyses revealed that the loss of Nrf1 significantly affects various metabolic pathways in the liver, including lipid and amino acid metabolism. Results of our analyses suggest that Nrf1 contributes to the energy homeostasis through regulation of the catabolism of cellular components. Thus, it becomes important to assess the response of Nrf1 mutant mice to fasting or a high-fat diet. While it remains unknown how Nrf1 is regulated in the liver, the availability of nutrition may influence Nrf1 activity. We expect that identification and use of Nrf1 inducers will provide a more comprehensive insight into the Nrf1 function.
Supplementary Material
ACKNOWLEDGMENTS
We thank S. Sato, M. Ohtsuji, and G. Ishikawa for their help. We thank E. Naganuma and Y. Kawatani for assistance with the microarray analysis and the Biomedical Research Core of Tohoku University Graduate School of Medicine for technical support.
This study was supported in part by Grants-in-Aid for Creative Scientific Research (to M.Y.), for Scientific Research on Priority Areas (to M.Y.), for Scientific Research (to F.K. and M.Y.), and for Exploratory Research (to M.Y.) from the Ministry of Education, Science, Sports and Culture. This work was also supported by grants from the JST-ERATO project (to M.Y.), Naito Foundation (to M.Y.), Tohoku University Global COE Program for the Conquest of Diseases with Network Medicine (to M.Y.), and Mochida Pharmaceutical Co., Ltd. (to M.Y.).
Footnotes
Published ahead of print 14 May 2012
Supplemental material for this article may be found at http://mcb.asm.org/.
REFERENCES
- 1. Aoyama T, et al. 1998. Altered constitutive expression of fatty acid-metabolizing enzymes in mice lacking the peroxisome proliferator-activated receptor alpha (PPARalpha). J. Biol. Chem. 273:5678–5684 [DOI] [PubMed] [Google Scholar]
- 2. Chan J, et al. 1998. Targeted disruption of the ubiquitous CNC-bZIP transcription factor, Nrf-1, results in anemia and embryonic lethality in mice. EMBO J. 17:1779–1787 [DOI] [PMC free article] [PubMed] [Google Scholar]
- 3. Chowdhry S, et al. 2010. Loss of Nrf2 markedly exacerbates nonalcoholic steatohepatitis. Free Radic. Biol. Med. 48:357–371 [DOI] [PubMed] [Google Scholar]
- 4. Cohen JC, Horton JD, Hobbs HH. 2011. Human fatty liver disease: old questions and new insights. Science 332:1519–1523 [DOI] [PMC free article] [PubMed] [Google Scholar]
- 5. Cullinan SB, Gordan JD, Jin J, Harper JW, Diehl JA. 2004. The Keap1-BTB protein is an adaptor that bridges Nrf2 to a Cul3-based E3 ligase: oxidative stress sensing by a Cul3-Keap1 ligase. Mol. Cell. Biol. 24:8477–8486 [DOI] [PMC free article] [PubMed] [Google Scholar]
- 6. Finck BN, et al. 2006. Lipin 1 is an inducible amplifier of the hepatic PGC-1alpha/PPARalpha regulatory pathway. Cell Metab. 4:199–210 [DOI] [PubMed] [Google Scholar]
- 7. Friling R, Bensimon A, Tichauer Y, Daniel V. 1990. Xenobiotic-inducible expression of murine glutathione S-transferase Ya subunit gene is controlled by an electrophile-responsive element. Proc. Natl. Acad. Sci. U. S. A. 87:6258–6262 [DOI] [PMC free article] [PubMed] [Google Scholar]
- 8. Gordan JD, Thompson CB, Simon MC. 2007. HIF and c-Myc: sibling rivals for control of cancer cell metabolism and proliferation. Cancer Cell 12:108–113 [DOI] [PMC free article] [PubMed] [Google Scholar]
- 9. Hotamisligil GS. 2010. Endoplasmic reticulum stress and the inflammatory basis of metabolic disease. Cell 140:900–917 [DOI] [PMC free article] [PubMed] [Google Scholar]
- 10. Huang J, Tabbi-Anneni I, Gunda V, Wang L. 2010. Transcription factor Nrf2 regulates SHP and lipogenic gene expression in hepatic lipid metabolism. Am. J. Physiol. Gastrointest. Liver Physiol. 299:G1211–G1221 [DOI] [PMC free article] [PubMed] [Google Scholar]
- 11. Igarashi K, et al. 1994. Regulation of transcription by dimerization of erythroid factor NF-E2 p45 with small Maf proteins. Nature 367:568–572 [DOI] [PubMed] [Google Scholar]
- 12. Itoh K, et al. 1997. An Nrf2/small Maf heterodimer mediates the induction of phase II detoxifying enzyme genes through antioxidant response elements. Biochem. Biophys. Res. Commun. 236:313–322 [DOI] [PubMed] [Google Scholar]
- 13. Itoh K, et al. 1999. Keap1 represses nuclear activation of antioxidant responsive elements by Nrf2 through binding to the amino-terminal Neh2 domain. Genes Dev. 13:76–86 [DOI] [PMC free article] [PubMed] [Google Scholar]
- 14. Joshi-Tope G, et al. 2005. Reactome: a knowledgebase of biological pathways. Nucleic Acids Res. 33:D428–D432 [DOI] [PMC free article] [PubMed] [Google Scholar]
- 15. Kataoka K, Noda M, Nishizawa M. 1994. Maf nuclear oncoprotein recognizes sequences related to an AP-1 site and forms heterodimers with both Fos and Jun. Mol. Cell. Biol. 14:700–712 [DOI] [PMC free article] [PubMed] [Google Scholar]
- 16. Katsuoka F, et al. 2005. Genetic evidence that small Maf proteins are essential for the activation of antioxidant response element-dependent genes. Mol. Cell. Biol. 25:8044–8051 [DOI] [PMC free article] [PubMed] [Google Scholar]
- 17. Kelly DP, Scarpulla RC. 2004. Transcriptional regulatory circuits controlling mitochondrial biogenesis and function. Genes Dev. 18:357–368 [DOI] [PubMed] [Google Scholar]
- 18. Kersten S, et al. 1999. Peroxisome proliferator-activated receptor alpha mediates the adaptive response to fasting. J. Clin. Invest. 103:1489–1498 [DOI] [PMC free article] [PubMed] [Google Scholar]
- 19. Kobayashi A, et al. 2004. Oxidative stress sensor Keap1 functions as an adaptor for Cul3-based E3 ligase to regulate for proteasomal degradation of Nrf2. Mol. Cell. Biol. 24:7130–7139 [DOI] [PMC free article] [PubMed] [Google Scholar]
- 20. Kobayashi A, et al. 2011. Central nervous system-specific deletion of transcription factor Nrf1 causes progressive motor neuronal dysfunction. Genes Cells 16:692–703 [DOI] [PubMed] [Google Scholar]
- 21. Kurokawa H, et al. 2009. Structural basis of alternative DNA recognition by Maf transcription factors. Mol. Cell. Biol. 29:6232–6244 [DOI] [PMC free article] [PubMed] [Google Scholar]
- 22. Kyo M, et al. 2004. Evaluation of MafG interaction with Maf recognition element arrays by surface plasmon resonance imaging technique. Genes Cells 9:153–164 [DOI] [PubMed] [Google Scholar]
- 23. Lee CS, et al. 2011. Loss of nuclear factor E2-related factor 1 in the brain leads to dysregulation of proteasome gene expression and neurodegeneration. Proc. Natl. Acad. Sci. U. S. A. 108:8408–8413 [DOI] [PMC free article] [PubMed] [Google Scholar]
- 24. Lelliott CJ, et al. 2006. Ablation of PGC-1beta results in defective mitochondrial activity, thermogenesis, hepatic function, and cardiac performance. PLoS Biol. 4:e369 doi:10.1371/journal.pbio.0040369 [DOI] [PMC free article] [PubMed] [Google Scholar]
- 25. Leone TC, Weinheimer CJ, Kelly DP. 1999. A critical role for the peroxisome proliferator-activated receptor alpha (PPARalpha) in the cellular fasting response: the PPARalpha-null mouse as a model of fatty acid oxidation disorders. Proc. Natl. Acad. Sci. U. S. A. 96:7473–7478 [DOI] [PMC free article] [PubMed] [Google Scholar]
- 26. Leung L, Kwong M, Hou S, Lee C, Chan JY. 2003. Deficiency of the Nrf1 and Nrf2 transcription factors results in early embryonic lethality and severe oxidative stress. J. Biol. Chem. 278:48021–48029 [DOI] [PubMed] [Google Scholar]
- 27. Liu SP, et al. 2007. Glycine N-methyltransferase−/− mice develop chronic hepatitis and glycogen storage disease in the liver. Hepatology 46:1413–1425 [DOI] [PubMed] [Google Scholar]
- 28. Lu SC, et al. 2001. Methionine adenosyltransferase 1A knockout mice are predisposed to liver injury and exhibit increased expression of genes involved in proliferation. Proc. Natl. Acad. Sci. U. S. A. 98:5560–5565 [DOI] [PMC free article] [PubMed] [Google Scholar]
- 29. Mato JM, Martínez-Chantar ML, Lu SC. 2008. Methionine metabolism and liver disease. Annu. Rev. Nutr. 28:273–293 [DOI] [PubMed] [Google Scholar]
- 30. Motohashi H, et al. 2006. MafG sumoylation is required for active transcriptional repression. Mol. Cell. Biol. 26:4652–4663 [DOI] [PMC free article] [PubMed] [Google Scholar]
- 31. Motohashi H, O'Connor T, Katsuoka F, Engel J, Yamamoto M. 2002. Integration and diversity of the regulatory network composed of Maf and CNC families of transcription factors. Gene 294:1–12 [DOI] [PubMed] [Google Scholar]
- 32. Motohashi H, Shavit JA, Igarashi K, Yamamoto M, Engel JD. 1997. The world according to Maf. Nucleic Acids Res. 25:2953–2959 [DOI] [PMC free article] [PubMed] [Google Scholar]
- 33. Ohtsuji M, et al. 2008. Nrf1 and Nrf2 play distinct roles in activation of antioxidant response element-dependent genes. J. Biol. Chem. 283:33554–33562 [DOI] [PMC free article] [PubMed] [Google Scholar]
- 34. Péterfy M, Phan J, Xu P, Reue K. 2001. Lipodystrophy in the fld mouse results from mutation of a new gene encoding a nuclear protein, lipin. Nat. Genet. 27:121–124 [DOI] [PubMed] [Google Scholar]
- 35. Pi J, et al. 2010. Deficiency in the nuclear factor E2-related factor-2 transcription factor results in impaired adipogenesis and protects against diet-induced obesity. J. Biol. Chem. 285:9292–9300 [DOI] [PMC free article] [PubMed] [Google Scholar]
- 36. Radhakrishnan SK, et al. 2010. Transcription factor Nrf1 mediates the proteasome recovery pathway after proteasome inhibition in mammalian cells. Mol. Cell 38:17–28 [DOI] [PMC free article] [PubMed] [Google Scholar]
- 37. Rakhshandehroo M, Knoch B, Müller M, Kersten S. 2010. Peroxisome proliferator-activated receptor alpha target genes. PPAR Res. 2010:pii=612089. doi:10.1155/2010/612089 [DOI] [PMC free article] [PubMed] [Google Scholar]
- 38. Rehnmark S, Giometti CS, Slavin BG, Doolittle MH, Reue K. 1998. The fatty liver dystrophy mutant mouse: microvesicular steatosis associated with altered expression levels of peroxisome proliferator-regulated proteins. J. Lipid Res. 39:2209–2217 [PubMed] [Google Scholar]
- 39. Rushmore T, Morton M, Pickett C. 1991. The antioxidant responsive element. Activation by oxidative stress and identification of the DNA consensus sequence required for functional activity. J. Biol. Chem. 266:11632–11639 [PubMed] [Google Scholar]
- 40. Shang Y, Hu X, DiRenzo J, Lazar MA, Brown M. 2000. Cofactor dynamics and sufficiency in estrogen receptor-regulated transcription. Cell 103:843–852 [DOI] [PubMed] [Google Scholar]
- 41. Shimano H, et al. 1996. Overproduction of cholesterol and fatty acids causes massive liver enlargement in transgenic mice expressing truncated SREBP-1a. J. Clin. Invest. 98:1575–1584 [DOI] [PMC free article] [PubMed] [Google Scholar]
- 42. Shin S, et al. 2009. Role of Nrf2 in prevention of high-fat diet-induced obesity by synthetic triterpenoid CDDO-imidazolide. Eur. J. Pharmacol. 620:138–144 [DOI] [PMC free article] [PubMed] [Google Scholar]
- 43. Soga T, et al. 2006. Differential metabolomics reveals ophthalmic acid as an oxidative stress biomarker indicating hepatic glutathione consumption. J. Biol. Chem. 281:16768–16776 [DOI] [PubMed] [Google Scholar]
- 44. Sonoda J, Mehl IR, Chong LW, Nofsinger RR, Evans RM. 2007. PGC-1beta controls mitochondrial metabolism to modulate circadian activity, adaptive thermogenesis, and hepatic steatosis. Proc. Natl. Acad. Sci. U. S. A. 104:5223–5228 [DOI] [PMC free article] [PubMed] [Google Scholar]
- 45. Steffen J, Seeger M, Koch A, Krüger E. 2010. Proteasomal degradation is transcriptionally controlled by TCF11 via an ERAD-dependent feedback loop. Mol. Cell 40:147–158 [DOI] [PubMed] [Google Scholar]
- 46. Sugimoto H, et al. 2010. Deletion of nuclear factor-E2-related factor-2 leads to rapid onset and progression of nutritional steatohepatitis in mice. Am. J. Physiol. Gastrointest. Liver Physiol. 298:G283–G294 [DOI] [PubMed] [Google Scholar]
- 47. Sykiotis GP, Bohmann D. 2010. Stress-activated cap‘n’collar transcription factors in aging and human disease. Sci. Signal. 3:re3 doi:10.1126/scisignal.3112re3 [DOI] [PMC free article] [PubMed] [Google Scholar]
- 48. Taguchi K, et al. 2010. Genetic analysis of cytoprotective functions supported by graded expression of Keap1. Mol. Cell. Biol. 30:3016–3026 [DOI] [PMC free article] [PubMed] [Google Scholar]
- 49. Tanaka Y, et al. 2008. NF-E2-related factor 2 inhibits lipid accumulation and oxidative stress in mice fed a high-fat diet. J. Pharmacol. Exp. Ther. 325:655–664 [DOI] [PubMed] [Google Scholar]
- 50. Vianna CR, et al. 2006. Hypomorphic mutation of PGC-1beta causes mitochondrial dysfunction and liver insulin resistance. Cell Metab. 4:453–464 [DOI] [PMC free article] [PubMed] [Google Scholar]
- 51. Wang W, Chan JY. 2006. Nrf1 is targeted to the endoplasmic reticulum membrane by an N-terminal transmembrane domain. Inhibition of nuclear translocation and transacting function. J. Biol. Chem. 281:19676–19687 [DOI] [PubMed] [Google Scholar]
- 52. Xu ZR, et al. 2005. Liver-specific inactivation of the Nrf1 gene in adult mouse leads to nonalcoholic steatohepatitis and hepatic neoplasia. Proc. Natl. Acad. Sci. U. S. A. 102:4120–4125 [DOI] [PMC free article] [PubMed] [Google Scholar]
- 53. Zhang DD, Lo SC, Cross JV, Templeton DJ, Hannink M. 2004. Keap1 is a redox-regulated substrate adaptor protein for a Cul3-dependent ubiquitin ligase complex. Mol. Cell. Biol. 24:10941–10953 [DOI] [PMC free article] [PubMed] [Google Scholar]
- 54. Zhang J, et al. 2006. BRG1 interacts with Nrf2 to selectively mediate HO-1 induction in response to oxidative stress. Mol. Cell. Biol. 26:7942–7952 [DOI] [PMC free article] [PubMed] [Google Scholar]
- 55. Zhang Y, Crouch DH, Yamamoto M, Hayes JD. 2006. Negative regulation of the Nrf1 transcription factor by its N-terminal domain is independent of Keap1: Nrf1, but not Nrf2, is targeted to the endoplasmic reticulum. Biochem. J. 399:373–385 [DOI] [PMC free article] [PubMed] [Google Scholar]
- 56. Zhang YK, Yeager RL, Tanaka Y, Klaassen CD. 2010. Enhanced expression of Nrf2 in mice attenuates the fatty liver produced by a methionine- and choline-deficient diet. Toxicol. Appl. Pharmacol. 245:326–334 [DOI] [PMC free article] [PubMed] [Google Scholar]
Associated Data
This section collects any data citations, data availability statements, or supplementary materials included in this article.