Abstract
Histone lysine methylation and demethylation are considered critical steps in transcriptional regulation. In this report, we performed chromatin immunoprecipitation with microarray technology (ChIP-chip) analysis to examine the genome-wide occupancy of H3K9-me2 during all-trans-retinoic acid (ATRA)-induced differentiation of HL-60 promyelocytic leukemia cells. Using this approach, we found that KDM3B, which contains a JmjC domain, was downregulated during differentiation through the recruitment of a corepressor complex. Furthermore, KDM3B displayed histone H3K9-me1/2 demethylase activity and induced leukemogenic oncogene lmo2 expression via a synergistic interaction with CBP. Here, we found that KDM3B repressed leukemia cell differentiation and was upregulated in blood cells from acute lymphoblastic leukemia (ALL)-type leukemia patients. The combined results of this study provide evidence that the H3K9-me1/2 demethylase KDM3B might play a role in leukemogenesis via activation of lmo2 through interdependent actions with the histone acetyltransferase (HAT) complex containing CBP.
INTRODUCTION
Chromatin remodeling facilitated by various histone modifications is considered an important factor in the transcriptional regulation of target genes. Since the initial identification of Suv39h1, which is a histone lysine methyltransferase (HMTase), numerous other HMTases with different specificities toward histone lysine residues and target genes have been discovered (16, 22, 27). Histone lysine methylation is linked to both activation and repression of chromatin, and its activity is dependent on which lysine is targeted. Among these, methylation of histone H3K9 is one of the most intensively studied histone modifications. Histone H3K9 methylation by Suv39h1 is followed by binding of heterochromatin protein 1 (HP1) and association with corepressor complexes, defining the fundamental role of H3K9 methylation in heterochromatin formation and silencing of target genes (8, 17). Methylation of H3K9 by Suv39h1, ESET/SETDB1, and G9a further indicates the importance of this event in the silencing and repression of various target genes during disease development and progression (1, 6, 25). Although recent studies have demonstrated the potential role of histone modifiers in the development of leukemia, the underlying molecular mechanisms, such as target gene modulation and diverse interactions by these modifiers, remain to be determined.
Differentiation of the human promyelocytic leukemia cell line HL-60 can be induced toward granulocytes by all-trans-retinoic acid (ATRA) or dimethyl sulfoxide (DMSO), toward neutrophils by dimethylformamide (DMF), or toward monocytes/macrophages by phorbol esters, via either a monocytic or granulocytic pathway (3). Acute promyelocytic leukemia (APL) can be effectively treated with differentiation therapy using ATRA, which induces terminal differentiation followed by apoptosis. Although both biochemical and molecular studies have linked ATRA-mediated differentiation in leukemia cell lines with transcriptional regulation, the detailed mechanism and role of histone modification have not yet been fully determined. Recent studies have suggested that PML/RARα and PLZF/RARα fusion proteins recruited polycomb repressive complex 2 (PRC2) to the RARβ2 promoter (27). Mixed-lineage leukemia (MLL) or the MLL fusion protein has been shown to mediate both positive and negative regulation of target genes through the recruitment of different epigenetic regulators. Interestingly, components of the MLL complex and the H3K27 demethylase UTX complex are recruited to ATRA response genes after ATRA treatment and activate the transcription of Hox genes (19).
To gain further insight into the chromosome-wide dimethylation of histone H3K9 target sites in differentiated leukemia cells after ATRA treatment, we performed a chromatin immunoprecipitation (ChIP) assay using antibodies that recognize dimethylated H3K9. The precipitated DNA was hybridized to a promoter array, which allowed us to analyze the 3,500-bp upstream region and 750-bp downstream region of the transcriptional start site (TSS) of 13,000 human genes. By using this approach, we identified more than 220 target gene promoters, including that of KDM3B, which were repressed during ATRA-mediated differentiation.
In this study, we further focused on the JmjC domain-containing histone KDM3B and characterized its transcriptional regulatory role in leukemia via H3K9-me1/2 demethylase activity. Genome-wide analysis identified a subset of KDM3B target genes, including leukemic oncogene lmo2. KDM3B was recruited to the leukemogenic oncogene lmo2 promoter along with CBP and was found to function as a coactivator of the target gene. In addition, KDM3B was shown to function as an epigenetic regulator of lmo2-mediated leukemogenesis. Furthermore, KDM3B expression induced leukemic transformation by inhibiting leukemia cell differentiation and was upregulated in blood cells obtained from certain types of leukemia patients.
MATERIALS AND METHODS
Plasmid.
pOBT7-KDM3B (BC001202, amino acids 1003 to 1761, KDM3B isoform 3) was purchased from Open Biosystems. KDM3B isoform 3 was inserted into the pGEX-4T1 bacterial expression vector to construct GST-KDM3B fusion proteins and mammalian expression vectors. KDM3B (H558A) point mutants were constructed by Cosmo Genetech. In order to construct the mammalian expression vectors, we used modified pcDNA6-HA-myc-his (Invitrogen) and GFP-C1 (Clontech) to create the hemagglutinin (HA)-, myc-, and His-tagged KDM3B and green fluorescent protein (GFP)-tagged KDM3B proteins, respectively. Short hairpin RNA (shRNA) against human KDM3B (SHCLNG-NM-016604) and small interfering RNA (siRNA) against human KDM3B (L-020378-01-0010) were purchased from Sigma and Dharmacon, respectively. The effect of KDM3B on P1 promoter-directed expression was evaluated by RNA interference (RNAi) using the Knockout single-vector-inducible RNAi system (Clontech). siRNAs targeting KDM3B mRNA were designed by using the siRNA sequence designer software (Clontech). We produced a double-stranded oligonucleotide for shRNA plasmid construction containing the following primers from the 5′ to the 3′ end: sense primer, 5′-TCGAGGCCTGCAACTTGACTGATACTTCAAGAGAGTATCAGTCAAGTTGCAGGTTTTTTACGCGT-3′; antisense primer, 5′-CGGACGTTGAACTGACTATGAAGTTCTCTCATAGTCAGTTCAACGTCCAAAAAATGCGCATTCGA-3′. This oligonucleotide was cloned into the XhoI-HindIII site of the pSingle-tTS-shRNA vector (Clontech), in which shRNA is expressed under the control of the U6 promoter. siRNA against human lmo2 (sc-38027) was purchased from Santa Cruz Biotechnology.
Antibodies.
Antibodies against KDM3B (X-25, sc-101987; Santa Cruz Biotechnology), histone H3 (06-755; Millipore), lmo2 (N-16, sc-10497; Santa Cruz Biotechnology), and β-actin (sc-47778; Santa Cruz Biotechnology) were used for immunoblot analysis and the ChIP assay. anti-GFP (B-2, sc-9996; Santa Cruz Biotechnology), CBP (A-22, sc-369; Santa Cruz Biotechnology), and the p300/CBP-associated factor (PCAF) antibody (H-369, sc-8999; Santa Cruz Biotechnology) were used for immunoprecipitation. Antibodies against histone H3K4-me2 (07-030; Millipore), H3K9-me1 (07-450; Millipore)/H3K9-me2 (07-441; Millipore)/H3K9-me3 (17-625; Millipore), H3K27-me2 (07-452; Millipore), and H3K36-me2 (07-274; Millipore) were used for immunoblot analysis or immunocytochemistry.
Stable cell lines.
K562 (5 × 10⁶) cells were seeded into a 60-mm dish and were transfected with pSingle-tTs-shRNA-KDM3B using Lipofectamine 2000 (Invitrogen), after which the stably transfected clones were selected in medium containing 2.5 mg/ml of G418 (Sigma). Cells were cultured in RPMI 1640 in the presence or absence of doxycycline (Sigma) and supplemented with 10% of tetracycline (Tet) system-approved fetal bovine serum (FBS) (Clontech), which is a tetracycline-free serum that was developed for the tetracycline-controllable expression system. Forty-eight hours later, RNA extraction and reverse transcription were performed.
Chromatin immunoprecipitation with microarray technology (ChIP-chip) analysis.
ChIP was carried out as essentially described in the protocols from Millipore. Briefly, HL-60 cells were treated with 1 μM ATRA or DMSO and harvested 48 h later. Cells were cross-linked with 1% formaldehyde in the medium at 37°C for 10 min, followed by the addition of 125 mM glycine at room temperature for 5 min, and then scraped into SDS lysis buffer. Samples were further sonicated and diluted for immunoprecipitation with antibodies against H3K9-me2. The immunoprecipitates were eluted and cross-link reversed. DNA fragments were purified using a PCR purification kit (Qiagen). Chromatin-immunoprecipitated DNA was amplified in 2 steps, including a T7 Sequenase extension step using a random primer with a fixed sequence linker and a second step of amplification using the fixed sequence primer and Taq polymerase. The products were purified and labeled with amino-allyl-conjugated dUTP using the BioPrime labeling kit (Invitrogen) and a random primer. Cross-linking reactions were quenched with 125 mM glycine, and the Cy3-conjugated DNA and Cy5-conjugated background DNA were mixed and purified with the PCR purification kit. The purified probe was combined with hybridization buffer (5× SSC [1× SSC is 0.15 M NaCl plus 0.015 M sodium citrate], 25% formamide, 0.1% SDS). The hybridization mix was boiled for 5 min and centrifuged for 2 min before being applied to a prehybridized microarray. Microarrays were prehybridized with 5× SSC, 25% formamide, 0.1% SDS, and 1% bovine serum albumin (BSA) for 45 min at 42°C. Slides were hybridized for 12 to 16 h at 42°C and washed according to the manufacturer's conditions. ChIP-chip analysis was performed using oligonucleotide-based promoter tiling arrays from NimbleGen. Briefly, microarrays were scanned with an Axon 4000A scanner (Axon Instruments), and images were analyzed with SignalMap software. The data were filtered to remove spots with aberrant morphology or those with intensities below the threshold of detection, and then median ratios were normalized to background.
Immunocytochemistry.
293T cells were grown on chamber slides and transfected with GFP-KDM3B expression plasmids using Lipofectamine 2000 (Invitrogen). After 48 h of transfection, the cells were fixed with 4% paraformaldehyde and incubated with each antibody, washed, and stained with SYTO61 (Invitrogen). The slides were then mounted with Gel/Mount (BioMeda), and images were acquired with a confocal laser scanning microscope (Zeiss LSM5 Exiter).
Demethylase assay and mass spectrometry.
Demethylase assays were conducted as described previously (31). H3K9-me1 peptide [TARK(me1)STG], H3K9-me2 peptide [TARK(me2)STG], and H3K9-me3 peptide [TARK(me3)STG] were synthesized based on the N-terminal amino acid sequences of histone H3 (Peptron). Synthetic peptides (0.1 μg) were used as the substrates in the demethylase assay with GST-KDM3B. The reaction was stopped by 10% trichloroacetic acid (TCA) precipitation. After removing the precipitates by centrifugation, the supernatants were retrieved, and methylated peptides in the supernatants were analyzed by liquid chromatography-mass spectrometry (LC-MS) at the Korea Basic Science Institute.
Transcriptional activity assay.
For the transcriptional activity assay, 293T cells were seeded at 3 × 10⁴ cells/well in a 48-well plate and were cotransfected with 150 to 300 ng of the expression plasmid and 150 ng of the pGL2-lmo2 promoter (−661 to −330) reporter plasmid using Lipofectamine 2000. After 48 h, the cells were harvested and subjected to a luciferase assay (Promega). The level of β-galactosidase activity was used to normalize reporter luciferase. Data are expressed as the means of four replicates from a single assay. The results shown are representative of at least three independent experiments.
Immunoprecipitation.
For the interaction assays, 293T cells were cotransfected with pcDNA6-KDM3B, Gal4-CBP, or FLAG-PCAF, lysed in radioimmunoprecipitation assay (RIPA) lysis buffer, and then immunoprecipitated with anti-KDM3B, anti-CBP, or anti-PCAF antibodies and protein A/G-agarose beads (GenDEPOT). The bound proteins were analyzed in immunoblots with anti-KDM3B, anti-CBP, and anti-PCAF antibodies.
Reverse transcription and real-time PCR.
Total RNA samples from the KDM3B- or sh-KDM3B construct-transfected HL-60 and 293T cells were extracted using RNAiso Plus (TaKaRa) in accordance with the manufacturer's recommendations. Total RNA (2 μg) was used to synthesize cDNA. cDNA synthesis was primed using an oligo(dT) primer (Fermentas), and the quantified cDNA was used for KDM3B, lmo2, Raf-1, and Myc mRNA expression pattern analysis. The primer sequences were as follows: for lmo2, 5′-GCGCGGTGACTGTCCTTGAG-3′ (sense) and 5′-GTCTCTCCGGCAGAGCTTCC-3′ (antisense); for Raf-1, 5′-AGAGGTGATCCGAATGCAGGA-3′ (sense) and 5′-AGCAGCTCAATGGAAGACAGG-3′ (antisense); and for Myc, 5′-TACCCTCTCAACGACAGCAG-3′ (sense) and 5′-TCTTGACATTCTCCTCGGTG-3′ (antisense). The amplification reaction was performed under the following conditions: 40 cycles of denaturation at 94°C for 15 s, annealing at 60°C for 30 s, and extension at 72°C for 30 s. Dissociation curves were generated after each PCR run to ensure that a single product of the appropriate length was amplified. The mean threshold cycle (CT) and standard error were calculated from individual CT values obtained from three replicates per stage. The normalized mean CT was estimated as ΔCT by subtracting the mean CT of β-actin from those of KDM3B and lmo2. ΔΔCT was calculated as the difference between the control ΔCT and the values obtained for each sample. The fold change in gene expression, relative to the untreated control, was calculated as 2−ΔΔCT.
Microarray analysis.
For KDM3B target gene profiling, we used the Illumina HumanHT-12-v3-BeadChip (Illumina), which includes a bead pool of more than 48,000 unique bead types corresponding to 48,804 transcripts. Total RNA (500 ng) isolated from K562 cells stably expressing short hairpin RNA control (sh-CTL) and sh-KDM3B were reverse transcribed and amplified according to the protocols described in the Illumina TotalPrep RNA amplification kit manual (Ambion). In vitro transcription was then carried out to generate cRNA. cRNA (750 ng) was hybridized onto each array (two replicates for each condition) and then labeled with Cy3-streptavidin (Amersham Biosciences). The array was then scanned using a BeadStation 500 system (Illumina). The full data set was submitted to Gene Expression Omnibus under submission number GSE30294. The probe intensities were normalized using quantile normalization in BeadArray 1.10.0, an R/Bioconductor package. The probes were annotated using lumi 1.8.3, an R/Bioconductor package.
ChIP assay and real-time PCR.
HL-60 and 293T cells were transfected with KDM3B or sh-KDM3Bs, harvested after 48 h, and then cross-linked with 1% formaldehyde added to the medium for 10 min at room temperature, followed by the addition of 125 mM glycine for 5 min at room temperature. The samples were sonicated, and the lysates were subjected to immunoprecipitation using the indicated antibodies. The immunoprecipitates were eluted and reverse cross-linked, after which the DNA fragments were purified for PCR amplification. To analyze the KDM3B promoter region, primer sets consisting of the 457-bp region (nucleotides −1067 to −611; sense, 5′-CACAGAAGCCTTGGAGAAAGAACC-3′, and antisense, 5′-AAGTCTACGTGTTTCTCCATTCAA-3′) or the KDM3B distal promoter region (nucleotides −3036 to −2884; sense, 5′-CCCCACAAAGACAAGGAAGA-3′, and antisense, 5′-AAGCCTGGGCCACAGTATAA-3′) were used. A 488-bp fragment corresponding to nucleotides −687 to −200 of the lmo2 promoter and the 446-bp fragment (+243 to +688) of the lmo2 exonic region were PCR amplified. The primer sequences were as follows: for the lmo2 promoter, 5′-GGACCTGGGACCTCGAAC-3′ (sense) and 5′-GGGCTTCCTCCTCTCTCGGGAAG-3′ (antisense), and for the lmo2 exonic region, 5′-GCGCGGTGACTGTCCTTGAG-3′ (sense) and 5′-GTCTCTCCGGCAGAGCTTCC-3′ (antisense). For the analysis of the Myc and Raf-1 promoter regions, the primer sets consisted of the 248-bp fragment (nucleotides −710 to −463; sense, 5′-TAATCATTCTAGGCATCGTTTT-3′, and antisense, 5′-ATCATCGCAGGCGGAACAGCTG-3′) and the 180-bp fragment (nucleotides −430 to −251; sense, 5′-TGCCTCAGCCTCCCGAGTAGCTGGGAC-3′, and antisense, 5′-ACTTCCATTAAATATTTCATAGATGAGG-3′), respectively. The primer concentration for the real-time PCR was 0.2 μM/25 μl. The thermal cycler conditions were as follows: 15 min of holding at 95°C, followed by 45 cycles at 94°C for 15 s, 60°C for 30 s, and 72°C for 30 s (Bio-Rad).
Evaluation of myeloid differentiation.
HL-60 cells transfected with KDM3B or sh-KDM3B were treated with 1 μM ATRA. Granulocyte differentiation was evaluated 72 h after ATRA induction based on cell morphology on Wright-Giemsa-stained slides. The expression of CD11b and CD14 was detected 72 h after induction by fluorescence-activated cell sorter (FACS) analysis. For the FACS assay, the cells were stained with the CD14-allophycocyanin (APC) (eBiosience) and CD11b-phycoerythrin (PE) (Millipore) antibodies, which were measured using FACSAria I (BD Biosciences) at the National Instrumentation Center for Environmental Management (NICEM). The results were analyzed using the FACScan Cell Quest software (BD Biosciences).
Leukemia patient samples.
Mononuclear cells were obtained from the bone marrow of 30 leukemic patients at the time of diagnosis. Fourteen patients had precursor B cell-type acute lymphoblastic leukemia (ALL), six patients had TEL/AML1 ALL, three patients had early precursor B cell-type ALL, three patients had T cell-type ALL, four patients had AML-ETO-1-type ALL, and nine patients had acute myeloid leukemia (AML). Informed consent was obtained from the guardians of each patient, and study approval was obtained from the Institutional Review Board of Chonnam National University Hospital.
Oncomine database analysis.
The Oncomine database was used as previously described (23). Gene expression data of KDM3B were retrieved from the Oncomine website (www.oncomine.org). Data sets with differences in KDM3B expression between normal and cancer tissues were selected.
Statistical analysis.
Data are expressed as the means and standard deviations (SDs) of three or more independent experiments. Statistically significant effects (P < 0.05) were evaluated with Microsoft Excel. Differences between groups were evaluated by one-way analysis of variance (ANOVA), followed by Student's t test or Bonferroni's test as appropriate.
RESULTS
Identification of the H3K9-me2 target gene KDM3B during differentiation of a leukemia cell line by ATRA.
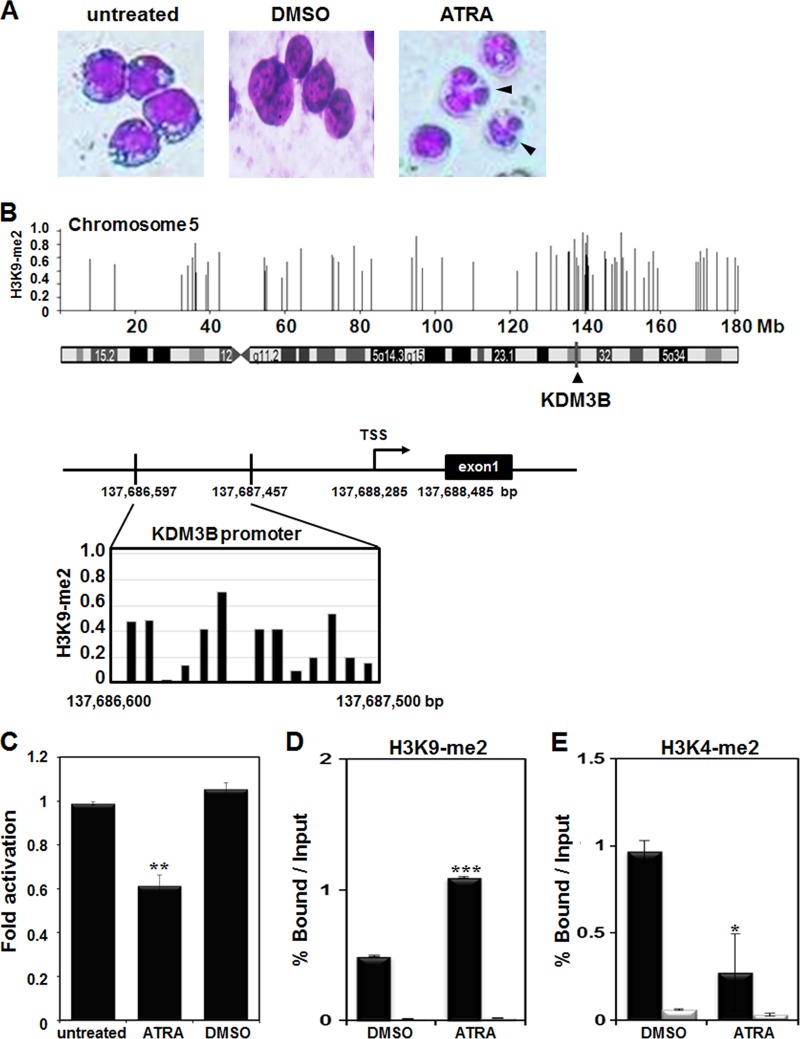
To identify direct targets of H3K9-me2 during differentiation in leukemia cells, we performed ChIP-chip analysis using a human promyelocytic leukemia cell line, HL-60, after treatment with ATRA. Differentiation of HL-60 cells by ATRA treatment was confirmed by Giemsa staining (Fig. 1A). Target TSS regions identified by ChIP-chip analysis are listed in Table 1. Among the profiled target TSS regions, we focused on KDM3B as a potential target gene of H3K9-me2 modification during leukemia cell differentiation. KDM3B is located on human chromosome 5 (5q31), and the target site of H3K9-me2 was located in the KDM3B promoter, indicating that modification may have occurred during differentiation (Fig. 1B). Full-length human KDM3B is 1,761 amino acids long and has 2 isoforms by alternative splicing. Isoform 2 is 1,417 amino acids long with the N-terminal amino acids 1 to 344 missing, and isoform 3 is 759 amino acids long with the N-terminal amino acids 1 to 1002 missing.
Fig 1.
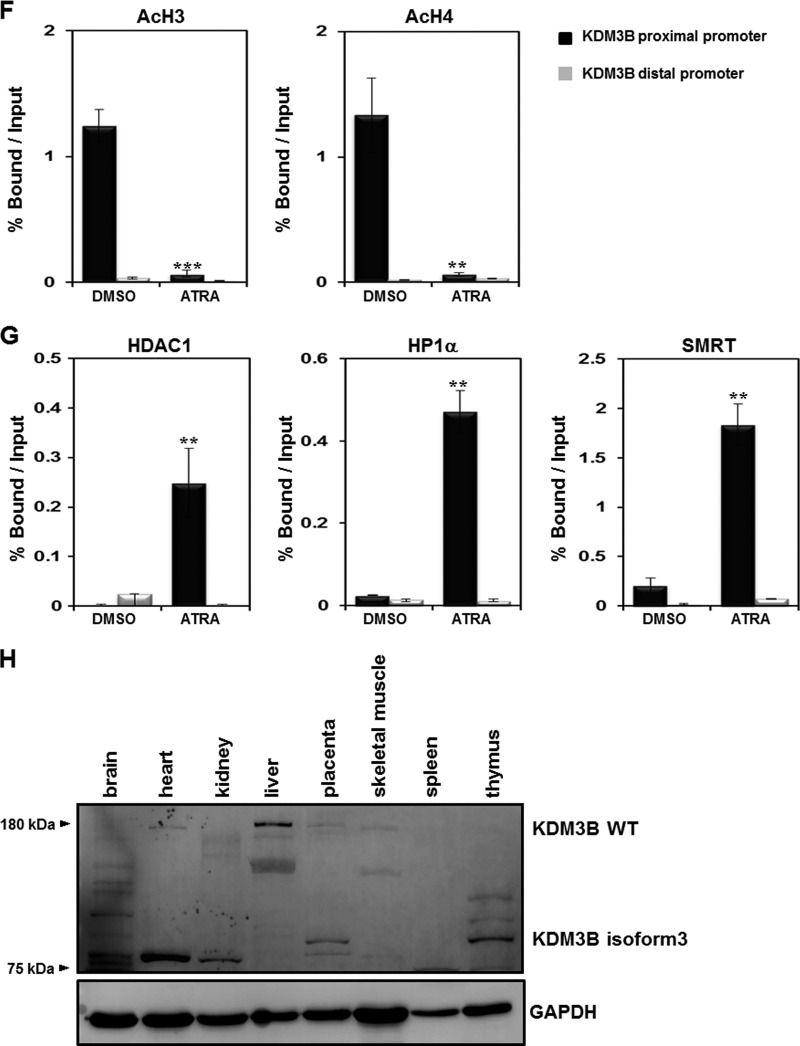
Identification of KDM3B as an H3K9-me2 target gene in ATRA-treated HL-60 cells. (A) Morphological observation of Giemsa-stained cells treated for 48 h with 1 μM ATRA. (B) The KDM3B locus from chromosome 5 is shown in 5′ to 3′ orientation. The magnified locus of KDM3B was highly enriched in H3K9-me2 in ATRA-treated HL-60 cells. (C) The expression level of KDM3B in ATRA-treated HL-60 cells was detected via real-time PCR. (D to G) ATRA-treated HL-60 cells were differentiated for 48 h. Cross-linked samples were immunoprecipitated with anti-H3K9-me2 (D), anti-H3K4-me2 (E), anti-AcH3 and anti-AcH4 (F), or anti-HDAC1, anti-HP1α, and anti-SMRT (G) antibodies. The precipitated DNA fragments were subjected to real-time PCR in the KDM3B proximal or distal promoter region. Normalization was performed using input DNA levels as controls in the same reaction. Results are shown as means ± SDs; n = 3. *, P < 0.05; **, P < 0.01; ***, P < 0.001. (H) A mouse adult tissue blot was hybridized to anti-KDM3B antibodies. GAPDH (glyceraldehyde-3-phosphate dehydrogenase) was used as a control.
Table 1.
Identification of H3K9-me2 target genes during differentiation of a leukemia cell line by ATRA
| Gene name | GenBank accession no. | Description | H3K9-me2 enrichment | FDRa | TSS (bp) | Distance (bp) |
|---|---|---|---|---|---|---|
| OR51E1 | BC022401 | Olfactory receptor, family 51, subfamily E, member 1 gene | 0.72 | 0 | 4,621,731 | −2,060 |
| ALCAM | AK127617 | Activated leukocyte cell adhesion molecule gene | 0.71 | 0 | 106,735,135 | −2,170 |
| NRG2 | NM_004883 | Neuregulin 2 gene | 0.59 | 0 | −139,403,063 | −1,877 |
| ANK3 | BX648574 | Ankyrin 3 gene, node of Ranvier (ankyrin G) | 0.59 | 0.02 | −62,163,254 | −2,974 |
| NUP210L | NM_207308 | Nucleoporin 210 kDa-like gene | 0.57 | 0.019 | −152,378,952 | −1,681 |
| EBF2 | AY700779 | Early B cell factor 2 gene | 0.57 | 0.019 | −25,801,349 | 472 |
| CREBBP | U85962 | CREB-binding protein gene | 0.57 | 0.168 | −3,870,723 | −1,613 |
| JAK2 | NM_004972 | Janus kinase 2 (a protein tyrosine kinase) gene | 0.47 | 0.092 | 4,975,244 | −1,772 |
| JAKMIP2 | NM_014790 | Janus kinase and microtubule interacting protein 2 gene | 0.35 | 0.013 | −147,142,445 | −1,102 |
| KDM3B | NM_016604 | Lysine (K)-specific demethylase 3B gene | 0.4 | 0.024 | 137,688,285 | −1,258 |
FDR, false discovery rate.
Verification of the H3K9 target gene KDM3B promoter.
HL-60 cells were treated with ATRA, and expression of KDM3B and recruitment of chromatin remodelers to the KDM3B promoter were analyzed. First, we verified that KDM3B expression was downregulated and that the KDM3B promoter was enriched with H3K9-me2 during ATRA-mediated differentiation of HL-60 cells (Fig. 1C and D). On the other hand, H3K4-me2 levels in the KDM3B promoter decreased during differentiation (Fig. 1E). As expected, histone acetylation of H3 and H4 significantly decreased when cells were treated with ATRA (Fig. 1F). Since histone modifications, such as H3K9-me2, can recruit various chromatin remodeling corepressors that alter the transcription of target genes, we examined the association between cofactors in the KDM3B promoter. As expected, enhanced association between the corepressors HDAC1, HP1α, and SMRT and the KDM3B promoter after ATRA treatment was observed by the ChIP assay and real-time PCR (Fig. 1G). Increased binding of this corepressor complex to the KDM3B promoter further confirmed that KDM3B was highly repressed during HL-60 cell differentiation induced by ATRA treatment. Using tissue blot analysis with multiple mouse tissue samples, we found that wild-type KDM3B was abundant in the liver, heart, and placenta whereas KDM3B isoform 3 was highly expressed in the placenta and thymus, a finding which implies the possible role of KDM3B in hematopoiesis (Fig. 1H).
KDM3B is a novel histone H3K9 demethylase.
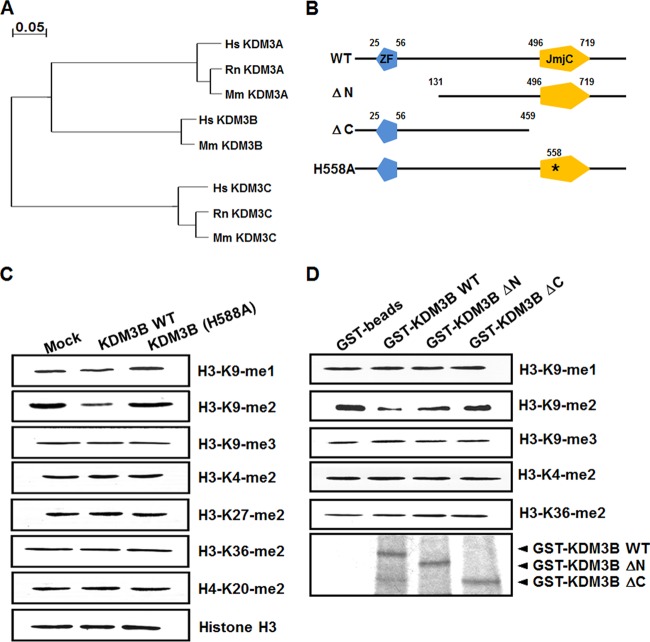
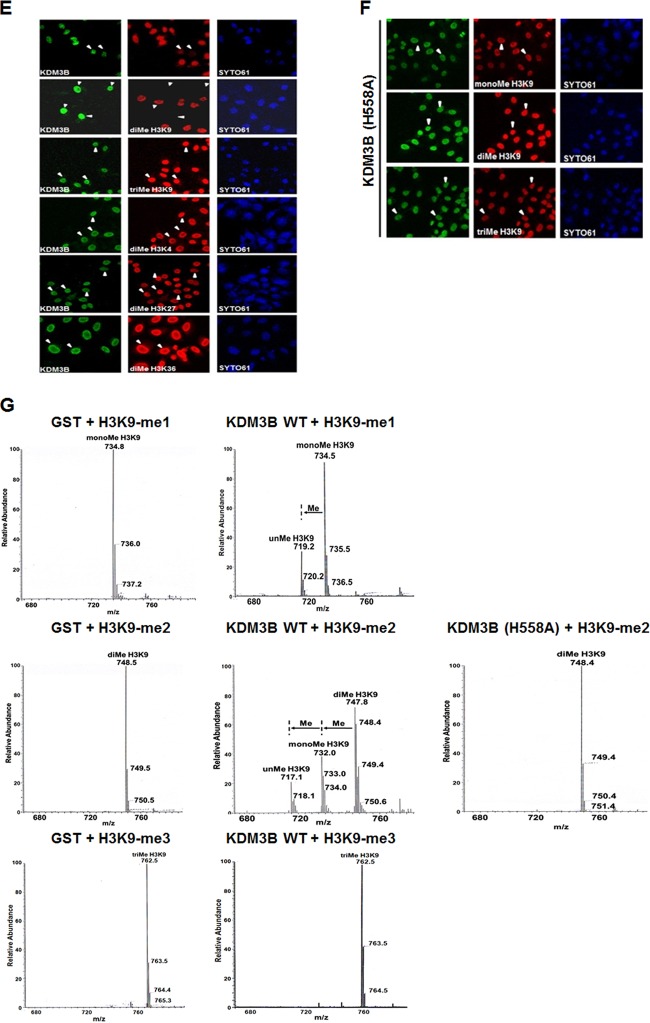
KDM3B belongs to a subfamily of proteins containing a JmjC domain that includes KDM3A (JHDM2A) and KDM3C (JHDM2C) (Fig. 2A). These proteins possess a protein domain structure containing a zinc finger (ZF)-like domain at their amino terminus and a JmjC domain near their carboxy terminus. A recent study showed that KDM3C demethylates H3K9-me1/2, indicating that KDM3B is a candidate H3K9 demethylase (15). To verify that KDM3B also possesses H3K9 lysine specificity, KDM3B was overexpressed in 293T cells, and histone modification was analyzed using specific antibodies. The results of this analysis showed that KDM3B specifically demethylated H3K9-me2 (Fig. 2C). No KDM3B demethylase activity on H3K9-me2 was observed in cells transfected with a KDM3B point mutant (H558A), in which a conserved histidine in the JmjC domain was replaced by an alanine (Fig. 2B and C). Similar results were obtained in an in vitro demethylase assay using glutathione S-transferase (GST)-purified KDM3B and core histones. Deletion of either the ZF-like motif (KDM3B ΔN) or the JmjC domain (KDM3B ΔC) resulted in a loss of H3K9-me2 demethylase activity (Fig. 2B and D). Next, we used immunofluorescence to analyze H3K9 demethylation by KDM3B. As was reported in other studies that examined KDM3B substrate specificity, we observed a significant loss of H3K9-me1/2 methylation in cells expressing KDM3B (Fig. 2E). However, an amino acid substitution in the JmjC domain (KDM3B H558A) of KDM3B completely abrogated its demethylase activity (Fig. 2F).
Fig 2.
KDM3B is an H3K9-specific demethylase. (A) Phylogenetic analysis based on protein sequence data of human, rat, and mouse KDM3 families. (B) Schematic representations of KDM3B with functional domains and the deletion mutants are shown. (C) 293T cells were transfected with KDM3B and KDM3B (H558A) point mutants, and histone demethylase activities were analyzed using immunoblot analysis with the indicated antibodies. (D) In vitro demethylase assays with GST-KDM3B or GST-KDM3B deletion mutants were conducted with core histones and then immunoblotted against the indicated antibodies. (E and F) 293T cells were transfected with GFP-KDM3B or GFP-KDM3B (H558A) and immunostained with antibodies against the indicated histone H3 lysine residues with different methylation marks. SYTO61 staining represents nucleic acids. Arrowheads indicate transfected cells. (G) H3K9-me1/2/3 peptides were incubated with GST-KDM3B, GST-KDM3B (H558A), or GST, and the modified peptides were analyzed via LC-MS.
Synthetic H3K9-me1/2/3 peptides were incubated alone or in the presence of KDM3B and analyzed by mass spectrometry. In this analysis, the H3K9-me1/2 peptides were shown to be converted into mono- and unmethylated peptides after incubation with KDM3B (Fig. 2G). No demethylase activity was detected when H3K9-me3 peptides were incubated with KDM3B (Fig. 2G). Western blot analysis showed that KDM3B had weak demethylation activity toward H3K9-me1, whereas mass spectrometry and immunofluorescence demonstrated that KDM3B could remove monomethyl groups from the peptides. This most likely occurred because a reduced level of monomethylation was masked by the production of monomethylated histones from a dimethylated histone by KDM3B.
KDM3B regulates the transcription of the lmo2 oncogene.
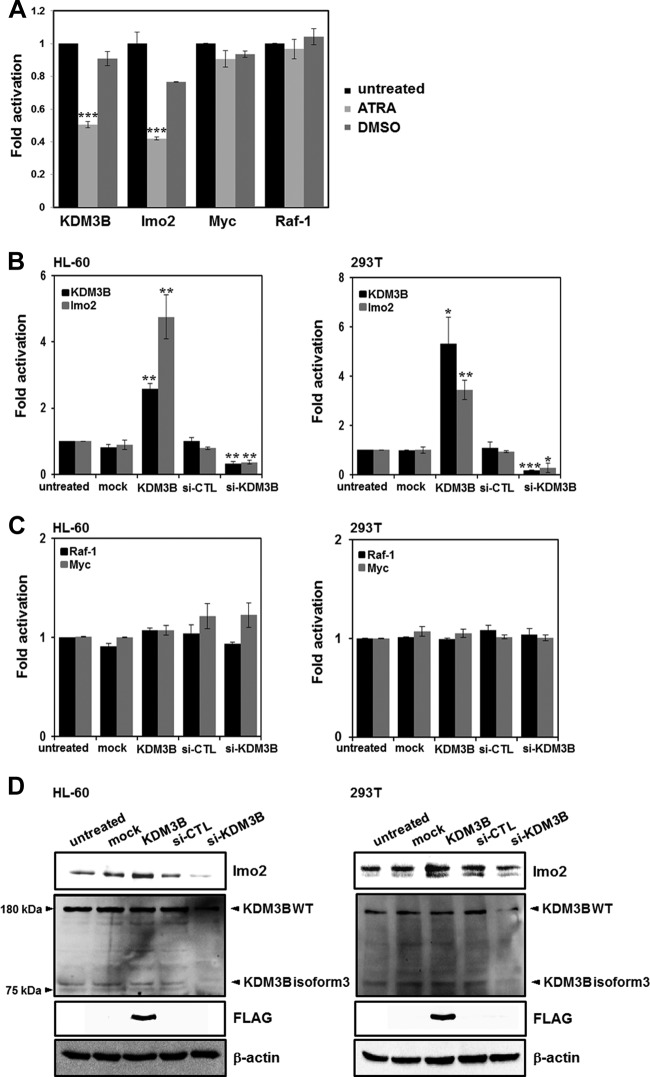
Since methylation of histone H3K9 has been reported to be involved in transcriptional repression, the demethylation of H3K9 by KDM3B indicates that KDM3B may play a role in transcriptional activation. Having established that KDM3B possesses both H3K9-me1/2 demethylase and transcriptional activation activities, we next searched for genes directly targeted by KDM3B. Downregulation of KDM3B gene expression during ATRA-induced differentiation of leukemia cells was in contrast to its abundant expression in tissues involved in hematopoiesis. This prompted us to focus on several leukemia-related oncogenes as potential candidate target genes of KDM3B. Specifically, the leukemic oncogene lmo2 showed decreased expression during ATRA-induced differentiation (Fig. 3A). On the other hand, the expression of other genes that play roles in similar oncogenic pathways, such as Raf-1 or Myc, was not altered (Fig. 3A). Next, we transfected HL-60 cells with KDM3B and determined the relative expression levels of selected oncogenes. In the real-time PCR analysis, the expression of lmo2 was significantly increased upon KDM3B overexpression and decreased by si-KDM3B treatments (Fig. 3B). These results indicated that lmo2 was a putative target gene regulated by KDM3B. In contrast, the expression of the other genes tested did not change (Fig. 3C). Protein expression levels were also determined by immunoblot analysis. Knockdown of KDM3B using si-KDM3B clearly led to the downregulation of lmo2 in HL-60 and 293T cells (Fig. 3D). Taken together, these results showed that KDM3B regulates transcription of lmo2.
Fig 3.
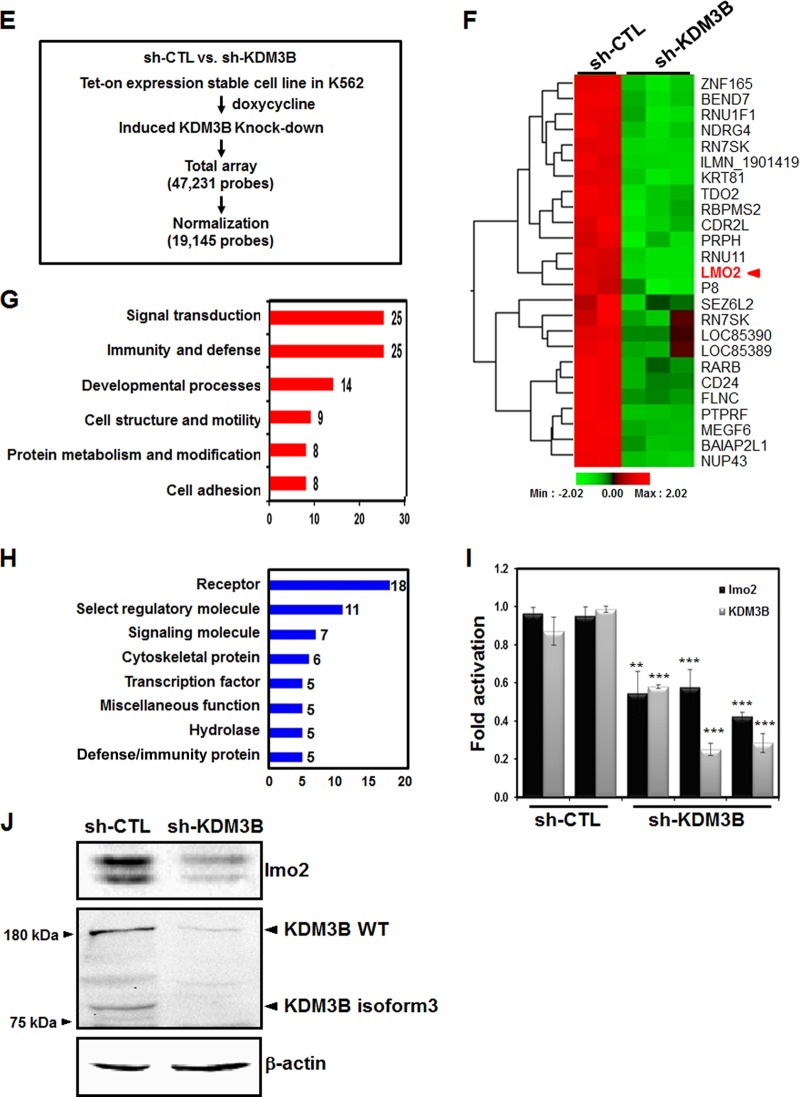
KDM3B activates the transcription of lmo2. (A) HL-60 cells were treated with ATRA or DMSO. After 48 h, real-time PCR was performed to compare the expression levels of the target genes. (B) The expression levels of KDM3B and lmo2 in HL-60 and 293T cells with transiently overexpressed or knockdown KDM3B were detected via real-time PCR. The results are representative of at least three independent experiments (± SDs). *, P < 0.05; **, P < 0.01; ***, P < 0.001. (C) The expression levels of Raf-1 and Myc in HL-60 or 293T cells with transiently overexpressed or knockdown KDM3B were detected via real-time PCR. The error bars represent 2−ΔΔCT ± the SD of three independent experiments. (D) si-KDM3B-treated HL-60 and 293T cells were lysed and immunoblotted with anti-lmo2 and anti-KDM3B antibodies. β-Actin was used as a loading control. (E) Flow chart showing the strategy used for microarray analysis and the KDM3B target gene identification process. (F) Identification of KDM3B target genes by hierarchical clustering; their expression changes in sh-CTL and sh-KDM3B knockdown stable cells were compared. Upregulated and downregulated gene clusters are represented by red and green, respectively. (G and H) Biological and molecular functional classification of KDM3B target genes. (I) The mRNA levels of lmo2 and KDM3B in KDM3B knockdown stable cells were analyzed by real-time PCR. Results are shown as means ± SDs; n = 3. ***, P < 0.001. (J) sh-CTL or sh-KDM3B knockdown stable cells were lysed and immunoblotted with anti-lmo2 and anti-KDM3B antibodies. β-Actin was used as a loading control.
To further investigate the effect of histone H3K9 demethylase KDM3B on leukemia, we performed global gene expression profiling with human erythroleukemic K562 cells stably expressing either control shRNA or KDM3B shRNA in a Tet-on inducible expression system (Fig. 3E). Three RNA samples of sh-KDM3B and two control shRNAs were analyzed by a microarray (Fig. 3F). A total of 112 genes were either up- or downregulated by more than 1.5-fold when KDM3B was depleted (Fig. 3F and data available on request). In the biological function analysis using panther classification (http://www.pantherdb.org), these genes were shown to be associated with several major functional groups, including signal transduction, immunity and defense, developmental processes, cell structure and motility, and protein metabolism and modification (Fig. 3G). Furthermore, these differentially expressed genes were shown to be associated with other major groups, including receptors, regulatory molecules, signaling molecules, and transcription factors, by using molecular function analysis (Fig. 3H). Notably, among the genes regulated by KDM3B, lmo2 was found to be downregulated in the microarray analysis when KDM3B was depleted (Fig. 3F). Downregulation of lmo2 in K562 cells stably expressing sh-KDM3B was further confirmed by real-time PCR and Western blot analysis (Fig. 3I and J).
KDM3B is recruited to the lmo2 promoter and induces transcription.
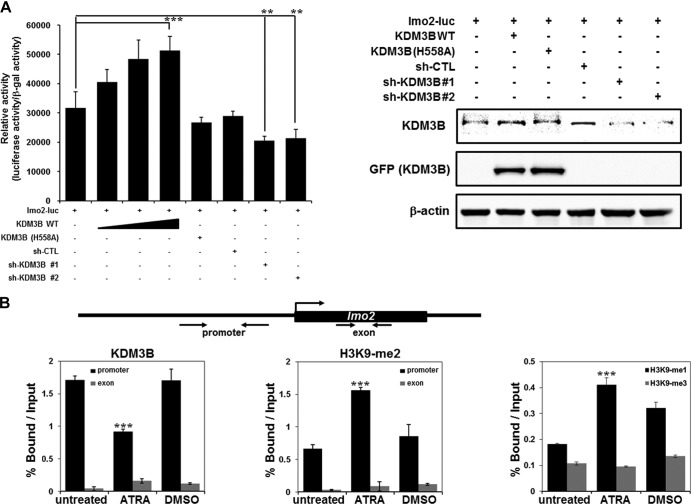
The LIM domain-only protein 2 (lmo2) gene is an important transcriptional regulator of erythropoiesis. Erythroid differentiation is completely blocked in both lmo2−/− embryonic stem (ES) cells and wild-type ES cells transduced with α-lmo2 antibodies (20, 30). To examine KDM3B-mediated transcriptional regulation of lmo2, we conducted a transfection assay using an lmo2-luc reporter system. Transcription of lmo2 was enhanced by KDM3B cotransfection (Fig. 4A). Using the KDM3B H558A mutant, we verified that the transcriptional activation of lmo2 by KDM3B was dependent on demethylase activity (Fig. 4A). Knockdown of KDM3B by two independent sh-KDM3Bs abolished transcriptional activation of lmo2 mediated by KDM3B (Fig. 4A). Taken together, these findings indicate that KDM3B promotes leukemogenesis by activating the transcription of the hematopoietic oncogene lmo2.
Fig 4.
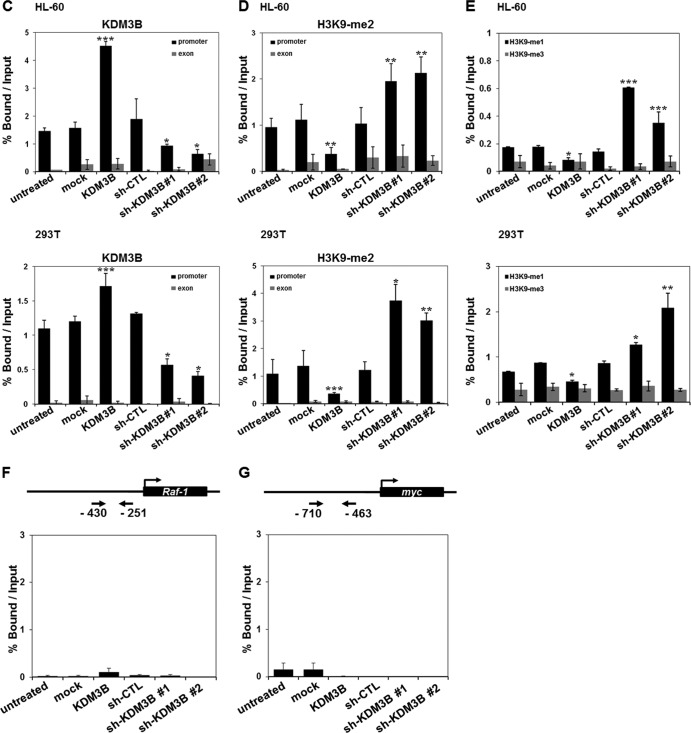
Recruitment of KDM3B to the lmo2 promoter. (A) 293T cells were transfected with the pGL-lmo2 promoter reporter and the indicated DNA constructs and sh-RNAs, and their cell extracts were assayed for luciferase activity. Luciferase activities were normalized to that of β-galactosidase. Each P value is the mean of five replicates from a single assay (left panel). The results are representative of at least three independent experiments (± SD). **, P < 0.01; ***, P < 0.001. Immunoblot analyses of the expression levels of endogenous and exogenous KDM3B in sh-KDM3B construct 1- or construct 2-transfected 293T cells were shown using anti-KDM3B and anti-GFP (right panel). (B) Schematic diagram of primer pairs in ChIP analysis (upper panel). Arrows indicate the primers used for real-time PCR amplification. ChIP analyses of the lmo2 promoter in ATRA-treated HL-60 cells were conducted using anti-KDM3B (left panel), anti-H3K9-me2 (middle panel), and H3K9-me1/3 (right panel) and examined via real-time PCR. Results are the means ± SDs; n = 3. ***, P < 0.001. (C to E) HL-60 (upper panel) or 293T (lower panel) cells were transfected with KDM3B and sh-KDM3Bs, and the ChIP assay and real-time PCR were performed using anti-KDM3B antibodies (C) to determine the methylation status of H3K9-me2 (D) and H3K9-me1/3 (E) in the lmo2 promoter or exonic region. Results are the means ± SDs; n = 3. *, P < 0.05; **, P < 0.01; ***, P < 0.001. (F and G) Schematic diagram of primer pairs in ChIP analysis (upper panel). Arrows indicate the primers for real-time PCR amplification. Transfected HL-60 cells with KDM3B and sh-KDM3Bs were analyzed by ChIP using anti-KDM3B antibodies. The immunoprecipitated DNA was amplified by PCR using the promoters of Raf-1 (F) and Myc (G). The results are representative of at least three independent experiments (± SD). *, P < 0.05; **, P < 0.01; ***, P < 0.001.
To further investigate the mechanisms underlying lmo2 transcriptional regulation via KDM3B, we performed ChIP analysis with real-time PCR using HL-60 cells. First, we observed decreased KDM3B recruitment as well as increased levels of H3K9-me2 and H3K9-me1 on the lmo2 promoter in the presence of ATRA, results which were consistent with the initial results of the ChIP-chip analysis (Fig. 4B). However, H3K9-me3 levels did not change under the same conditions (Fig. 4B). Next, we evaluated whether or not KDM3B can specifically target the lmo2 promoter when overexpressed. Figures 4C and D show that KDM3B was highly recruited to the lmo2 promoter, where it decreased H3K9-me2 methylation in both HL-60 (upper panel) and 293T (lower panel) cells. Knockdown of KDM3B by two different sh-KDM3Bs resulted in a significant reduction of KDM3B recruitment as well as an increase in H3K9-me1/2 methylation, but not H3K9-me3 methylation, on the lmo2 promoter in both HL-60 and 293T cells (Fig. 4C to E). Specific recruitment of KDM3B to the lmo2 promoter was validated by the absence of KDM3B recruitment to other oncogene promoters (Raf-1 or Myc) when KDM3B was either overexpressed or knocked down in HL-60 cells (Fig. 4F and G). Collectively, these results suggest that KDM3B specifically targets the lmo2 promoter and activates transcription through H3K9-me1/2 demethylase activity.
Functional connection between KDM3B and CBP.
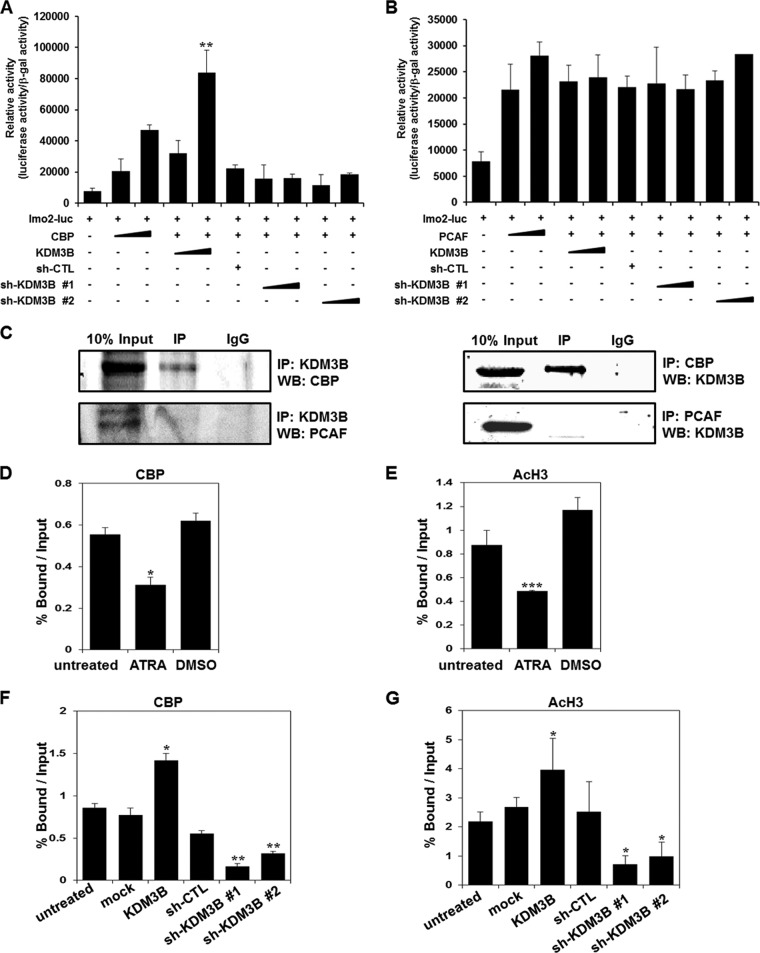
Having established that the histone demethylase KDM3B activates lmo2 transcription by removing the epigenetic repression marker H3K9-me, it is reasonable to speculate that this transactivation process might be facilitated further by a KDM3B-interacting coactivator complex. To determine whether or not histone acetyltransferase (HAT) activity is involved in the KDM3B-mediated transcriptional activation of lmo2, transcriptional activation of lmo2 was analyzed in the presence of HATs (CBP and PCAF) by using a luciferase reporter assay. Interestingly, KDM3B-mediated transactivation of lmo2 increased in the presence of CBP, but this was not observed upon the addition of PCAF (Fig. 5A and B). Furthermore, a significant reduction in lmo2 transcription by two independent sh-KDM3Bs, even in the presence of CBP, confirmed that KDM3B mediated coactivation with the HATs (Fig. 5A and B). This transactivation may have occurred due to the formation of a coactivator complex between KDM3B and CBP which may have induced lmo2 expression. To test this hypothesis, immunoprecipitation assays between KDM3B and HATs were carried out. These assays clearly showed that CBP, but not PCAF, strongly interacted with KDM3B, forming an activator complex during lmo2 transcription activation (Fig. 5C).
Fig 5.
KDM3B regulates lmo2 transcription via interaction with CBP. (A and B) 293T cells were transiently transfected with the lmo2 promoter reporter plasmid along with KDM3B, sh-KDM3Bs, and CBP (A) or PCAF constructs (B). The results are representative of at least five independent experiments (± SD). **, P < 0.01 compared with the untreated control. (C) 293T cells were transfected with pcDNA6-KDM3B, Gal4-CBP, and FLAG-PCAF. Immunoprecipitation was performed using anti-KDM3B, anti-CBP, anti-PCAF, or anti-immunoglobulin G (IgG) antibodies. A Western blot analysis was then conducted using anti-CBP, anti-PCAF, or anti-KDM3B antibodies. (D and E) ChIP analyses of the lmo2 promoter in ATRA-treated HL-60 cells were conducted using anti-CBP (D) or anti-AcH3 (E) antibodies. The results are expressed as means ± SDs; n = 3. **, P < 0.01; ***, P < 0.001. (F and G) HL-60 cells were transfected with KDM3B and sh-KDM3Bs, and the ChIP assay and real-time PCR were performed in the lmo2 promoter using anti-CBP (F) and anti-AcH3 (G) antibodies. The results are the means ± SDs; n = 3. *, P < 0.05; **, P < 0.01; ***, P < 0.001.
To verify whether CBP was recruited to the lmo2 promoter via KDM3B, we performed ChIP analysis with real-time PCR using HL-60 cells. The CBP recruitment decreased on the lmo2 promoter, as did the level of H3 acetylation in the ATRA-treated HL-60 cells (Fig. 5D and E). Also, CBP was highly recruited to the lmo2 promoter when KDM3B was overexpressed, and the recruitment decreased upon KDM3B knockdown in HL-60 cells (Fig. 5F). Consistent with CBP recruitment, the H3 acetylation level either increased or decreased upon KDM3B overexpression or knockdown, respectively (Fig. 5G). These results suggest that KDM3B and the CBP HAT complex are both physically and functionally associated in transcriptional activation of lmo2.
KDM3B arrests HL-60 cell differentiation and is overexpressed in leukemia patient tissue samples.
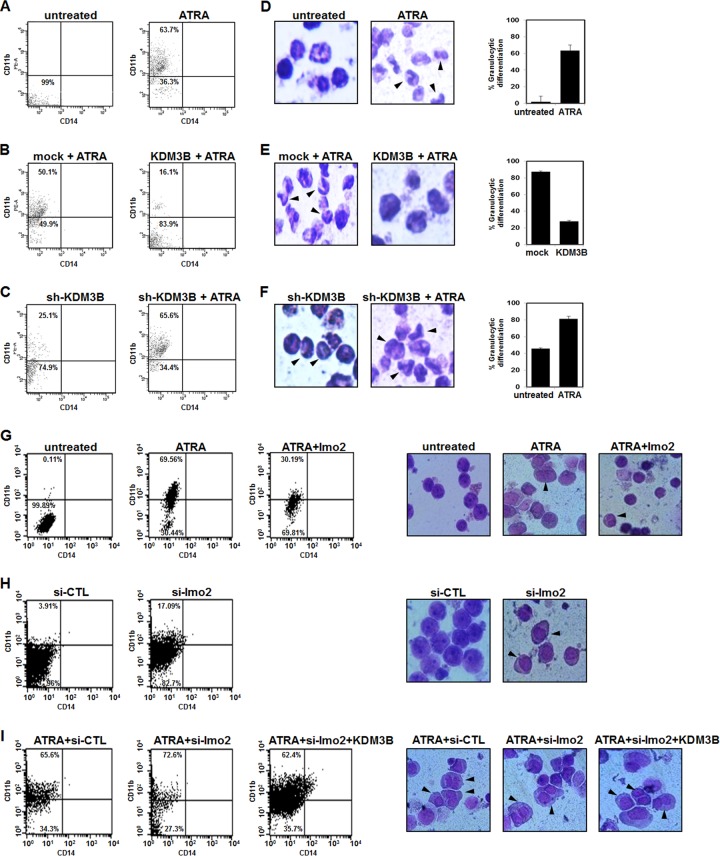
To investigate the potential role of KDM3B in leukemia cell differentiation, we examined the expression level of CD11b, a granulocytic differentiation marker, and CD14, a monocyte marker. The expression level of CD11b increased following ATRA treatment (63.7%) (Fig. 6A). Notably, KDM3B-transfected HL-60 cells clearly had a low expression level of the differentiation marker CD11b despite ATRA treatment (16.1%) (Fig. 6B). Interestingly, KDM3B knockdown by sh-KDM3B resulted in slight upregulation of CD11b expression (25.1%). Again, ATRA treatment in KDM3B knockdown cells had significantly higher levels of the differentiation marker (65.6%) (Fig. 6C). However, the induction of CD14 did not change under the same conditions (Fig. 6A to C). The effect of KDM3B on HL-60 cell differentiation was further confirmed by morphological observation using Giemsa staining (Fig. 6D to F). Cells with more-prominent cytoplasmic granules and larger nuclei were dominant in undifferentiated conditions (Fig. 6D, untreated, and E, KDM3B+ATRA), whereas increasing fractions of cells showed more banded and segmented neutrophils in differentiating conditions (Fig. 6D to F, arrow-marked cells). These results suggest that KDM3B can prevent granulocytic differentiation of HL-60 cells by ATRA treatment. The contribution of lmo2 regulation by KDM3B to leukemia cell differentiation was further investigated. As expected, the high expression level of CD11b induced by ATRA was downregulated by lmo2 overexpression (Fig. 6G). Again, HL-60 cells showed increased levels of CD11b when lmo2 was knocked down by si-lmo2 in the absence of ATRA treatment compared to those of si-CTL (Fig. 6H). When lmo2 was knocked down in the presence of ATRA, the CD11b expression level was further upregulated (72.6%). Finally, when we cotransfected KDM3B and si-lmo2 in ATRA-treated HL-60 cells, we could clearly observe that knockdown of lmo2 promotes HL-60 cell differentiation despite KDM3B overexpression (62.4%) (Fig. 6I). Those cells that underwent the differentiation process could be observed from undifferentiated cells by Giemsa staining and were marked with arrows (Fig. 6G to I, right panels). These results led us to the conclusion that regulation of lmo2 by KDM3B is crucial for HL-60 cell differentiation.
Fig 6.
KDM3B induces leukemic transformation. (A to C) Granulocytic differentiation was analyzed by FACS 72 h after ATRA treatment. Percentages of CD11b-positive cells in HL-60 cells after transfection with KDM3B or sh-KDM3B as follows: ATRA (A), KDM3B with ATRA (B), or sh-KDM3B with ATRA (C). (D to F) Morphological analysis and graphic representation of the morphological data of HL-60 cells 72 h after transfection with KDM3B or sh-KDM3B as follows: ATRA (D), KDM3B with ATRA (E), or sh-KDM3B with ATRA (F). (G and H) CD11b/CD14 expression following transfection with lmo2 or si-lmo2 by FACS: panel G, lmo2 with ATRA; panel H, si-lmo2. (I) HL-60 cells were treated with ATRA (1 μM) during 72 h after transfection with si-CTL, si-lmo2, or a combination of si-lmo2 and KDM3B (left panels). Cell morphology of ATRA-treated HL-60 cells analyzed by Giemsa staining after transfection with lmo2, si-lmo2, or KDM3B (right panels).
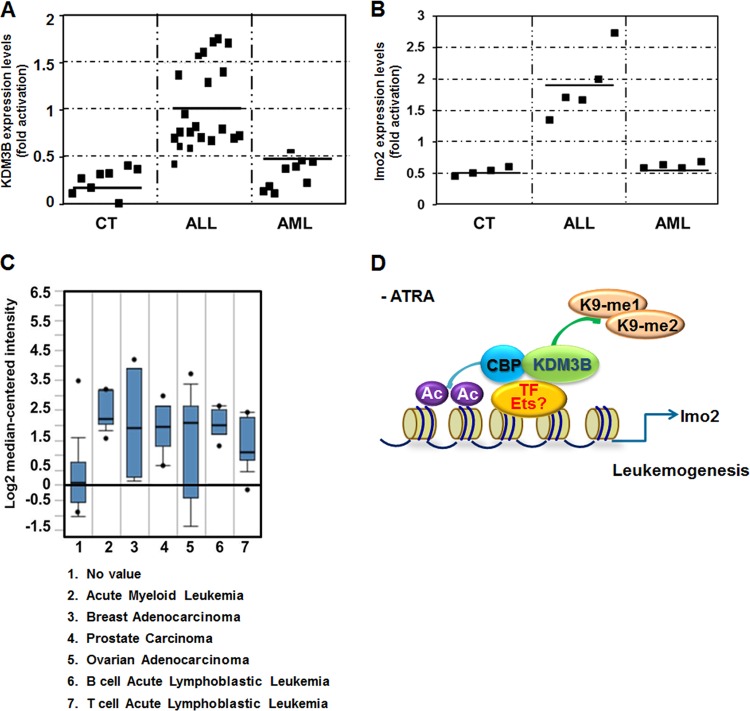
Since KDM3B was identified in HL-60 cells and is highly expressed in tissues involved in hematopoiesis, we investigated whether or not KDM3B expression was dysregulated in leukemia patients by measuring the levels of KDM3B expression in bone marrow mononuclear cells. Total proteins were isolated from tissues recovered from eight healthy subjects and 30 patients with different types of leukemia. After isolating mononuclear cells, cellular phenotypes were examined by flow cytometry, and the characteristics of the cells are shown in Table S3 in the supplemental material. Using reverse transcription PCR (RT-PCR) analysis with primers specific for KDM3B, KDM3B was found to be overexpressed in selected leukemia patients compared to expression in normal cells (data not shown). A more-detailed analysis confirmed a higher level of KDM3B protein expression in ALL patients than in AML-type leukemia patients (Fig. 7A). To further correlate KDM3B and lmo2 in ALL-type leukemia, we investigated whether the lmo2 expression is also increased in ALL patient samples. Consistently, lmo2 is more highly expressed in ALL-type patient samples than in AML-type patient and normal samples (Fig. 7B). These results suggest that KDM3B may play an important role via the regulation of lmo2 in certain types of leukemogenesis.
Fig 7.
KDM3B was overexpressed in ALL-type leukemia patient samples. (A and B) Each individual spot of KDM3B (A) and lmo2 (B) expression in total cells extracted from blood cells of healthy individuals and leukemia patients. Western blots were analyzed quantitatively in the spots by the Image J program. The data are averages of two independent experiments. (C) Boxplot of KDM3B expression in normal and cancerous tissues. 1, no value; 2, acute myeloid leukemia, P = 4.98E−5; 3, breast adenocarcinoma, P = 0.3E−5; 4, prostate carcinoma, P = 4.3E−4; 5, ovarian adenocarcinoma, P = 2.65E−4; 6, B cell acute lymphoblastic leukemia, P = 1.83E−3; 7, T cell acute lymphoblastic leukemia, P = 4.2E−4. All P values are calculated in comparison with column 1. (D) Model for regulation of lmo2 transcription by KDM3B in leukemogenesis.
DISCUSSION
In this study, we examined novel H3K9-me2 target genes during ATRA-mediated differentiation in HL-60 cells using ChIP-chip analysis. Among the target genes, the histone demethylase KDM3B was shown to be downregulated during leukemia cell differentiation via H3K9-me2 modification at the promoter.
Histone methylation-demethylation dynamics have been extensively studied and are recognized as important markers for a variety of biological processes, including transcription regulation. KDM3B, containing the JmjC domain, is a member of the KDM3 family that includes KDM3A (testis-specific gene A [TSGA]) and KDM3C (hormone receptor-interacting protein 8 [TRIP8]), which show H3K9-me1/2 demethylase activity in human and mice, respectively (15, 31). Initially, the gene was identified as 5q nuclear coactivator (5qNCA) and thought to have possible functions in myelodysplastic syndrome (MDS) and acute myeloid leukemia (AML) (14). KDM3A was also found to play a role in mouse spermatogenesis and obesity (21, 26). KDM3C was identified as an androgen receptor coactivator that regulates mouse steroidogenesis through H3K9 demethylation at the p450c17 promoter (15, 21). Our current study revealed that KDM3B is an H3K9-me1/2 demethylase that displays specific activity in vivo and in vitro in leukemogenesis and acts as a transcriptional coactivator.
Using both global gene expression profiling and searching for individual target genes, lmo2 was identified as a possible target gene of KDM3B. lmo2 is an important transcriptional regulator of erythropoiesis and has been reported to inhibit erythroid differentiation (18, 28). Studies on the epigenetic regulation of lmo2 transcription recently found that JAK2 phosphorylates H3Y41 and that HP1α exclusion results in lmo2 activation in leukemia cells (7). We demonstrated that KDM3B activated the expression of lmo2 through increased H3K9-me1/2 demethylase activity at the lmo2 promoter. Identifying upstream regulators of JAK2 and its impact on lmo2 in leukemia will be the topic of further studies.
Reports have shown that histone demethylase in multicomplexes was associated with other chromatin remodelers. For example, the H3K27 demethylase UTX, in association with the H3K4 HMTase MLL2, leads to the activation of target genes, such as Hox (4, 19). Interestingly, we found that KDM3B interacted with CBP but not PCAF, and this association further enhanced transcriptional activation of lmo2. Among the different HATs, CBP regulates various hematopoietic transcription factors and is involved in hematopoietic development and associated diseases (2). Another report suggested that different epigenetic mechanisms, such as histone deacetylase (NuRD) and demethylase (LSD1), interdependently regulate the transcription of key target genes involved in breast cancer (29). Therefore, it is not surprising that simultaneous histone demethylation of H3K9 by KDM3B and acetylation of H3/H4 by CBP activate target gene expression. Identification of multiple effectors forming a complex via direct binding during chromatin remodeling and subsequent transcriptional regulation of tissue-specific gene expression should allow for the further characterization of coactivation complexes, including those containing KDM3B and CBP, as well as their impact on specific gene expression during leukemogenesis.
Recent reports have suggested that histone demethylases, such as KDM4C (GASC1), KDM5B (Plu-1), and KDM8, play important roles in carcinogenesis (5, 10, 12). KDM4C is believed to cause HP1 delocalization through its H3K9-me2/3 demethylase activity and reverse oncogene silencing (5). Involvement of histone demethylases in carcinogenesis, particularly for leukemia, has been suggested by a number of recent studies. LSD1 is known to prevent H3K4 methylation mediated by MLL. Inhibition of LSD1 perturbs the differentiation of cells with a hematopoietic lineage (24). The hematopoietic transcription factor TAL1 is also negatively regulated by LSD1 (13). Furthermore, depletion of the H3K36 demethylase KDM2b/JHDM1b significantly inhibits leukemogenesis mediated by Hoxa9/Meis1 (11). To investigate whether or not KDM3B can induce leukemic proliferation, we performed a cell differentiation assay. Initially, the expression profile of the differentiation marker CD11b was found to be either downregulated or upregulated in overexpressed or knockdown KDM3B cells, respectively. These results indicate that KDM3B may modulate the differentiation of the leukemia cell line HL-60. Furthermore, lmo2 overexpression has been shown to offset ATRA-mediated differentiation, and knockdown of lmo2 promotes differentiation even though KDM3B was overexpressed. Interestingly, overexpression of KDM3B was observed in ALL-type leukemia patients but not AML-type leukemia patients. The reason for this difference is not clear. However, the human KDM3B gene is located at 5q31, and this region is frequently deleted in AML and myelodysplasia (14). It has been previously reported that there is a clear difference in gene expression patterns between AML and ALL. The study suggested that human leukemia subtype class discovery and class prediction between AML and ALL can be made based on gene expression profiles by DNA microarray (9). The significance of this specificity probably needs further investigation. The finding that lmo2 was also overexpressed in ALL-type patients further links the role of KDM3B in regulation of lmo2 expression to this particular type of leukemia.
To obtain further evidence of KDM3B involvement in leukemogenesis, we searched the Oncomine database to compare the expression levels of KDM3B in different types of leukemia to those in normal tissues. KDM3B was found to be upregulated in various types of leukemia compared to its expression in normal tissues (Fig. 7C). These data strongly suggest that KDM3B plays a role in leukemia, possibly through H3K9-me1/2 demethylation.
In summary, we have provided in vitro and in vivo evidence for the possible role of the H3K9-me1/2 demethylase KDM3B in leukemia through activation of the leukemic oncogene lmo2 (Fig. 7D). Our model suggests the existence of a transcription factor for lmo2 associating with KDM3B and CBP and transactivating lmo2 expression in the absence of ATRA (Fig. 7D). In fact, regulation of lmo2 transcription by Ets transcription factors and Ets-1 transactivation potentiation by CBP/p300 have been reported (18, 32). On the other hand, ATRA-dependent RAR/RXR may activate transcription of an unidentified KDM3B repressor and this repressor downregulates transcription of KDM3B (after ATRA treatment). We examined the epigenetic regulation of target gene transcription by KDM3B during ATRA-induced leukemia cell differentiation. Taken together, our results demonstrate the role of H3K9 demethylase KDM3B in the proliferation of leukemic cells through its epigenetic regulatory activity.
Supplementary Material
ACKNOWLEDGMENTS
We thank Berthold Gottgens (Cambridge University) for providing the pGL2-lmo2 (−661 to −330) reporter plasmid.
This study was supported by the National R&D Program for Cancer Control, Ministry of Health & Welfare (1020150), and by a grant from the National Research Foundation of Korea, Ministry of Education, Science and Technology (NRF-2011-355-C00058) and the Environmental Health Center for Childhood Cancer and Leukemia, Ministry of Environment, Republic of Korea.
Footnotes
Published ahead of print 21 May 2012
Supplemental material for this article may be found at http://mcb.asm.org/.
REFERENCES
- 1. Bilodeau S, Kagey MH, Frampton GM, Rahl PB, Young RA. 2009. SetDB1 contributes to repression of genes encoding developmental regulators and maintenance of ES cell state. Genes Dev. 23:2484–2489 [DOI] [PMC free article] [PubMed] [Google Scholar]
- 2. Blobel GA. 2002. CBP and p300: versatile coregulators with important roles in hematopoietic gene expression. J. Leukoc. Biol. 71:545–556 [PubMed] [Google Scholar]
- 3. Chatterjee D, et al. 1997. Monocytic differentiation of HL-60 promyelocytic leukemia cells correlates with the induction of Bcl-xL. Cell Growth Differ. 8:1083–1089 [PubMed] [Google Scholar]
- 4. Cho YW, et al. 2007. PTIP associates with MLL3- and MLL4-containing histone H3 lysine 4 methyltransferase complex. J. Biol. Chem. 282:20395–20406 [DOI] [PMC free article] [PubMed] [Google Scholar]
- 5. Cloos PA, et al. 2006. The putative oncogene GASC1 demethylates tri- and dimethylated lysine 9 on histone H3. Nature 442:307–311 [DOI] [PubMed] [Google Scholar]
- 6. Czvitkovich S, et al. 2001. Over-expression of the SUV39H1 histone methyltransferase induces altered proliferation and differentiation in transgenic mice. Mech. Dev. 107:141–153 [DOI] [PubMed] [Google Scholar]
- 7. Dawson MA, et al. 2009. JAK2 phosphorylates histone H3Y41 and excludes HP1α from chromatin. Nature 461:819–822 [DOI] [PMC free article] [PubMed] [Google Scholar]
- 8. Feldman N, et al. 2006. G9a-mediated irreversible epigenetic inactivation of Oct-3/4 during early embryogenesis. Nat. Cell Biol. 8:188–194 [DOI] [PubMed] [Google Scholar]
- 9. Golub TR, et al. 1999. Molecular classification of cancer: class discovery and class prediction by gene expression monitoring. Science 286:531–537 [DOI] [PubMed] [Google Scholar]
- 10. Hayami S, et al. 2010. Overexpression of the JmjC histone demethylase KDM5B in human carcinogenesis: involvement in the proliferation of cancer cells through the E2F/RB pathway. Mol. Cancer 9:59. [DOI] [PMC free article] [PubMed] [Google Scholar]
- 11. He J, Nguyen AT, Zhang Y. 2011. KDM2b/JHDM1b, an H3K36me2-specific demethylase, is required for initiation and maintenance of acute myeloid leukemia. Blood 117:3869–3880 [DOI] [PMC free article] [PubMed] [Google Scholar]
- 12. Hsia DA, et al. 2010. KDM8, a H3K36me2 histone demethylase that acts in the cyclin A1 coding region to regulate cancer cell proliferation. Proc. Natl. Acad. Sci. U. S. A. 107:9671–9676 [DOI] [PMC free article] [PubMed] [Google Scholar]
- 13. Hu X, et al. 2009. LSD1-mediated epigenetic modification is required for TAL1 function and hematopoiesis. Proc. Natl. Acad. Sci. U. S. A. 106:10141–10146 [DOI] [PMC free article] [PubMed] [Google Scholar]
- 14. Hu Z, et al. 2001. A novel nuclear protein, 5qNCA (LOC51780) is a candidate for the myeloid leukemia tumor suppressor gene on chromosome 5 band q31. Oncogene 20:6946–6954 [DOI] [PubMed] [Google Scholar]
- 15. Kim SM, et al. 2010. Regulation of mouse steroidogenesis by WHISTLE and JMJD1C through histone methylation balance. Nucleic Acids Res. 38:6389–6403 [DOI] [PMC free article] [PubMed] [Google Scholar]
- 16. Kouzarides T. 2007. Chromatin modifications and their function. Cell 128:693–705 [DOI] [PubMed] [Google Scholar]
- 17. Lachner M, O'Carroll D, Rea S, Mechtler K, Jenuwein T. 2001. Methylation of histone H3 lysine 9 creates a binding site for HP1 proteins. Nature 410:116–120 [DOI] [PubMed] [Google Scholar]
- 18. Landry JR, et al. 2005. Fli1, Elf1, and Ets1 regulate the proximal promoter of the LMO2 gene in endothelial cells. Blood 106:2680–2687 [DOI] [PubMed] [Google Scholar]
- 19. Lee MG, et al. 2007. Demethylation of H3K27 regulates polycomb recruitment and H2A ubiquitination. Science 318:447–450 [DOI] [PubMed] [Google Scholar]
- 20. Nam CH, et al. 2008. An antibody inhibitor of the LMO2-protein complex blocks its normal and tumorigenic functions. Oncogene 27:4962–4968 [DOI] [PubMed] [Google Scholar]
- 21. Okada Y, Scott G, Ray MK, Mishina Y, Zhang Y. 2007. Histone demethylase JHDM2A is critical for Tnp1 and Prm1 transcription and spermatogenesis. Nature 450:119–123 [DOI] [PubMed] [Google Scholar]
- 22. Rea S, et al. 2000. Regulation of chromatin structure by site-specific histone H3 methyltransferases. Nature 406:593–599 [DOI] [PubMed] [Google Scholar]
- 23. Rhodes DR, et al. 2004. ONCOMINE: a cancer microarray database and integrated data-mining platform. Neoplasia 6:1–6 [DOI] [PMC free article] [PubMed] [Google Scholar]
- 24. Saleque S, Kim J, Rooke HM, Orkin SH. 2007. Epigenetic regulation of hematopoietic differentiation by Gfi-1 and Gfi-1b is mediated by the cofactors CoREST and LSD1. Mol. Cell 27:562–572 [DOI] [PubMed] [Google Scholar]
- 25. Tachibana M, Nozaki M, Takeda N, Shinkai Y. 2007. Functional dynamics of H3K9 methylation during meiotic prophase progression. EMBO J. 26:3346–3359 [DOI] [PMC free article] [PubMed] [Google Scholar]
- 26. Tateishi K, Okada Y, Kallin EM, Zhang Y. 2009. Role of Jhdm2a in regulating metabolic gene expression and obesity resistance. Nature 458:757–761 [DOI] [PMC free article] [PubMed] [Google Scholar]
- 27. Villa R, et al. 2007. Role of the polycomb repressive complex 2 in acute promyelocytic leukemia. Cancer Cell 11:513–525 [DOI] [PubMed] [Google Scholar]
- 28. Visvader JE, Mao X, Fujiwara Y, Hahm K, Orkin SH. 1997. The LIM-domain binding protein Ldb1 and its partner LMO2 act as negative regulators of erythroid differentiation. Proc. Natl. Acad. Sci. U. S. A. 94:13707–13712 [DOI] [PMC free article] [PubMed] [Google Scholar]
- 29. Wang Z, et al. 2009. Genome-wide mapping of HATs and HDACs reveals distinct functions in active and inactive genes. Cell 138:1019–1031 [DOI] [PMC free article] [PubMed] [Google Scholar]
- 30. Warren AJ, et al. 1994. The oncogenic cysteine-rich LIM domain protein rbtn2 is essential for erythroid development. Cell 78:45–57 [DOI] [PubMed] [Google Scholar]
- 31. Yamane K, et al. 2006. JHDM2A, a JmjC-containing H3K9 demethylase, facilitates transcription activation by androgen receptor. Cell 125:483–495 [DOI] [PubMed] [Google Scholar]
- 32. Yang C, Shapiro LH, Rivera M, Kumar A, Brindle PK. 1998. A role for CREB binding protein and p300 transcriptional coactivators in Ets-1 transactivation functions. Mol. Cell. Biol. 18:2218–2229 [DOI] [PMC free article] [PubMed] [Google Scholar]
Associated Data
This section collects any data citations, data availability statements, or supplementary materials included in this article.


