

Abstract
The spread of opportunistic pathogens via public water systems is of growing concern. The purpose of this study was to identify patterns of occurrence among three opportunistic pathogens (Legionella pneumophila, Mycobacterium avium, and Pseudomonas aeruginosa) relative to biotic and abiotic factors in two representative chloraminated drinking water distribution systems using culture-independent methods. Generally, a high occurrence of Legionella (≥69.0%) and mycobacteria (100%), lower occurrence of L. pneumophila (≤20%) and M. avium (≤33.3%), and rare detection of Pseudomonas aeruginosa (≤13.3%) were observed in both systems according to quantitative PCR. Also, Hartmanella vermiformis was more prevalent than Acanthamoeba, both of which are known hosts for opportunistic pathogen amplification, the latter itself containing pathogenic members. Three-minute flushing served to distinguish distribution system water from plumbing in buildings (i.e., premise plumbing water) and resulted in reduced numbers of copies of Legionella, mycobacteria, H. vermiformis, and 16S rRNA genes (P < 0.05) while yielding distinct terminal restriction fragment polymorphism (T-RFLP) profiles of 16S rRNA genes. Within certain subgroups of samples, some positive correlations, including correlations of numbers of mycobacteria and total bacteria (16S rRNA genes), H. vermiformis and total bacteria, mycobacteria and H. vermiformis, and Legionella and H. vermiformis, were noted, emphasizing potential microbial ecological relationships. Overall, the results provide insight into factors that may aid in controlling opportunistic pathogen proliferation in real-world water systems.
INTRODUCTION
In recent years, opportunistic pathogens, including Legionella pneumophila, nontuberculosis mycobacteria (NTM), Pseudomonas aeruginosa, and Acanthamoeba spp. have become a leading source of waterborne disease in developed countries. A growing incidence of Legionnaires' diseases was reported in the United States from 2000 to 2009 (17) and France from 1998 to 2005 (15). In the United States, Legionella has been the single most commonly reported pathogen identified in drinking water-associated outbreaks since its addition to Waterborne Disease and Outbreak Surveillance System in 2001 (13). Multiple studies also linked NTM infection to drinking water systems by employing genetic and epidemiological methods to compare clones isolated from patients and drinking water (see, e.g., references 12, 23, 30, and 32), highlighting drinking water as a potential route of exposure for NTM infection. A study reviewing waterborne nosocomial infection from 1966 to 2001 suggested that outbreaks of nosocomial P. aeruginosa infection are commonly related to hospital tap water (4). Recent outbreaks of Acanthamoeba keratitis (AK) in the United States were also suspected to be associated with drinking water (16, 62). Further evidence linking AK to tap water demonstrated identical Acanthamoeba mitochondrial DNA (mtDNA) profiles for the clinical and home tap water isolates in 75% (6 of 8) of Acanthamoeba-positive (8 of 27) patients' homes in the United Kingdom (38). The incidences of waterborne NTM, P. aeruginosa, and Acanthamoeba infection and their association with drinking water are likely to be underestimated, since they are nonreportable diseases.
Water from plumbing in buildings (i.e., premise plumbing water) is an important reservoir for opportunistic pathogens and represents a direct route for transmission and exposure to humans, typically via inhalation of aerosols or skin contact. The unique characteristics of premise plumbing include a high surface-area-to-volume ratio, long retention times, the presence of reactive pipe materials (e.g., corrosion), and warm temperatures, all of which contribute to low disinfectant residual in household water and therefore promote bacterial colonization and multiplication (57). On the other hand, some waterborne opportunistic pathogens, such as M. avium complex, are slow-growing oligotrophs capable of resisting heat and disinfectants, which makes them strong competitors in the drinking water environment (31). The occurrence of Legionella and mycobacteria in premise plumbing and potential relationships of occurrence with environmental factors, such as water chemistry (6, 9, 33, 72), temperature (30, 34, 42, 52, 55), water heater capacity and type (48, 55), and premise plumbing characteristics (52), have been previously reported. Water heater temperature is considered to be the most critical determining factor for Legionella and NTM colonization in household plumbing (30, 34, 42, 52, 55). A positive relationship between mycobacterial abundance and assimilable organic carbon (AOC) concentration was observed by Falkinham et al. (33) and Torvinen et al. (72) in U.S. and Finnish drinking water distribution systems. The colonization of Legionella was also recently found to be associated with trace metals. Negative association of copper levels > 50 mg/liter and Legionella colonization and positive association of Zn and Mn and Legionlla colonization in hot water systems have been proposed in some studies (6, 9). In contrast, a Legionella survey of German residences suggested a positive effect of copper pipes with respect to Legionella colonization (52).
In general, the driving factors of opportunistic pathogen occurrence and regrowth in premise plumbing remain elusive due to the complexity of premise plumbing and limited knowledge of pathogen transmission and life cycles in engineered water systems. Few studies have considered the influence of microbial ecology, which is likely to be particularly critical in governing occurrence and regrowth of opportunistic pathogens in drinking water systems. For example, the ecological niche of Legionella and mycobacteria overlaps with those of amoebae and protozoa (1, 24) and infection of protozoan hosts can enhance reproduction and virulence in these and other pathogens (18, 19). Certain aquatic bacteria have also been reported to exert a negative influence on L. pneumophila (35). Therefore, advancing understanding of the microbial ecology of multiple representative opportunistic pathogens is critical to developing appropriate guidance and controls to broadly limit their proliferation. In particular, there is need for a simultaneous, comprehensive molecular examination of multiple opportunistic pathogens. Such a study is of value, considering that the factors that inhibit one pathogen may actually favor the growth of others. For example, in the drinking water distribution system in Pinellas County, FL (PCF), Moore and colleagues (54) previously reported that switching from chlorine to chloramines mitigated Legionella colonization but favored mycobacterial colonization. However, the full extent and implications of such phenomena are unknown.
This report provides a comprehensive molecular survey of the occurrence of L. pneumophila and other Legionella, M. avium and nontuberculosis mycobacteria, and P. aeruginosa, as well as of two known amoeba hosts (Acanthamoeba spp. and Hartmanella vermiformis) in two chloraminated drinking water systems in the United States. The first water system, PCF, has been subjected to prior characterization of L. pneumophila and M. avium, as noted above, and is representative of a warm climate. The second, the Blacksburg-Christiansburg-VPI Water Authority (BCV), located in Virginia, has not been previously characterized and is representative of a temperate climate. Chloramination is of particular interest given that there is a general movement, particularly in the United States, to switch away from chlorine to reduce the risk of disinfection byproduct formation. The present study primarily employed quantitative PCR (qPCR) as a culture-independent approach for pathogen enumeration, the advantages of which include a low detection limit, high specificity, and high throughput. Differing sampling techniques were implemented to estimate the relative influences of premise plumbing (first-draw samples) versus the main water distribution system (after 3 min of flushing) environments. To explore the potential relationships between factors such as water age, opportunistic pathogen numbers, and microbial ecology, the broader microbial community structure in the bulk water and biofilm samples was profiled using terminal restriction fragment length polymorphism (T-RFLP) targeting 16S rRNA genes.
MATERIALS AND METHODS
Site locations and sampling procedures.
BCV is located in southwest Virginia and serves a population of about 65,000, treating surface water by chlorination, flocculation, sedimentation, and dual-medium filtration. Chloramines have served as the disinfectant since June 2005, prior to which chlorine was used. Samples were collected from September 2010 to November 2010. The sampling plan was designed based on a water age model provided by the utility. Three to eight houses were selected for each of five water age ranges (3 to 6 days [n = 4], 6 to 8 days [n = 8], 8 to 10 days [n = 5], 10 to 12 days [n = 6], and ≥17 days [n = 3]; 3 had unknown water age). One-liter samples were collected before flushing the sampled tap (first draw), after flushing for 3 min (postflushing), and from the safety valve and bottom drain valve of corresponding water heaters, if available. The sampling procedure was performed in accordance with the U.S. Environmental Protection Agency (EPA) total coliform sampling guide, except a first-draw sample was included (28). Collected water samples were transported to the laboratory on ice within 2 h.
Legionella spp. and Mycobacterium spp. were historically reported to be prevalent in the PCF drinking water distribution system (54, 61), which serves over 640,000 people. Details of PCF were reported in a previous U.S. Centers for Disease Control (CDC) study (54), except that the source water has been adjusted to a blend of surface, ground, and desalinated water (at the time of the previous CDC study, the source water was 100% groundwater). Sampling took place in May 2011, targeting eight sites that were positive and seven sites that were negative for Legionella in the previous CDC study (54). Among the eight Legionella-positive sites, three were reported positive only when chlorine was used as the disinfectant and negative following the switch to chloramination. Four sites that were Legionella positive when chloramine was utilized were also previously Legionella positive when chlorine was used. The water sampling procedure was identical to that used for BCV, except that shower water samples were collected when available and biofilm samples were collected from taps and shower heads by swabbing the inner surfaces with sterile cotton. These additional samples facilitated comparison with a previous CDC study (54).
Water-quality analysis.
Temperature, pH, total residual ammonia, and total residual chlorine were measured at the time of collection. pH was monitored using a portable pH 110 series meter (Oakton Research, Vernon Hills, IL). Total ammonia was measured using a DR2700 spectrophotometer (Hach, Loveland, CO) according to standard method 4500-NH3 (2). Total residual chlorine was measured using a Hach chlorine pocket colorimeter according to Hach DPD colorimetric method 8167. NO3− was measured using a Dionex (Sunnyvale, CA) DX-120 ion chromatography apparatus according to standard method 4110 (2). Total organic carbon (TOC) was measured on a Sievers 800 portable TOC analyzer (GE, Boulder, CO) using standard method 5310A (2).
Water sample processing and DNA extraction.
One liter of water was filtered through 0.22-μm-pore-size mixed cellulose ester filters (Millipore, Billerica, MA), which were fragmented prior to extraction. DNA was extracted directly from cotton swabs for biofilm samples. DNA extraction was carried out using a FastDNA Spin kit (MP Biomedicals, Solon, OH) according to manufacturer protocol. For PCF samples, only half of the membrane was used for DNA extraction, and the other half was reserved for culturing.
qPCR.
Legionella spp., L. pneumophila, Mycobacterium spp., M. avium, Acanthamoeba spp., H. vermiformis, P. aeruginosa, and total bacteria were enumerated by qPCR using previously published methods (5, 41, 58, 63, 64, 68, 79). All reactions were performed using a Bio-Rad (Hercules, CA) CFX96 real-time system in a final volume of 10 μl. Detailed information about primers, probes, and qPCR programs is provided in Table S1 in the supplemental material. The specificity of all qPCR assays except that for total bacteria was confirmed by cloning and sequencing of qPCR products from selected positive samples collected in this study (see Tables S2 to S8 in the supplemental material). For TaqMan assays, each 10-μl reaction mixture contained 5 μl of 2× SsoFast Probes Supermix (Bio-Rad), 250 nM each primer, 93.75 nM probe, and 1 μl of DNA template. For EvaGreen assays, each 10-μl reaction mixture contained 5 μl of 2×SsoFast EvaGreen Supermix (Bio-Rad), 400 nM each primer, and 1 μl of DNA template. DNA extracts, negative DNA controls (template DNA replaced by sterile Nanopure water), and 10-fold serial dilutions of standard DNA were included in triplicate in each qPCR run. Based on a serial dilution analysis, a sample dilution of 1:5 was determined to be effective for elimination of qPCR inhibition. Melt curve analysis was implemented on EvaGreen qPCR assays in order to verify specificity by ramping the temperature from 65 to 95°C at a rate of 0.5°C/5 s. The limit of quantification (LOQ) for all qPCR assays ranged from 1 to 10 gene copies/reaction and was implemented as appropriate for each specific run. For samples with a gene copy concentration near the LOQ (0 to 5 gene copies/μl), only samples that yielded a detectable threshold cycle (CT) in all three triplicate experiments were considered to represent positive results. To determine the effective LOQ and recovery efficiency corresponding to upstream sample processing (i.e., membrane filtration and DNA extraction), L. pneumophila, Legionella spp., M. avium, Mycobacterium spp., P. aeruginosa, H. vermiformis, and Acanthamoeba spp. were spiked at defined concentrations in 500 ml of water and analyzed. Using this approach, LOQs were determined to be 32, 32, 170, 170, 114, 2.4, and 0.85 CFU or cells/ml, respectively. Linear models providing conversion between CFU and qPCR for targeted organisms as assayed in this study were established (see Fig. S1 and Table S9 in the supplemental material).
Legionella cultivation.
Legionella bacteria in PCF water samples were enumerated by colony count on buffered charcoal yeast extract (BCYE) agar (27) following a 30-min pretreatment at 50°C (49). Heat pretreatment instead of acid pretreatment was selected based on preliminary experiments demonstrating impairment of Legionella culturability by acid pretreatment. After 10 days of incubation at 37°C, the identity of Legionella-like colonies was verified by qPCR performed with both Legionella spp. and L. pneumophila (see Table S1 in the supplemental material).
T-RFLP.
16S rRNA genes were amplified on a Bio-Rad C1000 thermal cycler via nested PCR using fluorescently labeled primer 27f (5′-6-carboxyfluorescein [FAM]-AGAGTTTGATCMTGGCTCAG-3′) (66) and 907r (5′-CCGTCAATTCCTTTRAGTTT-3′) (39) with an annealing temperature of 50°C. The first round- and second-round amplification cycles were optimized to 15 and 30, respectively, in order to reach a balance between increasing T-RFLP profile resolution and minimizing PCR bias (59, 66). PCR products were purified using a GeneClean spin kit (MP Biomedicals, Solon, OH). Purified PCR products (10 μl) were digested with 20 U of HhaI (Promega, Madison, WI). Digested PCR products (1 μl) were mixed with 8.75 μl of formamide and 0.25 μl of GeneScan 500 LIZ size standard (Applied Biosystems [ABI], Foster, CA) and denatured at 95°C for 5 min followed by snap cooling in an ice bath prior to electrophoresis on an ABI 3130 genetic analyzer. T-RFs of between 50 to 500 bp with peak heights of ≥50 fluorescence units were identified using GeneMapper V 4.0 (ABI).
Statistical analysis.
The Shapiro-Wilk test was used to test the normality of data sets. The Student t test was used to compare means of physiochemical parameter values. Since the log-transformed gene copy numbers were not normally distributed, the nonparametric Wilcoxon rank sum test was used to compare numbers of gene copies of targeted organisms. An equal- or given-proportion test was used to compare the detection rates. Analyses of correlations between different targeted organisms and physiochemical parameters were conducted using Spearman rank correlation analysis. The differences in Shannon diversity index values between samples with different water ages were compared using one-way analysis of variance (ANOVA) followed by pairwise comparison (pairwise t test). The differences in chloramine concentrations for samples with different water ages were compared using the nonparametric Kruskal-Wallis rank sum test followed by a multiple comparison test (kruskalmc). All of statistical tests named above were implemented by R (http://www.r-project.org/). Primer-E (Plymouth, United Kingdom) was employed to retrieve univariate indices (i.e., evenness, richness, and Shannon diversity index) and perform multivariate statistical analysis of T-RFLP profiles. The similarity of T-RF profiles, including accounting for T-RF peak heights, was examined using Bray-Curtis analysis (20), which generated bacterial community resemblance matrices for cluster analysis, multidimensional scaling (MDS), and analysis of similarity (ANOSIM). Global R values, generated by ANOSIM, fall between 0 and 1, indicating the degree of discrimination of sample groups. R = 1 indicates that all samples within the group are more similar to each other than to any sample from other groups. An R value of 0 indicates that the similarity between the groups and the similarity within the groups are the same on average (22). Analysis of >999 random permutations tested the null hypothesis that the bacterial community structures were similar. Biota and/or environmental matching (BEST) analysis was used to conduct correlation analyses of environmental parameters and microbial community data (21). Significance was set at a P value of ≤0.05.
RESULTS
Water quality characteristics.
The water quality characteristics of the two distribution systems are presented in Table 1. The average temperature of the BCV water samples collected after flushing was approximately 7°C lower than that of the PCF samples (P < 0.001). Except for pH (P = 0.002), no other significant differences in water quality constituents were found between the two systems in postflushing water. However, a higher variance of the total chlorine concentration was noted in the PCF distribution system.
Table 1.
Physicochemical properties of water in distribution systems BCV and PCFa
| Water distribution system and source | Temp (°C ± SD) | pH ± SD | NH4+ (mg/liter ± SD) | NO3− (mg/liter ± SD) | Total Cl2 (mg/liter ± SD) | TOC (mg/liter ± SD) |
|---|---|---|---|---|---|---|
| BCV | ||||||
| First draw | 20.8 ± 2.8 | 7.85 ± 0.24 | 0.58 ± 0.15 | 0.35 ± 0.05 | 2.02 ± 0.63 | 2.56 ± 1.18 |
| Postflushing | 19.7 ± 2.4* | 7.85 ± 0.23* | 0.63 ± 0.14 | 0.34 ± 0.05 | 2.21 ± 0.63 | 2.36 ± 2.96 |
| Water heater | 37.3 ± 8.4 | 8.02 ± 0.32 | 0.64 ± 0.10 | 0.37 ± 0.05 | 1.81 ± 0.62 | 2.87 ± 3.00 |
| PCF | ||||||
| Postflushing | 26.8 ± 0.9* | 7.63 ± 0.21* | 0.45 ± 0.36 | 0.25 ± 0.21 | 2.15 ± 1.13 | 3.51 ± 2.68 |
| Water heater | 43.2 ± 6.0 | 7.66 ± 0.24 | 0.47 ± 0.33 | 0.24 ± 0.22 | 1.27 ± 0.93 | 5.84 ± 2.51 |
The first draw data from PCF was not available. *, significant difference with 95% confidence (P < 0.05) in postflushing sample results between BCV and PCF.
Occurrence of Legionella, mycobacteria, P. aeruginosa, and two species of amoeba.
The frequencies of detection (FOD) and densities of Legionella, mycobacteria, P. aeruginosa, and two species of amoeba for the two water systems are presented in Tables 2 and 3. The highest FOD in BCV was seen with Mycobacterium spp. (94% of samples), followed by Legionella spp. (30% of samples). L. pneumophila was detected in 4 out of 27 (15%) Legionella-positive samples. M. avium was detected in 8 of 85 (9%) mycobacterium-positive samples. The average proportions of L. pneumophila and M. avium were approximately 15% and <0.1% of the total Legionella spp. and Mycobacterium spp., respectively, as determined on the basis of the assumption that all Legionella species, including L. pneumophila, carry 3 genome copies of 23S rRNA gene and that all mycobacteria, including M. avium, carry 1 genome copy of 16S rRNA gene (http://rrndb.mmg.msu.edu/search.php). The FOD of H. vermiformis was noted to be twice that of Acanthamoeba spp., with a significantly higher average density (P < 0.001). Only one sample was positive for P. aeruginosa, a water heater sample with a very low number of gene copies of 1.8 ± 0.3/ml.
Table 2.
Opportunistic-pathogen survey of drinking water distribution system BCV
| Target organism | Occurrence rate (%) |
Concn (no. of gene copies/ml ± SD) |
||
|---|---|---|---|---|
| Sites (n = 29) | Samples (n = 90) | Highest | Avg for positive samples | |
| Legionella spp. | 69.0 | 30.0 | 2.3 × 10³ ± 9.7 × 10² | 186.6 ± 458.2 |
| L. pneumophila | 13.7 | 4.4 | 13.7 ± 5.1 | 9.8 ± 4.4 |
| Mycobacterium spp. | 100 | 94.4 | 1.8 × 10⁵ ± 9.6 × 10⁴ | 1.4 × 10⁴ ± 3.7 × 10⁴ |
| M. avium | 24.1 | 8.9 | 1.9 ± 0.3 | 1.1 ± 0.6 |
| H. vermiformis | 27.6 | 14.4 | 7.1 × 10⁴ ± 4.4 × 10³ | 1.2 × 10⁴ ± 2.0 × 10⁴ |
| Acanthamoeba spp. | 13.7 | 6.7 | 6.8 ± 2.9 | 2.2 ± 2.4 |
| P. aeruginosa | 3.4 | 1.1 | 1.8 ± 0.3 | 1.8 |
Table 3.
Opportunistic-pathogen survey of drinking water distribution system PCF
| Target organism | Occurrence rate (%) |
Concn (± SD) |
||||||
|---|---|---|---|---|---|---|---|---|
| Highest |
Avg for positive samples |
|||||||
| Sites (n = 15) | Samples (n = 80) | Water (n = 54) | Biofilm (n = 26) | Water (no. of gene copies/ml) | Biofilm (no. of gene copies/swab) | Water (no. of gene copies/ml) | Biofilm (no. of gene copies/swab) | |
| Legionella spp. | 100 | 67.5 | 83.3 | 34.6 | 759.6 ± 285.7 | 1.5 × 10⁶ ± 1.8 × 10⁵ | 100.8 ± 184.2 | 2.2 × 10⁵ ± 4.7 × 10⁵ |
| L. pneumophila | 20 | 5.0 | 5.6 | 3.8 | 219.4 ± 23.8 | 1.9 × 10⁴ ± 1.1 × 10⁴ | 90.4 ± 111.9 | 1.9 × 10⁴ |
| Mycobacterium spp. | 100 | 93.7 | 98.1 | 84.6 | 2.1 × 10⁴ ± 4.2 × 10³ | 2.9 × 10⁷ ± 8.1 × 10⁵ | 1.4 × 10³ ± 3.5 × 10³ | 3.8 × 10⁶ ± 8.1 × 10⁶ |
| M. avium | 33.3 | 10 | 11.1 | 7.7 | 850.1 ± 458.7 | 4.3 × 10⁵ ± 3.9 × 10⁴ | 38.4 ± 166.1 | 9.1 × 10⁴ ± 1.9 × 10⁵ |
| H. vermiformis | 73.3 | 28.7 | 29.6 | 26.9 | 5.1 × 10³ ± 2.2 × 10² | 4.6 × 10⁶ ± 2.3 × 10⁵ | 781.7 ± 1,408.0 | 1.8 × 10⁶ ± 1.9 × 10⁶ |
| Acanthamoeba spp. | 6.7 | 1.25 | 0 | 3.8 | N/Aa | 3.0 × 10⁴ ± 5.2 × 10⁴ | N/A | 3.0 × 10⁴ |
| P. aeruginosa | 13.3 | 5.0 | 5.6 | 3.8 | 700.3 ± 158.7 | 5.3 × 10⁴ ± 5.5 × 10³ | 340.6 ± 363.0 | 5.3 × 10⁴ |
N/A, not available.
In the PCF distribution system (Table 3), all 15 sites yielded positive detection results for Legionella spp. and Mycobacterium spp. The FOD of L. pneumophila and the FOD of M. avium were 20% and 33% of sites sampled, respectively. Acanthamoeba spp. were not detected in any water sample and were detected in only one biofilm sample. As observed in BCV samples, H. vermiformis was more prevalent than Acanthamoeba (P < 0.001). P. aeruginosa was detected at 2 of 15 sites in 1 biofilm and 3 water samples. Generally, no preference of biofilm versus bulk water was observed for any of the bacterial groups monitored (P = 0.11).
Detection of Legionella by cultivation.
Colonies of Legionella spp., as confirmed by qPCR, were recovered from only 1 of 56 water samples (2%), at a density of 2 CFU/ml, in PCF.
Effect of 3-min flushing.
Figure 1 compares the average gene copy numbers of Legionella spp., Mycobacterium spp., H. vermiformis, and total bacteria measured in first-draw and postflushing samples from BCV. The average densities of the targeted genes postflushing were 6- to 45-fold lower than those seen with the corresponding first-draw samples. These differences were significant for Legionella spp. (P = 0.002), Mycobacterium spp. (P < 0.001), H. vermiformis (P = 0.018), and total bacteria (P < 0.001). However, a significant effect of flushing was observed only for total bacterial 16S rRNA genes in PCF (P = 0.032), where it was not possible to impose an 8-h stagnation period prior to sampling. It was also noted that none of the postflushing samples were positive for L. pneumophila or M. avium in BCV. In PCF, the only site positive for M. avium in the first-draw sample was no longer positive after flushing; about a 10-fold reduction was observed for the only positive sample for P. aeruginosa.
Fig 1.
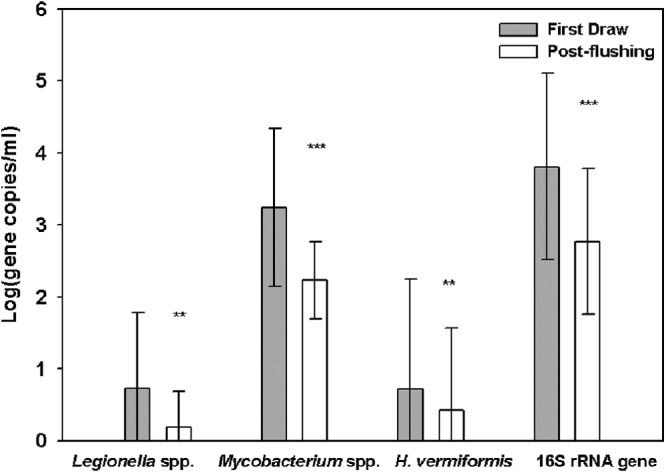
Average copy numbers of Legionella spp., Mycobacterium spp., H. vermiformis, and the 16S rRNA gene in first-draw and postflushing samples. Error bars represent the standard deviations of 29 log-transformed qPCR measurements [log(x + 1)] of target organisms in all first-draw and postflushing samples collected from BCV. ** and ***, significant differences according to paired Wilcoxon rank sum testing at the P < 0.01 and P < 0.001 levels, respectively.
Associations with biotic factors.
Moderate to strong correlation between numbers of Mycobacterium spp. and total bacterial 16S rRNA gene copies were observed in BCV water samples (ρ = 0.6216 to 0.7729, P < 0.001) (Table 4); however, at PCF this same correlation was observed only in biofilm samples (ρ = 0.7308, P < 0.001). Low to moderate correlations between numbers of H. vermiformis and total bacterial 16S rRNA genes were displayed in water heater samples and biofilm samples in both distribution systems (ρ = 0.3863 to 0.6911, P < 0.05). Low to moderate positive correlations were found between Legionella spp. and H. vermiformis (ρ = 0.3550 to 0.5907, P < 0.05) in BCV but not PCF. Mycobacterium spp. also displayed weak to moderate correlations (ρ = 0.3697 to 0.5560, P < 0.05) with H. vermiformis in some sample types at both BCV and PCF. The only observed correlations for Legionella spp. were weak to moderate correlations with total numbers of bacterial 16S rRNA genes (ρ = 0.4593, P = 0.008) and Mycobacterium spp. (ρ = 0.3786, P = 0.032) in BCV water heater samples (Table 4).
Table 4.
Correlation analysis of relationship between different potential opportunistic pathogens in BCV and PCFa
| Water distribution system and source | Spearman's rank correlation (P) |
|||||
|---|---|---|---|---|---|---|
| Legionella spp. vs 16S rRNA gene | Mycobacterium spp. vs 16S rRNA gene | H. vermiformisvs 16S rRNA gene | Legionella spp. vs Mycobacterium spp. | Legionella spp. vs H. vermiformis | Mycobacterium spp. vs H. vermiformis | |
| BCV | ||||||
| First draw | 0.3243 (0.086) | 0.7729 (<0.001) | 0.2650 (0.165) | 0.3619 (0.054) | 0.5907 (<0.001) | 0.4020 (0.031) |
| After flushing | 0.0756 (0.699) | 0.6216 (<0.001) | 0.3089 (0.103) | 0.2932 (0.123) | 0.4356 (0.018) | 0.3697 (0.048) |
| Water heater | 0.4593 (0.008) | 0.7401 (<0.001) | 0.3863 (0.029) | 0.3786 (0.033) | 0.3550 (0.046) | 0.2283 (0.209) |
| PCF | ||||||
| First draw | 0.4372 (0.103) | 0.5107 (0.054) | 0.4633 (0.082) | 0.0860 (0.760) | 0.4124 (0.127) | 0.5560 (0.031) |
| After flushing | 0.2901 (0.294) | −0.0036 (0.995) | −0.2017 (0.471) | 0.0090 (0.975) | 0.3839 (0.158) | 0.0733 (0.795) |
| Water heater | 0.4231 (0.152) | 0.5494 (0.055) | 0.6911 (0.009) | 0.5549 (0.052) | 0.3195 (0.287) | 0.4644 (0.110) |
| Biofilm | 0.2516 (0.215) | 0.7308 (<0.001) | 0.5107 (<0.001) | 0.1972 (0.334) | 0.3541 (0.076) | 0.4853 (0.012) |
Correlation results were presented in the form of Spearman's rank correlation (ρ). P values were indicated in parentheses. Bold values indicate significant difference with 95% confidence (P < 0.05).
Associations with abiotic factors.
Moderate negative correlations were noted between gene copy numbers of Mycobacterium spp. and total chloramines (ρ = −0.52, P = 0.004) and between total bacterial 16S rRNA gene copy numbers and total chloramines (ρ = −0.49, P = 0.007) for the first-draw BCV samples. For PCF samples, no correlations of either of these groups with total chloramines were found. In BCV first-draw samples, numbers of Mycobacterium spp., H. vermiformis, and total bacterial 16S rRNA gene copies displayed low to moderate correlations with TOC (ρ = 0.4, P < 0.05). However, in PCF, only Legionella spp. were found to correlate with TOC and only in water heater samples (ρ = 0.73, P = 0.01). No correlations with temperature were found for either system.
Characteristics of the broader bacterial community.
The broader bacterial communities of all samples were profiled by T-RFLP. Postflushing samples from BCV and PCF were pooled for ANOSIM, which demonstrated that the bacterial community compositions were significantly different between the BCV and PCF systems (global R = 0.298, P = 0.001) (Table 5). Three-dimensional (3D) multidimensional scaling (MDS) plots illustrated the separation of samples by location (Fig. 2). No significant clustering was observed among samples pooled into the categories of first draw, postflushing, and water heater (global R = 0.009, P = 0.297). Of the 26 biofilm samples collected from PCF taps and showerheads, no significant differences from corresponding water samples in the T-RFLP patterns were observed (P = 0.636).
Table 5.
ANOSIM analysis of microbial community structures in different sample groupsa
| Factor | Water sample or system or pairwise test comparison | Global R value | P value |
|---|---|---|---|
| Site | BCV, PCF (postflushing samples) | 0.298 | 0.001 |
| Water age (days) | 3 to 6, 6 to 8, 8 to 10, 10 to 12, ≥17 | 0.097 | 0.003 |
| 3 to 6, 6 to 8 | 0.147 | 0.041 | |
| 6 to 8, 8 to 10 | 0.095 | 0.028 | |
| 8 to 10, 10 to 12 | 0.118 | 0.01 | |
| 10 to 12, ≥17 | 0.078 | 0.148 | |
| 3 to 6, 8 to10 | 0.103 | 0.054 | |
| 3 to 6, 10 to 12 | 0.222 | 0.002 | |
| 6 to 8, 10 to 12 | 0.06 | 0.09 | |
| 3 to 6, ≥17 | 0.12 | 0.057 | |
| 6 to 8, ≥17 | 0.069 | 0.205 | |
| 8 to 10, ≥ 17 | −0.031 | 0.603 | |
| Sample type | Water sample, biofilm sample | −0.016 | 0.636 |
| First draw sample, flushing sample, water heater sample | 0.009 | 0.297 |
Paired date ranges represent pairwise tests. Bold values indicate significant difference with 95% confidence (P < 0.05).
Fig 2.
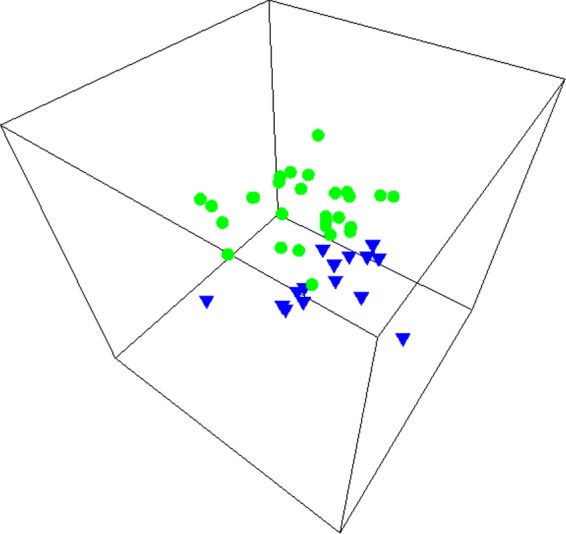
Multidimensional scaling analysis of bacterial community composition (T-RFLP profiles) for postflushing samples from BCV and PCF. Green round symbols represent samples from BCV. Blue inverted triangle symbols represent samples from PCF. Note: one sample from BCV was excluded from analysis due to an absence of T-RFLP peaks.
The average values of the Shannon diversity index increased from 1.0 ± 0.8 at a water age of approximately 3 to 6 days to 2.1 ± 0.3 at a water age of >17 days. Significantly lower values of the Shannon diversity index were observed in samples with water ages of approximately 3 to 6 days and approximately 6 to 8 days compared to >17 days (P < 0.05). ANOSIM indicated a weak water age effect on bacterial community structure (global R = 0.097, P = 0.003) (Table 5). Further, pairwise tests revealed weak separation between samples with water ages of approximately 3 to 6 days and approximately 6 to 8 days, approximately 6 to 8 days and approximately 8 to 10 days, approximately 8 to 10 days and approximately 10 to 12 days, and approximately 3 to 6 days and approximately 10 to 12 days (R = 0.091 to 0.222, P < 0.05), which was also confirmed by MDS (see Fig. S2 in the supplemental material). BEST analysis was applied to determine the correspondence of bacterial community profiles to the environmental parameters reported in Table 1; however, no relationships were identified.
The wide variability observed in MDS plots (Fig. 3) indicates that the microbial community compositions of the main distribution systems differed dramatically from location to location. For all sampled BCV and PCF sites, the differences in bacterial community composition between first-draw and postflushing samples ranged from 16% to 100%. More than half (55%) of the sampled sites demonstrated a greater than 50% change after flushing (Fig. 3).
Fig 3.

Multidimensional scaling analysis of bacterial community composition (T-RFLP profiles) for first-draw and postflushing samples from PCF. (A) Each symbol pair represents paired first-draw and postflushing samples from the same location (n = 15). The green circles represent a similarity level of 50% as determined by cluster analysis. (B) Green symbols represent first-draw samples and blue symbols postflushing samples.
DISCUSSION
Water quality characteristics.
The relatively lower average temperature in BCV postflushing samples was as expected, considering the difference in seasons and latitudes (10°) and may account for some of the differences observed between the two systems. Water heater temperatures in both systems were also lower on average than the recommended range for pathogen control (49 to 60°C) (50). Temperature stratification has recently been noted to be a widespread phenomenon in water heaters, typically resulting in colder temperatures at the bottom of the water heater (11), highlighting a key issue of concern for better protecting public health.
Occurrence of Legionella, mycobacteria, P. aeruginosa, and two species of amoebas.
It is interesting that the two distribution systems shared similar patterns of targeted organism occurrence, despite their geographic separation. Both systems were characterized by high FODs of Legionella spp. and Mycobacterium spp., low FODs of L. pneumophila and M. avium, and rare detection of P. aeruginosa. It is not clear whether the season contributes to the pattern similarity, since sampling at both locations occurred during warm seasons (spring and fall). A seasonal effect on Legionella diversity or distribution has been found in one location of a French pristine river (60) and in cooling towers (74). It is possible that seasonal factors could have been at play in the present study by influencing the bacterial growth environment (e.g., temperature, humidity, and water chemistry) and operation of premise plumbing (e.g., water heater usage).
In addition to L. pneumophila, several members of Legionella such as L. longbeachae, L. micdadei, L. bozemanii, and L. dumooffii are documented human pathogens (56). High diversities of Legionella, including pathogenic species, have been observed in drinking water treatment plants and treated drinking water in the Netherlands (80, 81). In these studies, L. pneumophila accounted for only 0.1% to 1% of the total Legionella spp.; instead, L. bozemannii predominated in the clone library, which is in agreement with the finding of the present work. However, L. pneumophila has been observed to be the most frequently isolated species in several other premise plumbing field surveys (6, 10, 45, 52). For example, L. pneumophila accounted for 93% of Legionella-positive samples in a culture-based survey of hot water systems in Italy (6). The physiologic and genetic basis for the survival and persistence of Legionella species in drinking water systems remains elusive. Many factors such as water source, water treatment processes and conveyance, and the characteristics of the premise plumbing likely play a role in permitting certain Legionella species to persist.
Similarly, a high diversity of mycobacteria, some of which, such as M. avium, M. intracellulare, M. kansasii, M. abscessus, and M. chelonae (33, 47, 65, 73, 77), are known to be opportunistic pathogens, has been demonstrated to be characteristic of the drinking water environment; among those species, M. avium is currently on the U.S. EPA candidate contaminant list. In the present study, a considerable number of mycobacteria were detected, accounting for 0.1% to 68% of total bacterial estimate, assuming that each bacterium has a single copy of the 16S rRNA gene. Mycobacterium spp. in postflushing samples ranged from 15 to 3.0 × 10³ gene copies/ml (average = 495 gene copies/ml), which is comparable to qPCR estimation of levels of Mycobacterium spp. in hospital tap water (1.0 × 10³ to 2.0 × 10⁷ CFU/500 ml) (36) but higher than reported levels of Mycobacterium spp. in drinking water systems (e.g., 10 × 105 to 7 × 10⁵ CFU/liter [33], 15 to 140 CFU/liter [72], and 1 to 1,000 CFU/500 ml [77]) determined by culturing methods according to the assumption that each mycobacterium has one genome copy of the 16S rRNA gene. Note that all qPCR assays applied in this study yielded slightly higher estimates than CFU counts (slope of 1.2 to 1.6), except the Mycobacterium and M. avium qPCR assays, which yielded lower estimates (slope of 0.8 to 0.9) (see Fig. S1 and Table S9 in the supplemental material). This is likely due to the greater losses of mycobacteria during upstream processing, such as filtration and DNA extraction, accounted for in the qPCR estimate. Mycobacteria are notorious for such analytical challenges imposed by the unique hydrophobic and impermeable nature of their cell envelope (3). Nonetheless, the results reported here support the conclusion of the previous CDC study that switching to chloramines favors the growth of Mycobacterium spp. (54). The prevalence of Mycobacterium spp. is likely to further increase the incidence of disease, particularly through aerosol inhalation by susceptible individuals. Identical DNA fingerprints found for samples from patients with mycobacterial pulmonary disease and household plumbing isolates has indicated that Mycobacterium species inhabiting premise plumbing are a probable source of pulmonary infection (30, 32).
A recent literature review examining drinking water systems across 14 different countries provides evidence of ubiquitous free-living amoebas in treated drinking water, especially in reservoirs and in premise-plumbing tanks. In particular, Acanthamoeba and Hartmanella were the most frequently identified genera in tap water (70). In the present study, the FOD and abundance of Acanthamoeba spp. were significantly lower than those of H. vermiformis. It has been suggested that Hartmannella spp. are more ecologically relevant than Acanthamoeba spp. in premise plumbing. Thomas and colleagues (71) reported that the dominance of Acanthamoeba spp. over Hartmanella spp. was reversed in a drinking water treatment plant after sand filtration. In a biofilm batch test examining protozoan hosts for L. pneumophila under a range of controlled water conditions, indigenous H. vermiformis grew whereas Acanthamoeba spp. did not (75).
Detection of Legionella by cultivation.
Legionella are of particular interest due to the severe pneumonia that they can cause and the relatively high number of reported outbreaks associated with drinking water systems (17). To provide some comparison to the previous CDC study (54), PCF water samples were cultured for recovery of Legionella spp. It is of interest that the only culture-positive sample was collected from a water heater where L. pneumophila water had been detected during both the chlorine and chloramine disinfection phases of a previous CDC study (54). Consistent with these observations, the culture-positive sample also yielded the highest gene copy numbers of Legionella spp. and L. pneumophila according to qPCR. However, the qPCR estimate (220 cells/ml based on one gene copy per cell [40]) was about 100-fold higher than the culture-based estimate. A similar difference in magnitude between qPCR and culturing of L. pneumophila was reported for cooling towers (44).
One possible explanation for the lower estimates of frequency and density of culture-positive Legionella samples is a higher detection limit of the cultivation method used here compared to the CDC method (54). A recent pilot study for the Environmental Legionella Isolation Techniques Evaluation (ELITE) program demonstrated that interlaboratory differences in Legionella culture enumeration were as high as 1,660-fold (51). Importantly, the optimal method for isolation from environmental samples appears to be sample specific and Legionella concentration dependent (7, 25, 49) and can vary greatly as a result of sample shipping and processing (53). qPCR is also generally subject to a higher estimate of Legionella because of detection of DNA from dead cells (67, 82) but also because it can detect cells in a viable but nonculturable (VBNC) state, which has been widely reported in other drinking water studies (26, 80, 81). Another possible explanation for the low recovery of Legionella isolates could have been the reported fall in numbers of Legionella spp. following the switch to chloramine disinfection (54). Finally, additional sample pretreatment steps required for culturing could diminish recovery relative to qPCR.
Effect of 3-min flushing.
Postflushing samples are representative of the water distribution system, whereas first-draw samples are indicative of the premise plumbing. The reduction of numbers of Legionella spp., Mycobacterium spp., and H. vermiformis and of 16S rRNA gene densities in postflushing samples suggests that even when the distribution system itself is highly chloraminated, conditions in premise plumbing may still permit the persistence and growth of bacteria and protozoa harbored in the biofilm. Greater differences were observed between first-draw samples and postflushing samples in BCV relative to PCF, which was likely due to longer water stagnation time for BCV. Residents in BCV were advised to abstain from water use for 8 h prior to the sampling. However, it was impractical to impose the same restriction in PCF due to the limits of sampling time and building complexity.
The impact of flushing on numbers of bacteria and amoebas is consistent with findings of a study investigating the influence of overnight stagnation on bacterial densities assayed by flow cytometry, adenosine triphosphate (ATP) concentration, and heterotrophic plate counts (HPC) (43). Samples taken after overnight stagnation (first draw) yielded 2-to-3-fold, 2-to-18-fold, and 4-to-580-fold-higher cell numbers, ATP concentrations, and HPC, respectively. The differences in water quality between the premise plumbing and main distribution system reinforce prior research indicating that routine monitoring as employed by water utilities does not reflect conditions (e.g., stagnant periods) encountered in premise plumbing (57). The differences also demonstrated regrowth of bacteria and protozoa in premise plumbing, indicating that qPCR is capable of capturing information about live cells in the system.
Associations with biotic and abiotic factors.
The positive correlation between H. vermiformis and total bacterial numbers is likely a direct reflection of H. vermiformis grazing on bacteria for food (78). However, this relationship was observed only in water heaters and was not strong (ρ < 0.7), indicating that other environmental factors may account for H. vermiformis growth. Furthermore, H. vermiformis and other amoebas can serve as hosts for amoeba-resisting bacteria like Legionella spp. and Mycobacterium spp. (8, 14). Observed correlations between Legionella spp. and H. verimformis in BCV were possibly a reflection of pathogen-host effect. However, the absence of strong correlations between pathogens and hosts in either BCV or PCF suggests the importance of the broader microbial ecology of drinking water systems, representing complex interactions involving both abiotic and biotic factors. For example, cell-to-cell interaction between microbes can either stimulate or inhibit the growth of opportunistic pathogens in drinking water. Specifically, one isolate of B. subtilis was able to reduce L. pneumophila numbers in either the absence or presence of amoebae by lysing Legionella cells or inhibiting internal replication in amoebae, respectively (69). Among members of one collection of aquatic bacteria, 66% inhibited L. pneumophila growth (35).
Limiting TOC has been proposed as a potential control measure for limiting pathogen regrowth in drinking water distribution systems. Previous studies linked heterotrophic plate counts (HPC) and mycobacterial abundance to AOC (29, 33, 72, 76). This study also identified a correlation of 16S rRNA genes, Mycobacterium spp., and H. vermiformis with TOC in BCV first-draw samples. However, low ρ values indicated that TOC is not the only factor contributing to their growth. Furthermore, the fact that the correlation existed only in first-draw samples and that 16S rRNA genes also correlated suggests that the true correlation may have been with biofilm constituents, which are detectable by TOC but do not represent actual TOC from the distribution system. The strong correlation between Legionella spp. and TOC in PCF water heater samples and the absence of such a relationship in other samples implies that TOC may be a factor favoring growth of Legionella spp. under certain conditions. Further laboratory control experiments are needed in order to better delineate potential relationships with TOC.
While temperature is known to be a critical factor for controlling opportunistic pathogen occurrence (30, 34, 42, 52, 55), no correlation between Legionella or mycobacteria and temperature was observed in this study. This was not unexpected, because temperature typically elicits a threshold response at extremes and the temperatures captured in this study were not necessarily representative of the narrow range corresponding to a linear growth rate response.
Characteristics of the broader bacterial community.
ANOSIM demonstrated that the bacterial community compositions were significantly different between the BCV and PCF systems, which could be explained by the geographic separation and water source difference as well as the different physical characteristics of these two systems. In BCV, all of the transmission lines are cement-lined ductile iron pipe. In contrast, PCF pipes are mainly made of copper (70% to 75%) and PVC (25% to 30%). Several studies have previously demonstrated a significant influence of pipe materials on microbial community structure in simulated drinking water systems (37, 46, 83).
The low Shannon diversity index in samples with a water age of 3 to 6 days might be attributable to relatively higher concentrations of chloramine (average = 2.6 ± 0.2 mg/liter, P < 0.05). ANOSIM demonstrated that water age has a weak effect on the bacterial community structure (Table 5). Even within the same water age group, the similarity of the bacterial community profiles among the samples was as low as 0, indicating that water age is not the sole driving factor. Further, BEST analysis failed to identify any relationship between the microbial communities and environmental parameters measured in Table 1. It is likely that other characteristics of the main distribution systems and premise plumbing not investigated in the present study, such as pipe age and materials, are also significant drivers of the broader microbial community composition.
The 3-min flush caused visible microbial community change in postflushing water samples in this study. Likewise, a considerable change was noted in bacterial community composition by denaturing gradient gel electrophoresis after a 5-min flush in household water (43). Slight increases in evenness and richness indices were also noted in the present study after flushing. The visible microbial community changes between first-draw and postflushing samples further call into question the validity of routine monitoring methods, which may overlook important microbes that reside in premise plumbing (57) and that are the source of direct human exposure.
Conclusions.
This report provides a comprehensive and quantitative snapshot of the prevalence of L. pneumophila and other Legionella, M. avium and other mycobacteria, P. aeruginosa, and two amoeba hosts in two representative chloraminated drinking water distribution systems. The results confirmed that drinking water systems, especially premise plumbing, are a reservoir for microorganisms and pathogens even in the presence of high chloramine residuals. Overall, this study demonstrated the value of qPCR for simultaneously monitoring genetic markers of multiple opportunistic pathogens and their protozoan hosts. These microorganisms are unique in comparison to traditional pathogens of concern (i.e., those leaving the drinking water treatment plant, typically of fecal origin) because they readily inhabit drinking water distribution systems and in-home plumbing. Thus, although qPCR does not provide a direct measure of viable organisms, it does provide a measure of organisms that were presumably viable at one point in time in the distribution system. Regrowth of organisms in first-draw samples representative of premise plumbing illustrates this principle and also highlights the fact that general water distribution system monitoring approaches likely overlook regrowth of opportunistic pathogens in premise plumbing, which is the front line of exposure to consumers. Nonetheless, future effort is merited to translate gene copy numbers into meaningful risk criteria, which currently are based on culture measurements. The relationships identified among targeted bacteria and amoebas, as well as associations between their numbers and abiotic environmental factors identified in the study, shed light on the importance of understanding drinking water pathogen ecology in order to better discern the mechanisms of opportunistic pathogen persistence in drinking water. Further, investigations of the influence of disinfectant type, pipe materials, and water age, in conjunction with microbial ecology, on opportunistic pathogen occurrence and persistence under controlled laboratory conditions would be beneficial in order to identify the most critical factors that could be modified to limit opportunistic pathogen proliferation in drinking water systems.
Supplementary Material
ACKNOWLEDGMENTS
This study was funded by the U.S. National Science Foundation (NSF) (CBET award 1033498) and a Virginia Tech Institute for Critical Technology and Applied Science (ICTAS) Center for Excellence award (PI, A. Dietrich).
We thank Marsha Pryor of Pinellas County, Florida, and Jerry Higgins of the Blacksburg-Christiansburg-VPI Water Authority for coordinating access and assisting with sampling, as well as Yanjuan Hong, Krista Williams, Randi Brazeau, and Amanda Martin for sample collection and laboratory assistance.
The findings do not represent the views of NSF or the participating utilities.
Footnotes
Published ahead of print 29 June 2012
Supplemental material for this article may be found at http://aem.asm.org/.
REFERENCES
- 1. Adékambi T, Ben Salah S, Khlif M, Raoult D, Drancourt M. 2006. Survival of environmental mycobacteria in Acanthamoeba polyphaga. Appl. Environ. Microbiol. 72: 5974–5981 [DOI] [PMC free article] [PubMed] [Google Scholar]
- 2. American Public Health Association (APHA) 1998. Standard methods for the examination of water and wastewater, 20th ed. American Water Works Association and Water Environment Federation, Washington, DC [Google Scholar]
- 3. Amita J, Vandana T, Guleria RS, Verma RK. 2002. Qualitative evaluation of mycobacterial DNA extraction protocols for polymerase chain reaction. Mol. Biol. Today 3: 43–49 [Google Scholar]
- 4. Anaissie EJ, Penzak SR, Dignani MC. 2002. The hospital water supply as a source of nosocomial infections. Arch. Intern. Med. 162: 1483–1492 [DOI] [PubMed] [Google Scholar]
- 5. Anuj SN, et al. 2009. Identification of Pseudomonas aeruginosa by a duplex real-time polymerase chain reaction assay targeting the ecfX and the gyrB genes. Diagn. Microbiol. Infect. Dis. 63: 127–131 [DOI] [PubMed] [Google Scholar]
- 6. Bargellini A, et al. 2011. Parameters predictive of Legionella contamination in hot water systems: association with trace elements and heterotrophic plate counts. Water Res. 45: 2315–2321 doi:10.1016/j.watres.2011.01.009. [DOI] [PubMed] [Google Scholar]
- 7. Bartie C, Venter SN, Nel LH. 2003. Identification methods for Legionella from environmental samples. Water Res. 37: 1362–1370 doi:10.1016/S0043-1354(02)00220-8. [DOI] [PubMed] [Google Scholar]
- 8. Berry D, Horn M, Xi C, Raskin L. 2010. Mycobacterium avium infections of Acanthamoeba strains: host strain variability, grazing-acquired infections, and altered dynamics of inactivation with monochloramine. Appl. Environ. Microbiol. 76: 6685–6688 [DOI] [PMC free article] [PubMed] [Google Scholar]
- 9. Borella P, et al. 2004. Legionella infection risk from domestic hot water. Emerg. Infect. Dis. 10: 457–464 [DOI] [PMC free article] [PubMed] [Google Scholar]
- 10. Borella P, et al. 2005. Legionella contamination in hot water of Italian hotels. Appl. Environ. Microbiol. 71: 5805–5813 [DOI] [PMC free article] [PubMed] [Google Scholar]
- 11. Brazeau R, Edwards M. 2011. A review of the sustainability of residential hot water infrastructure: public health, environmental impacts and consumer drivers. J. Green Build. 6: 77–95 doi:10.3992/jgb.6.4.77. [Google Scholar]
- 12. Brown-Elliott BA, et al. 2011. Five-year outbreak of community- and hospital-acquired Mycobacterium porcinum infections related to public water supplies. J. Clin. Microbiol. 49: 4231–4238 [DOI] [PMC free article] [PubMed] [Google Scholar]
- 13. Brunkard JM, et al. 2011. Surveillance for waterborne disease outbreaks associated with drinking water—United States, 2007-2008. MMWR Surveill. Summ. 60: 38–68 [PubMed] [Google Scholar]
- 14. Buse HY, Ashbolt NJ. 2011. Differential growth of Legionella pneumophila strains within a range of amoebae at various temperatures associated with in-premise plumbing. Lett. Appl. Microbiol. 53: 217–224 [DOI] [PubMed] [Google Scholar]
- 15. Campese C, et al. 2011. Progress in the surveillance and control of Legionella infection in France, 1998-2008. Int. J. Infect. Dis. 15: e30–e37 [DOI] [PubMed] [Google Scholar]
- 16. CDC 2007. Acanthamoeba keratitis—multiple states, 2005-2007. Morb. Mortal. Wkly. Rep. 56: 532–534 [PubMed] [Google Scholar]
- 17. CDC 2011. Legionellosis—United States, 2000-2009. MMWR Morb. Mortal. Wkly. Rep. 60: 1083–1086 [PubMed] [Google Scholar]
- 18. Cirillo JD, et al. 1999. Intracellular growth in Acanthamoeba castellanii affects monocyte entry mechanisms and enhances virulence of Legionella pneumophila. Infect. Immun. 67: 4427–4434 [DOI] [PMC free article] [PubMed] [Google Scholar]
- 19. Cirillo JD, Falkow S, Tompkins LS, Bermudez LE. 1997. Interaction of Mycobacterium avium with environmental amoebae enhances virulence. Infect. Immun. 65: 3759–3767 [DOI] [PMC free article] [PubMed] [Google Scholar]
- 20. Clarke KR, Somerfield PJ, Chapman MG. 2006. On resemblance measures for ecological studies, including taxonomic dissimilarities and a zero-adjusted Bray-Curtis coefficient for denuded assemblages. J. Exp. Mar. Biol. Ecol. 330: 55–80 [Google Scholar]
- 21. Clarke KR, Somerfield PJ, Gorley RN. 2008. Testing of null hypotheses in exploratory community analyses: similarity profiles and biota-environment linkage. J. Exp. Mar. Biol. Ecol. 366: 56–69 [Google Scholar]
- 22. Clarke KR, Warwick RM. 2001. Change in marine communities: an approach to statistical analysis and interpretation, 2nd ed PRIMER-E Ltd., Plymouth, United Kingdom [Google Scholar]
- 23. Conger NG, et al. 2004. Mycobacterium simiae outbreak associated with a hospital water supply. Infect. Control Hosp. Epidemiol. 25: 1050–1055 [DOI] [PubMed] [Google Scholar]
- 24. Declerck P, et al. 2009. Replication of Legionella pneumophila in biofilms of water distribution pipes. Microbiol. Res. 164: 593–603 [DOI] [PubMed] [Google Scholar]
- 25. De Luca G, Stampi S, Lezzi L, Zanetti F. 1999. Effect of heat and acid decontamination treatments on the recovery of Legionella pneumophila from drinking water using two selective media. Microbiologica 22: 203–208 [PubMed] [Google Scholar]
- 26. Diederen BM, de Jong CM, Aarts I, Peeters MF, van der Zee A. 2007. Molecular evidence for the ubiquitous presence of Legionella species in Dutch tap water installations. J. Water Health 5: 375–383 doi:10.2166/wh.2007.033. [DOI] [PubMed] [Google Scholar]
- 27. Edelstein PH. 1981. Improved semiselective medium for isolation of Legionella pneumophila from contaminated clinical and environmental specimens. J. Clin. Microbiol. 14: 298–303 [DOI] [PMC free article] [PubMed] [Google Scholar]
- 28. EPA 2001. A small systems guide to the total coliform rule: monitoring drinking water to protect public health. EPA, Washington, DC: http://www.epa.gov/ogwdw/disinfection/tcr/pdfs/small-tcr.pdf. [Google Scholar]
- 29. Escobar IC, Randall AA, Taylor JS. 2001. Bacterial growth in distribution systems: effect of assimilable organic carbon and biodegradable dissolved organic carbon. Environ. Sci. Technol. 35: 3442–3447 doi:10.1021/es0106669. [DOI] [PubMed] [Google Scholar]
- 30. Falkinham JO., III 2011. Nontuberculous mycobacteria from household plumbing of patients with nontuberculous mycobacteria disease. Emerg. Infect. Dis. 17: 419–424 [DOI] [PMC free article] [PubMed] [Google Scholar]
- 31. Falkinham JO., III 2009. Surrounded by mycobacteria: nontuberculous mycobacteria in the human environment. J. Appl. Microbiol. 107: 356–367 [DOI] [PubMed] [Google Scholar]
- 32. Falkinham JO, III, Iseman MD, de Haas P, van Soolingen D. 2008. Mycobacterium avium in a shower linked to pulmonary disease. J. Water Health 6: 209–213 [DOI] [PubMed] [Google Scholar]
- 33. Falkinham JO, III, Norton CD, LeChevallier MW. 2001. Factors sinfluencing numbers of Mycobacterium avium, Mycobacterium intracellulare, and other Mycobacteria in drinking water distribution systems. Appl. Environ. Microbiol. 67: 1225–1231 [DOI] [PMC free article] [PubMed] [Google Scholar]
- 34. Flannery B, et al. 2006. Reducing Legionella colonization in water systems with monochloramine. Emerg. Infect. Dis. 12: 588–596 [DOI] [PMC free article] [PubMed] [Google Scholar]
- 35. Guerrieri E, et al. 2008. Effect of bacterial interference on biofilm development by Legionella pneumophila. Curr. Microbiol. 57: 532–536 [DOI] [PubMed] [Google Scholar]
- 36. Hussein Z, Landt O, Wirths B, Wellinghausen N. 2009. Detection of non-tuberculous mycobacteria in hospital water by culture and molecular methods. Int. J. Med. Microbiol. 299: 281–290 [DOI] [PubMed] [Google Scholar]
- 37. Jang HJ, Choi YJ, Ka JO. 2011. Effects of diverse water pipe materials on bacterial communities and water quality in the annular reactor. J. Microbiol. Biotechnol. 21: 115–123 [DOI] [PubMed] [Google Scholar]
- 38. Kilvington S, et al. 2004. Acanthamoeba keratitis: the role of domestic tap water contamination in the United Kingdom. Invest. Ophthalmol. Vis. Sci. 45: 165–169 [DOI] [PubMed] [Google Scholar]
- 39. Kim SY, Lee SH, Freeman C, Fenner N, Kang H. 2008. Comparative analysis of soil microbial communities and their responses to the short-term drought in bog, fen, and riparian wetlands. Soil Biol. Biochem. 40: 2874–2880 [Google Scholar]
- 40. Koide M, Saito A, Kusano N, Higa F. 1993. Detection of Legionella spp. in cooling tower water by the polymerase chain reaction method. Appl. Environ. Microbiol. 59: 1943–1946 [DOI] [PMC free article] [PubMed] [Google Scholar]
- 41. Kuiper MW, et al. 2006. Quantitative detection of the free-living amoeba Hartmannella vermiformis in surface water by using real-time PCR. Appl. Environ. Microbiol. 72: 5750–5756 [DOI] [PMC free article] [PubMed] [Google Scholar]
- 42. Lasheras A, et al. 2006. Influence of amoebae and physical and chemical characteristics of water on presence and proliferation of Legionella species in hospital water systems. Am. J. Infect. Control 34: 520–525 [DOI] [PubMed] [Google Scholar]
- 43. Lautenschlager K, Boon N, Wang Y, Egli T, Hammes F. 2010. Overnight stagnation of drinking water in household taps induces microbial growth and changes in community composition. Water Res. 44: 4868–4877 doi:10.1016/j.watres.2010.07.032. [DOI] [PubMed] [Google Scholar]
- 44. Lee JV, et al. 2011. An international trial of quantitative PCR for monitoring Legionella in artificial water systems. J. Appl. Microbiol. 110: 1032–1044 doi:10.1111/j.1365-2672.2011.04957.x. [DOI] [PMC free article] [PubMed] [Google Scholar]
- 45. Legnani PP, Leoni E, Corradini N. 2002. Legionella contamination of hospital water supplies: monitoring of private healthcare facilities in Bologna, Italy. J. Hosp. Infect. 50: 220–223 [DOI] [PubMed] [Google Scholar]
- 46. Lehtola MJ, et al. 2004. Microbiology, chemistry and biofilm development in a pilot drinking water distribution system with copper and plastic pipes. Water Res. 38: 3769–3779 doi:10.1016/j.watres.2004.06.024. [DOI] [PubMed] [Google Scholar]
- 47. Lehtola MJ, Torvinen E, Miettinen LT, Keevil CW. 2006. Fluorescence in situ hybridization using peptide nucleic acid probes for rapid detection of Mycobacterium avium subsp. avium and Mycobacterium avium subsp. paratuberculosis in potable-water biofilms. Appl. Environ. Microbiol. 72: 848–853 [DOI] [PMC free article] [PubMed] [Google Scholar]
- 48. Leoni E, et al. 2005. Legionella waterline colonization: detection of Legionella species in domestic, hotel and hospital hot water systems. J. Appl. Microbiol. 98: 373–379 [DOI] [PubMed] [Google Scholar]
- 49. Leoni E, Legnani PP. 2001. Comparison of selective procedures for isolation and enumeration of Legionella species from hot water systems. J. Appl. Microbiol. 90: 27–33 [DOI] [PubMed] [Google Scholar]
- 50. Lévesque B, Lavoie M, Joly J. 2004. Residential water heater temperature: 49 or 60 degrees Celsius? Can. J. Infect. Dis. 15: 11–12 [DOI] [PMC free article] [PubMed] [Google Scholar]
- 51. Lucas CE, Taylor TH, Jr, Fields BS. 2011. Accuracy and precision of Legionella isolation by US laboratories in the ELITE program pilot study. Water Res. 45: 4428–4436 doi:10.1016/j.watres.2011.05.030. [DOI] [PubMed] [Google Scholar]
- 52. Mathys W, Stanke J, Harmuth M, Junge-Mathys E. 2008. Occurrence of Legionella in hot water systems of single-family residences in suburbs of two German cities with special reference to solar and district heating. Int. J. Hyg. Environ. Health 211: 179–185 [DOI] [PubMed] [Google Scholar]
- 53. McCoy WF, et al. 2012. Inaccuracy in Legionella tests of building water systems due to sample holding time. Water Res. 46: 3497–3506 doi:10.1016/j.watres.2012.03.062. [DOI] [PubMed] [Google Scholar]
- 54. Moore MR, et al. 2006. Introduction of monochloramine into a municipal water system: impact on colonization of buildings by Legionella spp. Appl. Environ. Microbiol. 72: 378–383 [DOI] [PMC free article] [PubMed] [Google Scholar]
- 55. Mouchtouri V, et al. 2007. Risk factors for contamination of hotel water distribution systems by Legionella species. Appl. Environ. Microbiol. 73: 1489–1492 [DOI] [PMC free article] [PubMed] [Google Scholar]
- 56. Muder RR, Yu VL. 2002. Infection due to Legionella species other than L. pneumophila. Clin. Infect. Dis. 35: 990–998 [DOI] [PubMed] [Google Scholar]
- 57. National Research Council (NRC) 2006. Drinking water distribution systems: assessing and reducing risks. The National Academies Press, Washington, DC [Google Scholar]
- 58. Nazarian EJ, Bopp DJ, Saylors A, Limberger RJ, Musser KA. 2008. Design and implementation of a protocol for the detection of Legionella in clinical and environmental samples. Diagn. Microbiol. Infect. Dis. 62: 125–132 [DOI] [PubMed] [Google Scholar]
- 59. Osborn AM, Moore ERB, Timmis KN. 2000. An evaluation of terminal-restriction fragment length polymorphism (T-RFLP) analysis for the study of microbial community structure and dynamics. Environ. Microbiol. 2: 39–50 [DOI] [PubMed] [Google Scholar]
- 60. Parthuisot N, West NJ, Lebaron P, Baudart J. 2010. High diversity and abundance of Legionella spp. in a pristine river and impact of seasonal and anthropogenic effects. Appl. Environ. Microbiol. 76: 8201–8210 [DOI] [PMC free article] [PubMed] [Google Scholar]
- 61. Pryor M, et al. 2004. Investigation of opportunistic pathogens in municipal drinking water under different supply and treatment regimes. Water Sci. Technol. 50: 83–90 [PubMed] [Google Scholar]
- 62. Qian Y, Meisler DM, Langston RHS, Jeng BH. 2010. Clinical experience with Acanthamoeba keratitis at the Cole Eye Institute, 1999-2008. Cornea 29: 1016–1021 doi:10.1097/ICO.0b013e3181cda25c. [DOI] [PubMed] [Google Scholar]
- 63. Radomski N, et al. 2010. Development of a real-time qPCR method for detection and enumeration of Mycobacterium spp. in surface water. Appl. Environ. Microbiol. 76: 7348–7351 [DOI] [PMC free article] [PubMed] [Google Scholar]
- 64. Rivière D, Szczebara FM, Berjeaud JM, Frere J, Hechard Y. 2006. Development of a real-time PCR assay for quantification of Acanthamoeba trophozoites and cysts. J. Microbiol. Methods 64: 78–83 [DOI] [PubMed] [Google Scholar]
- 65. Shin J-H, Lee H-K, Cho E-J, Yu J-Y, Kang Y-H. 2008. Targeting the rpoB gene using nested PCR-restriction fragment length polymorphism for identification of nontuberculous mycobacteria in hospital tap water. J. Microbiol. 46: 608–614 doi:10.1007/s12275-008-0102-6. [DOI] [PubMed] [Google Scholar]
- 66. Sipos R, et al. 2007. Effect of primer mismatch, annealing temperature and PCR cycle number on 16S rRNA gene-targetting bacterial community analysis. FEMS Microbiol. Ecol. 60: 341–350 [DOI] [PubMed] [Google Scholar]
- 67. Slimani S, et al. 2012. Evaluation of propidium monoazide (PMA) treatment directly on membrane filter for the enumeration of viable but non cultivable Legionella by qPCR. J. Microbiol. Methods 88: 319–321 [DOI] [PubMed] [Google Scholar]
- 68. Suzuki MT, Taylor LT, DeLong EF. 2000. Quantitative analysis of small-subunit rRNA genes in mixed microbial populations via 5′-nuclease assays. Appl. Environ. Microbiol. 66: 4605–4614 [DOI] [PMC free article] [PubMed] [Google Scholar]
- 69. Temmerman R, Vervaeren H, Noseda B, Boon N, Verstraete W. 2007. Inhibition of Legionella pneumophila by Bacillus sp. Eng. Life Sci. 7: 497–503 doi:10.1002/elsc.200620212. [Google Scholar]
- 70. Thomas JM, Ashbolt NJ. 2011. Do free-living amoebae in treated drinking water systems present an emerging health risk? Environ. Sci. Technol. 45: 860–869 doi:10.1021/es102876y. [DOI] [PubMed] [Google Scholar]
- 71. Thomas V, Loret Jousset J-FM, Greub G. 2008. Biodiversity of amoebae and amoebae-resisting bacteria in a drinking water treatment plant. Environ. Microbiol. 10: 2728–2745 [DOI] [PubMed] [Google Scholar]
- 72. Torvinen E, et al. 2004. Mycobacteria in water and loose deposits of drinking water distribution systems in Finland. Appl. Environ. Microbiol. 70: 1973–1981 [DOI] [PMC free article] [PubMed] [Google Scholar]
- 73. Tsintzou A, Vantarakis A, Pagonopoulou O, Athanassiadou A, Papapetropoulou M. 2000. Environmental mycobacteria in drinking water before and after replacement of the water distribution network. Water Air Soil Pollut. 120: 273–282 doi:10.1023/A:1005266827726. [Google Scholar]
- 74. Türetgen I, Sungur EI, Cotuk A. 2005. Enumeration of Legionella pneumophila in cooling tower water systems. Environ. Monit. Assess. 100: 53–58 [DOI] [PubMed] [Google Scholar]
- 75. Valster RM, Wullings BA, van der Kooij D. 2010. Detection of protozoan hosts for Legionella pneumophila in engineered water systems by using a biofilm batch test. Appl. Environ. Microbiol. 76: 7144–7153 [DOI] [PMC free article] [PubMed] [Google Scholar]
- 76. Vanderkooij D. 1992. Assimilable organic carbon as an indicator of bacterial regrowth. J. Am. Water Works Assoc. 84: 57–65 [Google Scholar]
- 77. von Baum H, et al. 2010. Is domestic tap water a risk for infections in neutropenic patients? Infection 38: 181–186 doi:10.1007/s15010-010-0005-4. [DOI] [PubMed] [Google Scholar]
- 78. Weekers PHH, Bodelier PLE, Wijen JPH, Vogels GD. 1993. Effects of grazing by the free-living soil amebas Acanthamoeba castellanii, Acanthamoeba polyphaga, and Hartmannella vermiformis on various bacteria. Appl. Environ. Microbiol. 59: 2317–2319 [DOI] [PMC free article] [PubMed] [Google Scholar]
- 79. Wilton S, Cousins D. 1992. Detection and identification of multiple mycobacterial pathogens by DNA amplification in a single tube. PCR Methods Appl. 1: 269–273 [DOI] [PubMed] [Google Scholar]
- 80. Wullings BA, Bakker G, van der Kooij D. 2011. Concentration and diversity of uncultured Legionella spp. in two unchlorinated drinking water supplies with different concentrations of natural organic matter. Appl. Environ. Microbiol. 77: 634–641 [DOI] [PMC free article] [PubMed] [Google Scholar]
- 81. Wullings BA, van der Kooij D. 2006. Occurrence and genetic diversity of uncultured Legionella spp. in drinking water treated at temperatures below 15 degrees C. Appl. Environ. Microbiol. 72: 157–166 [DOI] [PMC free article] [PubMed] [Google Scholar]
- 82. Yáñez MA, et al. 2011. Quantification of viable Legionella pneumophila cells using propidium monoazide combined with quantitative PCR. J. Microbiol. Methods 85: 124–130 [DOI] [PubMed] [Google Scholar]
- 83. Yu J, Kim D, Lee T. 2010. Microbial diversity in biofilms on water distribution pipes of different materials. Water Sci. Technol. 61: 163–171 [DOI] [PubMed] [Google Scholar]
Associated Data
This section collects any data citations, data availability statements, or supplementary materials included in this article.