

Abstract
Pyrosequencing of 16S rRNA genes (targeting Bacteria and Archaea) and 1H nuclear magnetic resonance were applied to investigate the rumen microbiota and metabolites of Hanwoo steers in the growth stage (HGS), Hanwoo steers in the late fattening stage (HFS), Holstein-Friesian dairy cattle (HDC), and Korean native goats (KNG) in the late fattening stage. This was a two-part investigation. We began by comparing metabolites and microbiota of Hanwoo steers at two stages of husbandry. Statistical comparisons of metabolites and microbial communities showed no significant differences between HFS and HGS (differing by a dietary shift at 24 months and age [67 months versus 12 months]). We then augmented the study by extending the investigation to HDC and KNG. Overall, pyrosequencing of 16S rRNA genes showed that the rumens had highly diverse microbial communities containing many previously undescribed microorganisms. Bioinformatic analysis revealed that the bacterial sequences were predominantly affiliated with four phyla—Bacteroidetes, Firmicutes, Fibrobacteres, and Proteobacteria—in all ruminants. However, interestingly, the bacterial reads belonging to Fibrobacteres were present at a very low abundance (<0.1%) in KNG. Archaeal community analysis showed that almost all of these reads fell into a clade related to, but distinct from, known cultivated methanogens. Statistical analyses showed that the microbial communities and metabolites of KNG were clearly distinct from those of other ruminants. In addition, bacterial communities and metabolite profiles of HGS and HDC, fed similar diets, were distinctive. Our data indicate that bovine host breeds override diet as the key factor that determines bacterial community and metabolite profiles in the rumen.
INTRODUCTION
The rumen is a complex anaerobic microbial ecosystem, where various microorganisms, including Bacteria, Archaea, protozoa, fungi, and viruses, interact in ways that have a significant influence on the health of the ruminant (11, 30). In the rumen, Bacteria are the predominant microorganisms that convert plant biomass into fermentation end products such as short-chain fatty acids (SCFA) and amino acids; these are then utilized by the ruminant host (40, 72). Methanogens, which are predominant among the rumen Archaea, produce methane using carbon dioxide (CO2) and hydrogen (H2) or acetate from bacterial fermentation. Methane production can cause not only a dietary energy loss to the individual animal but also contributes significantly to global warming (2, 66). Therefore, an improved understanding of rumen microbial ecology can contribute to solutions for nutritional and environmental concerns in the livestock industry. Advances in rumen microbiology may also contribute insights into other complex interacting anaerobic microbial ecosystems. Many previous studies have shown that the bacterial and archaeal communities related to the production of fermentation end products and methane emissions are affected by factors, such as ruminant species, diet, feed additives, season, and geographic region (31, 32, 38, 63, 69, 72).
Numerous studies have been performed to obtain a better understanding of the composition of rumen microbial communities, but limited success has been achieved. More than 200 microbial species have been identified from the rumen on the basis of culture-based approaches (17, 28, 51). However, culture-based approaches have many limitations in terms of reproducibility and the culturability of rumen microorganisms, especially Archaea. The use of culture-independent 16S rRNA gene clone libraries and denaturing gradient gel electrophoresis (DGGE) of PCR-amplified 16S rRNA fragments has resulted in a tremendous amount of additional information about rumen microbial communities (9, 22, 23, 32, 54, 62) that partially circumvent the limitations associated with the traditional culture-based methods. However, clone library and DGGE approaches, themselves, also have some limitations because they involve time-consuming steps and produce limited information. The development of a parallel high-throughput pyrosequencing technique provides a new way to continue unveiling details about the microbial communities dwelling in natural habitats (41, 55). Therefore, this method has been used to explore microbial ecology in various ecosystems such as deep mines, soil, the deep marine biosphere, and tidal flats (18, 48, 49). In particular, a multiplex bar-coded pyrosequencing strategy based on 16S rRNA gene sequences allows for the analysis of multiple samples in a single run and provides extensive coverage of communities in order to analyze even a rare microbial component that may comprise as little as 1% of the total population (4, 24, 26, 27, 46).
It is well known that rumen metabolites such as SCFA reflect the collective physiology of the rumen microbial community (11, 30, 40, 72). Although metabolites have a direct influence on ruminant health and nutrition, as well as methane emissions, there is a paucity of definitive information linking rumen metabolites to microbial community composition. Most conventional studies addressing rumen metabolism have focused on how dietary intake influences a single class of rumen metabolites, such as SCFA; comprehensive metabolomic characterization of the rumens have not yet been reported. Proton nuclear magnetic resonance (1H NMR) is one of the most comprehensive and powerful tools for the simultaneous monitoring of multiple organic compounds present in a given sample (1, 21). Although metabolomics using 1H NMR is a good approach, it has been used in only a few rumen microbial studies (1, 3).
In the present study, we applied a combination of the bar-coded 454-pyrosequencing strategy and the 1H NMR technique to analyze and compare rumen microbial communities and their metabolites. This was a two-part investigation. We began by hypothesizing that metabolites and microbiota in the rumens of Hanwoo steers at two stages of husbandry would be distinctive. We then expanded the comparisons to Holstein-Friesian dairy cattle and Korean native goats. The goal was expand our information on the influence of diet and host identity upon the corresponding microbial communities and metabolites of ruminants.
MATERIALS AND METHODS
Animals and rumen sampling.
Four different fistulated ruminants (Hanwoo in the growing stage [HGS], Hanwoo in the late fattening stage [HFS], Holstein-Friesian dairy cattle [HDC], and Korean native goats [KNG] in the late fattening stage; n = 3 for each ruminant) were used for the experiments. All 12 animals were raised at the same facility in the same area (Korea National Institute of Animal Science) on routine Korean farm feed diets (43). All animal-based procedures were undertaken in accordance with the Guidelines for the Care and Use of Experimental Animals of the Korean National Institute of Animal Science. In detail, the HGS (approximately 12 months old, 250 ± 5 kg, male), HFS (approximately 67 months old, 755.5 ± 3.5 kg, male), and HDC (approximately 20 months old, 535 ± 11 kg, female) received diets containing a 4:6 ratio of cow concentrate ration (48.0% corn, 41.0% wheat bran, 5.0% soybean meal, 2.0% rapeseed meal, 2.0% molasses, 1.5% limestone, 0.4% salt, and 0.1% lasalocid) to timothy hay, a 9:1 ratio of cow concentrate ration to rice straw, and a 7:3 ratio of cow concentrate ration to timothy hay, respectively. KNG (approximately 12 months old, 40 ± 5 kg, male) were fed diets containing a 9:1 ratio of goat concentrate ration (25.0% corn, 20.0% wheat bran, 15.0% wheat, 15.0% corn gluten meal, 6.0% rapeseed meal, 6.0% copra meal, 4.0% molasses, 2.0% soybean meal, and 7.0% vitamin-mineral mixture) to Bermuda grass. All ruminants were fed twice daily in equal amounts, along with being provided free access to water and a trace-mineralized salt block.
Rumen samples were collected from the 12 ruminants at 3 h after feeding and were filtered immediately by squeezing through four layers of course gauze (Daehan, Korea). The filtrates were pH measured and then immediately centrifuged (10,000 rpm for 10 min at 4°C). The centrifuge tubes containing the pellets were stored in ice water until particle-associated microorganisms were obtained. The large particles remaining within the filtered gauzes were resuspended and vortexed vigorously for 1 min with the same volume of 0.9% (wt/vol) cold saline for the detachment of the particle-associated microorganisms and then were squeezed again. The filtrates were transferred into the centrifuge tubes containing the pellets and were centrifuged again at 13,000 rpm for 10 min at 4°C to harvest the total microorganisms. The pellets were stored at −80°C prior to the community analyses. One milliliter of the first filtrate was centrifuged separately for the measurement of small subunit rRNA (ss-rRNA) gene copies to estimate the numbers of bacteria, archaea, and protozoa in the rumens using quantitative real-time PCR (qRT-PCR), and the supernatants were stored at −80°C for metabolite analysis.
qRT-PCR to estimate the numbers of bacteria, archaea, and protozoa.
To estimate the total numbers of bacteria, archaea, and protozoa in the rumens, the total genomic DNA from the pellets derived from 1.0 ml of rumen filtrate was extracted using a Fast-DNA spin kit (MPbio, Solon, OH) according to the manufacturer's instructions. For the measurement of the ss-rRNA gene copies of bacteria, archaea, and protozoa, three qRT-PCR primer sets—bac1114F (5′-CGG CAA CGA GCG CAA CCC-3′)/bac1275R (5′-CCA TTG TAG CAC GTG TGT AGC C-3′), arch349F (5′-GYG CAS CAG KCG MGA AW-3′)/arch806R (5′-GGA CTA CVS GGG TATC TAA T-3′), and P316f (5′-GCT TTC GWT GGT AGT GTA TT-3′)/P539r (5′-CTT GCC CTC YAA TCG TWC T-3′)—targeting the 16S rRNA genes of bacteria and archaea and the 18S rRNA genes of protozoa, respectively, were used (13, 60, 64). The qRT-PCR was performed in triplicate as described previously (29). Three standard curves were generated for the calculations of ss-rRNA gene copies on the basis of the number of pCR2.1 vectors (Invitrogen, USA) carrying bacterial (Chloroflexi) and archaeal (Methanogenic archaeon)16S rRNA and protozoan (Entodinium furca) 18S rRNA genes derived from a rumen sample.
PCR amplification for bar-coded pyrosequencing.
Total genomic DNA from the rumen pellets for bar-coded pyrosequencing was extracted using a Fast-DNA spin kit (MPbio) according to the manufacturer's instructions. Bacterial and archaeal 16S rRNA genes containing hypervariable regions (V1 to V3) were amplified using two primer sets—Bac9F (5′-adaptor B-AC-GAG TTT GAT CMT GGC TCA G-3′)/Bac541R (5′-adaptor A-X-AC-WTT ACC GCG GCT GCT GG-3′) and Arc21F (5′-adaptor B-GA-TCC GGT TGA TCC YGC CGG-3′)/Arc519R (5′-adaptor A-X-GA-GGT DTT ACC GCG GCK GCT G-3′) (10, 16, 48, 56)—where “X” denotes unique 7- to 11-bar-code sequences inserted between the 454 Life Sciences adaptor A sequence and the common linkers, AC and GA (see Table S1 in the supplemental material). All PCR amplifications were carried out in a 50-μl C1000 thermal cycler (Bio-Rad, USA) containing 1 μl of template of genomic DNA, 20 pmol of each primer, and a Taq polymerase mixture (Solgent, Korea) using a cycling regime of 1 cycle of 94°C for 5 min, followed by 30 cycles of 94°C for 30 s, 60°C (bacteria) or 58°C (archaea) for 30 s, and 72°C for 1 min 20 s, and finally 1 cycle of 72°C for 10 min. The PCR products were purified using a PCR purification kit (Solgent, Korea) for pyrosequencing.
Pyrosequencing and data analysis.
The purified PCR products were carefully quantified using an enzyme-linked immunosorbent assay reader equipped with a Take3 multivolume plate, and a composite DNA sample was prepared by pooling equal amounts of purified PCR amplicons from each sample. Pyrosequencing was performed by Macrogen (Korea) using a 454 GS-FLX Titanium system (Roche, Germany) and the resulting sequencing reads were processed using the PyroNoise algorithm (47) within the Mothur program (52) to remove sequencing noise. The denoised sequencing data were analyzed using the RDP pyrosequencing pipeline (http://pyro.cme.msu.edu/) (12). Pyrosequencing reads were assigned to specific samples based on their unique bar codes, and then the bar codes were removed. Only pyrosequencing reads with less than two “N” (undetermined nucleotide) and a >300-bp read length were selected for subsequent analysis. Unexpected or nonspecific bacterial and archaeal reads were removed manually using the RDP classifier (12). Operational taxonomic units (OTU) and rarefaction curves were generated using the RDP pyrosequencing pipeline at a 3% dissimilarity level. The Shannon-Weaver (53) and Chao1 biodiversity indices (8) and evenness were calculated by the RDP pyrosequencing pipeline.
Taxonomic assignment of the bacterial and archaeal high quality reads were performed using the RDP naive Bayesian rRNA Classifier based using 80% confidence thresholds. The bacterial and archaeal community structures of the rumen samples were compared using UniFrac analysis (39) based on the phylogenetic relationships of representative sequences derived from all reads of the respective samples. Read sequences were clustered into OTU using CD-HIT (36) with an identity cutoff at 97%. The representative sequences from CD-HIT were aligned using NAST (14) based on the Greengenes database (15), with a minimum alignment length of 300 bp and a minimum identity of 75%. Phylogenetic trees were constructed using the PHYLIP software (v3.6) with the Kimura two-parameter model (20) and were used as input files for the hierarchical clustering of bacterial and archaeal communities in the unweighted UniFrac analysis. To confirm multiple community comparisons from the UniFrac analysis, principal coordinate analysis (PCoA) was also performed. The hierarchical clustering and statistical PCoA were performed using the sequence data sets both before and after removing singletons as described by Zhou et al. (70). Treatment-related differences among the hierarchically clustered microbial communities were also evaluated using the UniFrac significance test (39) and P-test (42) in the UniFrac program. The archaeal reads were further analyzed using their representative sequences with available 16S rRNA gene sequences from GenBank (http://www.ncbi.nlm.nih.gov/BLAST/) to confirm their phylogenetic affiliations. The representative and reference archaeal 16S rRNA gene sequences were aligned using the Greengenes alignment program (http://greengenes.lbl.gov/), and a phylogenetic tree was constructed using MEGA software (v5.0) (65).
Metabolite profiling of rumen fluids and statistical analysis.
One milliliter of each of the respective supernatants obtained by centrifugation was lyophilized and dissolved in 99.9% deuterium oxide (600 μl, D2O) with 5 mM sodium 2,2-dimethyl-2-silapentane-5-sulfonate (DSS; 97%) and then centrifuged at 13,000 rpm for 5 min. The resulting supernatants were transferred into 5-mm NMR tubes, and their 1H NMR spectra were acquired using a Varian Inova 600-MHz NMR spectrometer (Varian, USA). Metabolite identification and quantification of rumen metabolites from the 1H NMR spectra were performed using the Chenomx NMR suite program (v6.1; Chenomx, Canada) as described previously (1, 29). To summarize briefly, all NMR spectra for multivariate statistical analysis were phased and baseline corrected by MestReNova v5.2.5 software (Mestrelab Research SL, Spain). The NMR spectral data of 0.5 to 10.0 ppm were reduced into 0.04-ppm spectral buckets and normalized to the total spectral area. The NMR spectra were converted to ASCII format, and the region of 4.6 to 4.8 ppm, corresponding to water, was removed. The resulting ASCII format files were imported into the MATLAB program and mean centered with no scaling. Principal-component analysis (PCA) was performed using MATLAB PLS_Toolbox (v3.5; Eigenvector Research, USA) at a confidence level of 95%.
Nucleotide sequence accession number.
The pyrosequencing data for the 16S rRNA genes are publicly available in the NCBI Short Read Archive under accession no. SRA047924.
RESULTS
Hanwoo steers: influence of diet and age on rumen metabolites.
Fistulated Hanwoo steers (n = 3) were selected to investigate the influence of diet and age on rumen microbial communities and metabolites. One set was in the early growth stage (12 months in age, 250 kg; HGS) and the other was in the late-fattening stage (67 months, 535 kg; HFS) (Table 1, columns 2 and 3). All animals were fed at the same facility on routine diets recommended by the Korean Institute of Animal Science (43). Besides age and weight, the Hanwoo steers only differed by a dietary shift from cow concentrate-timothy hay (4:6) to cow concentrate-rice straw (9:1) at ∼24 months. The pH of the Hanwoo rumen samples was immediately measured after gauze filtering (Table 1). We predicted that the high proportion of cow concentrate given to the HFS would have led to a reduction in pH due to enhanced lactic acid and other fermentations. However, the values were similar (6.86 versus 6.68, respectively, for HGS and HFS). The apparent buffering in the rumen of the HFS may have been caused by the relatively high content of wheat bran (41%) in the cow concentrate (50).
Table 1.
Ratios of concentrate ration to roughage in feeds and pH values and microbial abundances of rumen fluid samples from four different ruminants
| Parameter | Rumen fluid sample (replicates 1, 2, 3)a |
|||
|---|---|---|---|---|
| HGS | HFS | HDC | KNG | |
| Diet ratiob | Cow concentrate ration: timothy hay = 4:6 | Cow concentrate ration: rice straw = 9:1 | Cow concentrate ration: timothy hay = 7:3 | Goat concentrate ration: Bermuda grass = 9:1 |
| pH | 6.78, 6.88, 6.92 | 6.53, 6.96, 6.55 | 7.86, 7.81, 7.57 | 5.09, 5.27, 4.97 |
| Mean ± SD | 6.86 ± 0.07 | 6.68 ± 0.24 | 7.75 ± 0.16 | 5.11 ± 0.15 |
| Abundance of small subunit rRNA genes (copies/ml) | ||||
| Bacteria (109) | 9.65 ± 0.67, 9.91 ± 0.03, 8.626 ± 0.9 | 3.38 ± 1.20, 3.89 ± 0.28, 2.30 ± 0.56 | 1.74 ± 0.50, 2.36 ± 0.38, 1.42 ± 0.29 | 6.78 ± 1.40, 6.93 ± 0.12, 6.77 ± 0.93 |
| Mean ± SD | 9.39 ± 0.68 | 3.19 ± 0.82 | 1.84 ± 0.48 | 6.73 ± 0.09 |
| Archaea (106) | 10.1 ± 2.59, 13.1 ± 3.89, 14.9 ± 2.26 | 7.69 ± 0.29, 8.15 ± 0.48, 5.48 ± 0.58 | 9.63 ± 0.12, 9.89 ± 0.26, 6.70 ± 0.39 | 8.87 ± 1.63, 8.63 ± 1.63, 8.01 ± 1.21 |
| Mean ± SD | 13.0 ± 1.9 | 7.11 ± 1.4 | 8.74 ± 1.8 | 8.56 ± 0.45 |
| Protozoa (105) | 1.27 ± 0.26, 1.61 ± 0.35, 1.83 ± 0.26 | 1.80 ± 0.06, 2.24 ± 0.02, 2.26 ± 0.25 | 2.01 ± 0.23, 1.46 ± 0.27, 1.69 ± 0.11 | 0.05 ± 0.01, 0.15 ± 0.02, 0.12 ± 0.05 |
| Mean ± SD | 1.57 ± 0.28 | 2.10 ± 0.26 | 1.72 ± 0.28 | 0.11 ± 0.05 |
HGS, Hanwoo in the growing stage; HFS, Hanwoo in the late fattening stage; HDC, Holstein-Friesian dairy cattle; KNG, Korean native goats. The data shown are for three replicate animals ± standard deviations where applicable. Mean pH values and mean ss-rRNA gene copies for the rumen samples were derived from the same three ruminant species.
The cow concentrate ration consisted of 48.0% corn, 41.0% wheat bran, 5.0% soybean meal, 2.0% rapeseed meal, 2.0% molasses, 1.5% limestone, 0.4% salt, and 0.1% lasalocid. The goat concentrate ration contained 25.0% corn, 20.0% wheat bran, 15.0% wheat, 15.0% corn gluten meal, 6.0% rapeseed meal, 6.0% copra meal, 4.0% molasses, 2.0% soybean meal, and 7.0% vitamin-mineral mixture.
In order to compare the metabolites present in the rumen fluids, a 1H NMR approach was applied in triplicate. Intense peaks in the 0.5- to 8.5-ppm ranges in the 1H NMR spectra were associated with the presence of various fermentation products including organic acids, amino acids, amines, and other organic compounds (see Fig. S1 in the supplemental material). Identification and quantification of metabolites of the 1H NMR peaks were performed using Chenomx NMR suite software. A total of 15 organic acids, 12 amino acids, 3 amines, and choline were quantified (Table 2). When the rumen metabolite profiles from Hanwoo in growth and fattening stages were compared (columns 2 and 3 of Table 2), 25 of the 31 analytes were statistically indistinguishable (Student t test, P < 0.05). The compounds that were quantitatively different (acetoacetate, formate, 3-hydroxybutyrate, 3-hydroxyphenylacetate, aspartate, and glutamate) were elevated in HGS, relative to HFS—but only slightly (<2-fold). Thus, despite the difference in age, weight, and diet the metabolite profiles for HFS and HGS were remarkably similar.
Table 2.
Concentrations of metabolites identified in various rumen fluids
| Metabolite | Avg concn (μM) ± SDa |
|||
|---|---|---|---|---|
| HGS | HFS | HDC | KNG | |
| Organic acids | ||||
| Acetate (mM) | 78.9 ± 1.9 | 69.7 ± 1.1 | 63.2 ± 2.16 | 43.7 ± 2.7 |
| Propionate (mM) | 15.2 ± 1.0 | 15.9 ± 1.3 | 15.8 ± 0.9 | 14.7 ± 0.3 |
| Butyrate (mM) | 8.04 ± 0.6 | 9.78 ± 0.5 | 10.8 ± 1.1 | 11.6 ± 1.5 |
| Valerate (mM) | 2.12 ± 0.1 | 2.07 ± 0.1 | 1.84 ± 0.2 | 4.59 ± 0.4 |
| Isobutyrate (mM) | 1.32 ± 0.2 | 1.33 ± 0.1 | 3.61 ± 0.4 | 2.26 ± 0.3 |
| Lactate | 382 ± 39 | 331 ± 36 | 238 ± 14 | 1,400 ± 160 |
| 3-Phenylpropionate | 453 ± 21 | 397 ± 23 | 862 ± 36 | 766 ± 32 |
| Acetoacetate | 141 ± 16 | 84.7 ± 17 | 70.8 ± 6.9 | 564 ± 56 |
| Formate | 154 ± 16 | 105 ± 28 | 75.6 ± 15 | 556 ± 99 |
| Fumarate | 23.8 ± 4.2 | 28.5 ± 8.7 | 25.1 ± 4.0 | 266 ± 49 |
| 3-Hydroxybutyrate | 131 ± 8.0 | 80.1 ± 9.4 | 76.5 ± 17 | 606.3 ± 14 |
| Isovalerate | 726 ± 99 | 681 ± 120 | 533 ± 82 | 1,280 ± 98 |
| Phenylacetate | 379 ± 26 | 343 ± 22 | 219 ± 6.4 | 708 ± 77 |
| 3-Hydroxyphenylacetate | 104 ± 4.3 | 54.5 ± 2.0 | 62.0 ± 3.0 | 293 ± 31 |
| Succinate | 77.3 ± 13 | 73.0 ± 11 | 49.1 ± 8.2 | 240 ± 49 |
| Total organic acids (mM) | 108.1 | 100.1 | 88.4 | 83.6 |
| Amino acids | ||||
| Alanine | 231 ± 51 | 184 ± 54 | 109 ± 26 | 748 ± 51 |
| Aspartate | 410 ± 51 | 252 ± 9.7 | 159 ± 6.2 | 858 ± 67 |
| Glutamate | 479 ± 45 | 341 ± 46 | 256 ± 18 | 811 ± 76 |
| Glycine | 143 ± 34 | 200 ± 45 | 60.3 ± 9.9 | 617 ± 79 |
| Histidine | 171 ± 24 | 164 ± 63 | 71.4 ± 13 | 423 ± 61 |
| Isoleucine | 216 ± 25 | 231 ± 48 | 128 ± 4.1 | 1,060 ± 150 |
| Leucine | 122 ± 46 | 132 ± 20 | 95.3 ± 13 | 487 ± 84 |
| Lysine | 188 ± 30 | 189 ± 17 | 115 ± 24 | 1,030 ± 65 |
| Phenylacetylglycine | 224 ± 12 | 303 ± 68 | 98.1 ± 20 | 511 ± 22 |
| Proline | 418 ± 86 | 399 ± 90 | 289 ± 49 | 1,230 ± 45 |
| Tyrosine | 159 ± 30 | 162 ± 33 | 82.0 ± 14 | 438 ± 33 |
| Valine | 187 ± 12 | 197 ± 31 | 94.1 ± 23 | 549 ± 44 |
| Amines | ||||
| Methylamine | 445 ± 44 | 489 ± 63 | 213 ± 32 | 2,240 ± 150 |
| Cadaverine | 107 ± 1.8 | 104 ± 4.8 | 61.3 ± 7.2 | 514 ± 33 |
| Dimethylamine | 148 ± 9.4 | 164 ± 17 | 75.5 ± 2.0 | 213 ± 29 |
| Miscellaneous | ||||
| Choline | 23.0 ± 2.9 | 16.9 ± 8.2 | 12.1 ± 1.8 | 115 ± 9.2 |
Data are presented as average values measured in triplicate (metabolite concentrations are presented as μM concentrations [unless stated otherwise in column 1] ± mean standard deviations). Ruminant abbreviations are as defined in Table 1, footnote a.
Hanwoo steers: influence of diet and age on rumen microbial community composition assessed by qRT-PCR and pyrosequencing.
Although the exact determination of microbial cell counts using qRT-PCR based on ss-rRNA gene copies is almost impossible because the copy numbers of chromosomal rRNA gene operons vary according to the species type (19), qRT-PCR analysis allows for the estimation of microbial cell counts. Therefore, a qRT-PCR approach was used to estimate the total numbers of Bacteria, Archaea, and protozoa in the Hanwoo rumens (Table 1). Protozoa are well known as symbiotic partners for methanogens in rumens (44, 54, 68). Bacteria were estimated to be slightly more abundant in the HGS rumen (9.39 × 10⁹ 16S rRNA gene copies/ml of filtrate) than in the HFS rumen (3.19 × 10⁹ gene copies/ml) (Table 1). The archaeal 16S rRNA gene copies of the two rumens were ∼3 orders of magnitude lower than those of Bacteria and, again for the archaeal genes, HGS supported slightly higher numbers than HFS (13 × 106 versus 7.1 × 10⁶ copies/ml of filtrate, respectively). The 18S rRNA gene copies of ruminant protozoa were approximately the same (1.6 × 10⁵ versus 2.1 × 10⁵ copies/ml of filtrate, respectively) for HFS and HGS.
We used combined samples of the fluid and particle fractions for the bar-coded pyrosequencing of the bacterial and archaeal communities. After culling ∼2.5% of the total sequencing reads as non-16S rRNA genes, we obtained 40,653 sequencing reads classified into bacterial (14, 664) or archaeal (25, 989) sequences. After the removal of low-quality reads, 11,564 bacterial and 18,738 archaeal reads were used for further analyses (Table 3). After trimming the PCR primers, the average read lengths were between 497 and 453 bases for bacterial and archaeal sequences, respectively.
Table 3.
Summary of the pyrosequencing data and statistical analysis of bacterial and archaeal microbial communities in the rumens of Hanwoo steers (two growth stages), Holstein cows, and Korean native goatsa
| Entry (rumen sample type) | Sample no. | No. of reads | No. of high-quality reads | Avg read length (bp) | OTU | Shannon-Weaver index (H′) | Chao1 index | Evenness (E) | No. of phyla | No. of genera |
|---|---|---|---|---|---|---|---|---|---|---|
| 1 (bacteria in HGS) | 1 | 959 | 831 | 498 | 403 | 5.62 | 771 | 0.94 | 12 | 22 |
| 2 | 2,858 | 2,277 | 497 | 781 | 6.11 | 1,345 | 0.92 | 12 | 39 | |
| 3 | 3,329 | 2,621 | 497 | 896 | 6.29 | 1,419 | 0.93 | 15 | 39 | |
| 2 (bacteria in HFS) | 1 | 3,554 | 2,842 | 494 | 909 | 6.20 | 1,473 | 0.91 | 16 | 40 |
| 2 | 2,474 | 1,839 | 497 | 713 | 6.05 | 1,327 | 0.92 | 14 | 37 | |
| 3 | 1,490 | 1,154 | 497 | 529 | 5.91 | 982 | 0.94 | 14 | 30 | |
| 3 (bacteria in HDC) | 1 | 1,529 | 1,138 | 497 | 520 | 5.94 | 955 | 0.95 | 13 | 35 |
| 2 | 1,146 | 999 | 496 | 469 | 5.82 | 862 | 0.95 | 14 | 28 | |
| 3 | 1,270 | 1,106 | 496 | 519 | 5.94 | 844 | 0.95 | 12 | 34 | |
| 4 (bacteria in KNG) | 1 | 764 | 693 | 500 | 167 | 4.01 | 332 | 0.78 | 5 | 19 |
| 2 | 2,732 | 1,952 | 497 | 322 | 4.48 | 469 | 0.76 | 10 | 30 | |
| 3 | 1,607 | 1,267 | 500 | 159 | 3.75 | 251 | 0.74 | 7 | 20 | |
| 5 (archaea in HGS) | 1 | 5,323 | 4,025 | 453 | 83 | 2.51 | 99 | 0.57 | 1 | 1 |
| 2 | 5,139 | 3,850 | 453 | 55 | 2.26 | 60 | 0.57 | 1 | 1 | |
| 3 | 4,014 | 3,180 | 452 | 41 | 2.30 | 45 | 0.62 | 1 | 2 | |
| 6 (archaea in HFS) | 1 | 4,007 | 2,856 | 453 | 40 | 2.29 | 62 | 0.62 | 1 | 1 |
| 2 | 3,410 | 2,170 | 454 | 29 | 1.88 | 32 | 0.56 | 1 | 2 | |
| 3 | 4,096 | 2,657 | 453 | 34 | 2.28 | 41 | 0.65 | 2 | 1 | |
| 7 (archaea in HDC) | 1 | 2,692 | 1,899 | 453 | 32 | 1.91 | 37 | 0.55 | 2 | 1 |
| 2 | 4,387 | 2,777 | 455 | 32 | 1.86 | 46 | 0.54 | 2 | 1 | |
| 3 | 3,120 | 2,220 | 453 | 27 | 1.92 | 48 | 0.58 | 2 | 1 | |
| 8 (archaea in KNG) | 1 | 1,775 | 1,286 | 452 | 7 | 0.43 | 8 | 0.22 | 1 | 1 |
| 2 | 1,466 | 1,032 | 452 | 8 | 0.47 | 11 | 0.23 | 1 | 1 | |
| 3 | 7,051 | 1,891 | 452 | 11 | 0.17 | 12 | 0.07 | 1 | 1 |
Ruminant abbreviations are as defined in Table 1, footnote a. Three replicate animals were examined per treatment. OTU, operational taxonomic units. OTU were calculated by the RDP pipeline with a 97% OTU cutoff of the 16S rRNA gene sequences. Diversity indices of the microbial communities and numbers of phyla and genera were calculated using the RDP pyrosequencing pipeline based on the 16S rRNA gene sequences. In the last two columns, all unclassified phyla or genera were counted as one phylum or genus.
The next step in assuring the quality of our data set was to plot rarefaction curves to assess how complete the sampling was for the microbial communities (Fig. 1). Failure to approach an asymptote for the bacterial sequences in all three replicate samples from both HGS and HFS rumens indicates highly diverse bacterial communities and incomplete sampling (Fig. 1A). In contrast, asymptotes were strongly approached in the rarefaction curves produced from archaeal sequences derived from both treatments (Fig. 1B); thus, the sampling of the archaeal community was far more complete. After computing several key diversity indices, Shannon-Weaver Index, Chao1, Evenness (using the RDP pyrosequencing pipeline), and tallying the numbers of OTU, phyla, and genera found in the rumens of HGS and HFS (Table 3), few significant differences were found.
Fig 1.
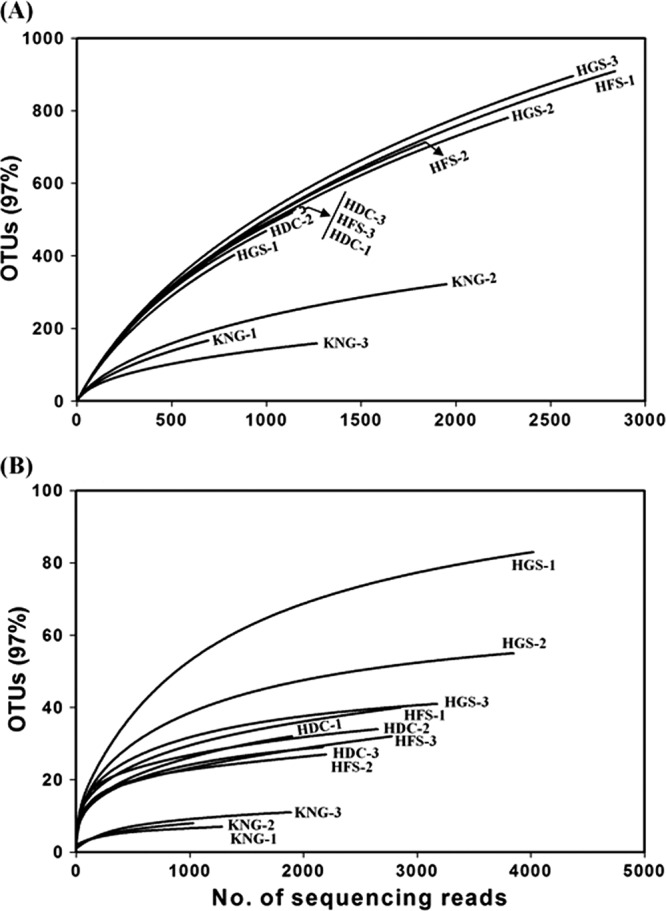
Rarefaction curves of bacterial (A) and archaeal (B) 16S rRNA gene sequences from the rumens of HGS, HFS, HDC, and KNG. The operational taxonomic units (OTUs) were calculated by the RDP pipeline with a 3% dissimilarity.
The next step was to complete a taxonomic characterization of the bacterial and archaeal communities in the rumens of the Hanwoo steers at two different growth stages. To compare the microbial communities, the PCR primer-trimmed 16S rRNA gene sequences derived from HGS and HFS were classified at both genus and phylum levels using the RDP Classifier (Fig. 2, left-hand clusters of bars in panels A to D). The bacterial sequences were classified into different phyla or genera at an 80% confidence threshold (Fig. 2A and B). At the phylum level, Bacteroidetes, Firmicutes, Fibrobacteres, and Proteobacteria comprised ∼91% of the microbial community in all three replicate samples of both HGS and HFS rumens (Fig. 2A, left). Twelve other phyla listed in Fig. 2 (including Lentisphaerae, Spirochaetes, Tenericutes, Actinobacteria, TM7, Chloroflexi, Synergistetes, Verrucomicrobia, Planctomycetes, Elusimicrobia, SR1, and Armatimonadetes) contributed only in a minuscule way to the community composition, while the “unclassified” category was variable but roughly ∼6% of the total. Thus, at the phylum level, microbial communities in the Hanwoo at differing growth stages were indistinguishable. At the genus level (Fig. 2B, left), the most blatant feature about the community compositions of rumens of HGS and HFS was the high (>50%) contribution of unclassified sequences and its variability among replicate animals. Among the classified genera, the dominant ones were Prevotella, Fibrobacter, Anaerovorax, Succinivibrio, Ruminococcus, and Succiniclasticum, and these were the same for both HGS and HFS.
Fig 2.

Bacterial (A and B) and archaeal (C and D) taxonomic compositions of the rumens of Hanwoo steers (two growth stages), Holstein cows, and Korean native goats. The data portray phylum (A and C) and genus (B and D) level 16S rRNA pyrotagged gene sequences found in HGS, HFS, HDC, and KNG (see Table 1 for the treatment key). Sequences were classified using the RDP naive Bayesian rRNA Classifier with an 80% confidence threshold. The minor group in panel C is composed of the genera, each showing a percentage of reads <0.4% of the total reads in all of the samples.
Alignment of archaeal reads showed that almost all retrieved from HGS and HFS rumen samples were fell into the phylum Euryarchaeota (Fig. 2C, left); only one unclassified read was detected from the HFS sample at the phylum level. Strikingly, all archaeal sequences from HGS and HFS rumen samples except for two reads were unclassified at the genus level (Fig. 2D, left); the two recognizable reads from HFS and HGS were affiliated with Methanomicrobium and Natrialba, respectively.
In summary, the first part of this study hypothesized that metabolites and microbiota in the rumens of Hanwoo steers at two stages of husbandry would be distinctive. However, using several criteria (pH, metabolites, and bar-coded pyrosequencing of Bacteria and Archaea), only trivial differences were found. Consequently, we chose to expand the investigation to Holstein-Friesian cows and Korean native goats.
Expanding the study to Holstein-Friesian cows and Korean native goats.
All sampling and analysis procedures used on Hanwoo steers (described above) were applied to the rumen contents of Holstein-Friesian dairy cattle (fed a 7:3 ratio of cow concentrate ration to timothy hay; HDC) and Korean native goats (fed a 9:1 ratio of goat concentrate ration to Bermuda grass; KNG). The HDC diet was very similar to that given to HGS, and we hypothesized that changing the breed of the bovine host would lead to contrasting compositions in the pools of metabolites and microbial populations present in the rumen. We included the KNG treatment as a “positive control ruminant” because the rumens of goats presumably differed drastically from the Hanwoo treatments (by both diet and host identity); we needed to be sure that our methodologies could, in fact, detect differences in pools of rumen metabolites and microorganisms.
We merged the data describing pH and qRT-PCR of three types of rRNA genes in the rumens of HDC and KNG into Table 1 (right-hand columns). As expected, the high ratio of feed ration to roughage (and the relatively short caprine rumen turnover period, relative to the bovine rumen) led to an extremely low pH (5.11) in the KNG rumen; such low pH is symptomatic of acidosis (7). Relative to the HGS, the rumen pH in HDC was slightly elevated (7.75) (Table 1).
Abundances of Bacteria, Archaea, and protozoa found in the rumens of HDC and KNG differed very little from corresponding values found for the 2 Hanwoo treatments (Table 1); values fell within the expected ranges previously published for Bacteria, Archaea, and protozoa (28, 30). There was one exception, however; the number of 18S protozoan rRNA gene copies was at least one order of magnitude lower in KNG (∼ 104/ml) than in the other ruminants (∼105 copies/ml). The low number of protozoa in the KNG rumen was likely caused by the high susceptibility of protozoa to low pH (33, 45).
We merged data produced from1H NMR analysis of metabolites from the HDC and KNG treatments into Table 2 (right-hand columns). As expected, organic acid concentrations in 11 of 15 categories were elevated ca. 2- to 10-fold in KNG rumens, relative to the rumens of the Hanwoo and HDC; this trend of elevated metabolite concentrations in KNG was found for all 12 amino acids analyzed, as well as all three amines, and choline. In comparing the metabolite concentrations from the HDC rumen to those of the Hanwoo, we found no statistical differences for 10 of the 15 amino acids analyzed; however, isobutyrate and 3-phenylpropionate were elevated ∼2-fold, while lactate, phenylacetate and succinate were found in slightly diminished concentrations. Nearly all of the concentrations of amino acids (especially phenylacetylglycine), and all three amines were found at concentrations that were lower in the HDC rumen than in Hanwoo rumens (Table 2).
In Table 3, entries 3, 4, 7, and 8 display results of pyrosequencing data produced from the rumens of HDC and KNG. After culling ∼2.5% of the total pyrosequencing reads as non-16S rRNA genes (see above), we obtained 29,539 sequencing reads classified into bacterial (9,048) or archaeal (20,491) sequences. After the removal of low-quality or unexpected reads, 7,155 bacterial and 11,105 archaeal reads were used for further analyses (Table 3). Rarefaction analyses of the data from HDC and KNG (Fig. 1) revealed trends identical to those found for Hanwoo rumens: the sampling of the archaeal communities was far more complete than the bacterial communities. Although the number of OTU observed was a function of the number of pyrosequencing reads obtained, the OTU analysis (Table 3) clearly showed that the rumen of KNG, with low pH, contained fewer bacterial and archaeal species than those of other ruminants. Microbial diversity indices for HDC and KNG rumens were computed as described above; values for all of the indices were lower for the KNG (Table 3, entries 4 and 8) than for HDC (Table 3, entries 3 and 7) and Hanwoo (Table 3, entries 1, 2, 5, and 6).
Taxonomic pyrosequencing profiles for the rumen bacterial and archaeal microbial communities of HDC and KNG appear in Fig. 2 (right-hand clusters of bars in panels A to D). At the phylum level (Fig. 2A), the bacterial profile of the HDC rumen was remarkably similar to those of the Hanwoo. In contrast, the phylum-level bacterial composition of the KNG rumen was markedly different from bacterial communities carried by the other ruminants. The relative abundance of Bacteroidetes was highest in KNG (62 × 10.5%), whereas it was lowest in HDC (49.5% ± 3.9%). Interestingly, only the rumens of the goats (KNG) contained a very low proportion of Fibrobacteres (<0.1%), which was among the predominant phyla in the other three rumens (2.8 to 4.8%). Also, Actinobacteria comprised a relatively higher proportion (1.4% ± 0.24%) of the community in KNG, while only having minor representation in the three other rumens (0.2 to 0.6%) (Fig. 2A). At the genus level (Fig. 2B), the above trend occurred again: the bacterial profile of HDC matched that of both Hanwoo types, while the profile of KNG was distinctive (especially regarding a near absence of Fibrobacter and the presence in elevated proportions of Olsenella [1.4% ± 0.24%] and Dialister [5.3% ± 3.31%]). Regarding archaeal sequences for HDC and KNG (Fig. 2C and D, right-hand clusters of bars), at the phylum level, virtually all sequences fell into the phylum Euryarchaeota, while only one unclassified read was detected in the HDC samples at the phylum level (Fig. 2C, right-hand clusters of bars). At the genus level (Fig. 2D, right-hand clusters of bars), all sequences were unclassified, which was consistent with the results of HGS and HFS (Fig. 2D, right-hand clusters of bars).
Because the merged data set for archaeal sequences had so few classifiable sequences (Fig. 2C and D), we prepared a phylogenetic tree displaying the taxonomic relationships between known Archaea and the sequences found in the 4 rumens surveyed here. As shown in Fig. 3, 420 sequences representative of 29,843 reads constituted a clade related to, but distinct from the Methanospirillaceae.
Fig 3.
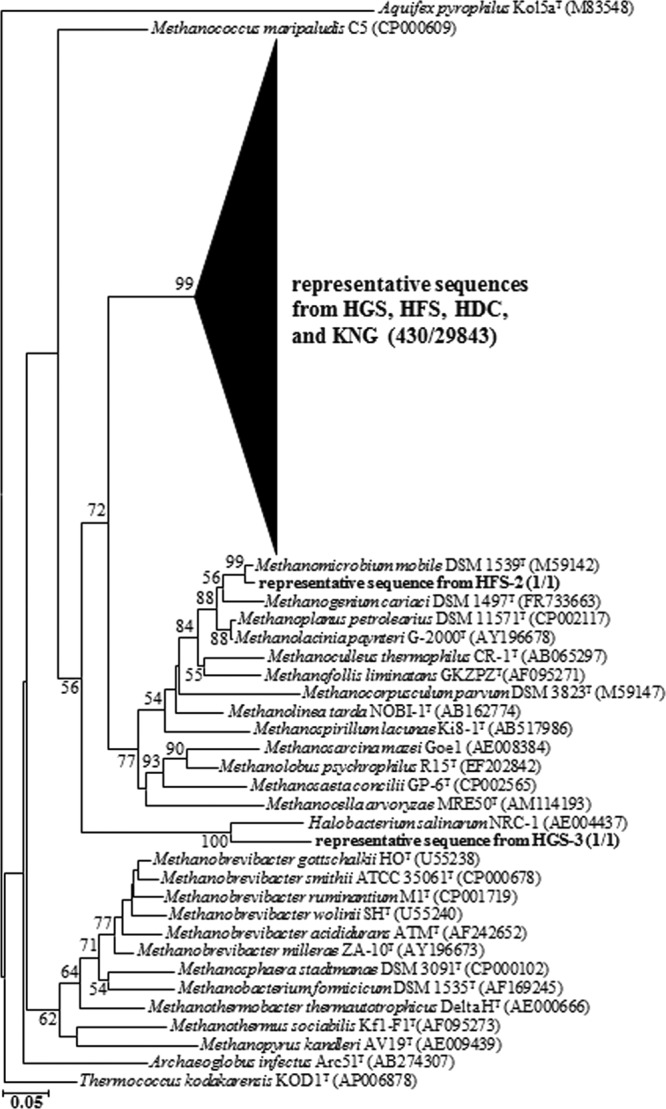
Phylogenetic dendrogram based on 16S rRNA gene sequences showing the phylogenetic relationships of archaeal sequencing reads and selected reference sequences found in Hanwoo steers (two growth stages: HFS and HGS), Holstein cows (HDC), and Korean native goats (KNG). The tree was constructed using 430 representative sequences derived by CD-HIT (97% similarity level) from the total archaeal pyrosequencing reads (29,843 reads). For simplicity, a clade of representative reads is shown as a shaded triangle. The numbers in parentheses indicate the numbers of the representative sequences and their corresponding total sequences, respectively. Bootstrap values are shown as percentages of 1,000 replicates, when greater than 50% at the branch points. Aquifex pyrophilus Kol5aT (M83548) was used as an outgroup. The scale bar indicates 0.05 inferred nucleotide substitution per position.
Statistical comparison of rumen metabolites and microbial community compositions among all four ruminants.
To statistically confirm metabolite differences among the rumens of HGS, HFS, HDC, and KNG discussed above, multivariate analysis (principal-component analysis [PCA]) was applied to the merged 1H NMR spectrum data set. The PCA-derived score plot showed a relatively clear separation of rumen samples according to the identity of the ruminant host (Fig. 4). As expected, the PCA showed that the rumen samples of KNG were clearly distinguished from the other rumen samples by PC1. The rumen samples of HDC were then separated from those of Hanwoo steers by PC2.
Fig 4.
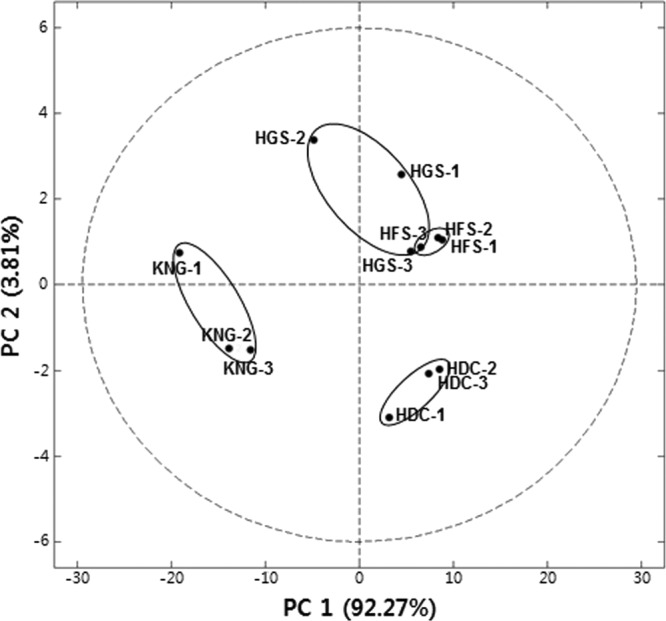
Score plot of principal-component analysis (PCA) of rumen metabolites by PC1 and PC2. The treatment animals were Hanwoo steers (two growth stages: HGS and HFS), Holstein cows (HDC), and Korean native goats (KNG). The score plot was constructed using the mean values of the 1H NMR peaks from triplicate analyses. The ellipse represents the 95% Hotelling confidence region.
To add rigor to the trends emerging from the data presented above for the microbial compositions of the rumens of HGS, HFS, HDC, and KNG, we merged the data sets and completed cluster analysis on individual triplicate animals using the UniFrac method (39). The composition of the bacterial (Fig. 5A) and archaeal (Fig. 5B) microbial communities in the KNG rumen (caprine) fell into clades that were distinct from the communities native to the three bovine samples (HGS, HFS, and HDC), which grouped together in both the bacterial and archaeal trees (Fig. 5). In addition, individual replicates of rumen bacterial communities from HGS, HFS, and HDC samples fell into coherent clades, although this coherence was less clear in the dendrogram displaying the analysis of archaeal sequence data (Fig. 5B). Principal coordinate analysis (PCoA) results (Fig. 6) confirmed relationships found by the UniFrac analysis. The bacterial and archaeal communities of the KNG rumen samples were clearly distinguished from those of the other rumen samples by PC1 (Fig. 6). Moreover, bacterial communities among the HGS, HFS, and HDC samples were distinguished by PC2 (Fig. 6A), although their corresponding archaeal communities were not as well separated (Fig. 6B), as also shown in the UniFrac analysis (Fig. 5B). Recently, it has been demonstrated that amplicon-based community analyses can suffer from low reproducibility, often due to data distortion caused by noise associated with singleton reads (70). Therefore, UniFrac analyses were performed on our sequence data set both with or without the removal of singletons; the results showed that the distinctive separation of treatments shown in Fig. 4, 5, and 6 were robust (unaffected by the presence of singletons, data not shown).
Fig 5.
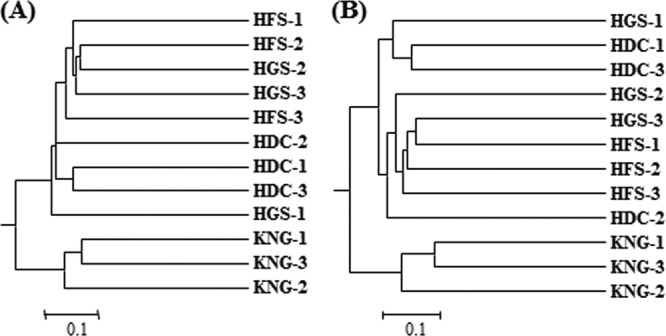
Hierarchical clustering of bacterial (A) and archaeal (B) communities in the rumens of Hanwoo steers (two growth stages), Holstein cows, and Korean native goats using the unweighted UniFrac method in HGS, HFS, HDC, and KNG. The scale bars represent the unweighted UniFrac distances.
Fig 6.

PCoA results showing the relationships of bacterial (A) and archaeal (B) communities of the rumens in HGS, HFS, HDC, and KNG. The PCoA plots were constructed using the unweighted UniFrac method.
Thus, multivariate statistical analyses of both metabolite (1H NMR) and microbial community composition (pyrosequencing) confirmed the following trends: (i) The rumen of the KNG (caprine) was unlike the rumen of the three bovines examined. (ii) There were only slight differences between the HGS and HFS (Hanwoo steers), despite the fact that they differed by both life stage (including age and weight) and diet. (iii) Despite very similar diets, there was a clear distinction between two bovine breeds, HDC and HGS.
DISCUSSION
Studies on the microbial communities and associated metabolites of the rumen are important for understanding the health and performance of ruminant animals, while seeking to reduce related environmental concerns such as methane emissions. In the present study, we applied a combination of a bar-coded 454-pyrosequencing strategy and a 1H NMR technique to investigate the rumen microbial communities and metabolites across a range of ruminants used in agriculture: HGS, HFS, HDS, and KNG. To our knowledge, these results were the first to simultaneously characterize the rumen microbial communities and metabolites using these techniques, although several studies addressing analysis of microbial communities and metabolites in rumens have been performed using the two approaches independently (1, 6, 35).
In the present study, pyrosequencing analysis based on 16S rRNA gene sequences revealed that more than 50% of the bacterial sequencing reads from the rumens fell into the category of unclassified genera (Fig. 2B), indicating that the rumen microbial communities are more complex and diverse than we thought and that rumens contain many microorganisms uncharacterized by previous researchers. The bacterial species richness (Chao1) of bovine rumens (HGS, HFS, and HDC) was 771 to 1473 (Table 3): these values are equivalent to or higher than in previous reports (5, 17, 25, 32, 61) and are likely a consequence of the pyrosequencing technology used. Brulc et al. (5) reported that bacterial communities from the same ruminant species (Angus Simmental Cross steers) were different, even though the ruminants were fed the same diet. Our results also showed that the metabolites and bacterial communities from the same bovine breed (Hanwoo) maintained their similarities despite differences in life stage and diet; however, different bovine breeds with very similar diets (Hanwoo versus Holstein-Friesian) could be phylogenetically and statistically differentiated from one another (Fig. 4, 5, and 6). Also, the caprine (KNG) rumen with low rumen pH values had a very distinctive metabolite and microbial-community profiles, relative to those of bovine (HGS, HFS, and HDS) rumens (Fig. 4, 5, and 6). The relatively high degree of alkalinity found in the HDC rumen was surprising: if grain content, alone, governed rumen pH, then the rumen of HDC (fed 7:3) should have a lower (not higher) pH than the rumen of Hanwoo (HGS) receiving the same diet with lower (4:6) proportion grain. The unexpected buffering may possibly be attributed to lower standing concentrations of acids with a low pKa value, such as lactate (Table 2) (59, 67); alternatively, physiological characteristic of the Holstein-Friesian breed may be involved.
In line with other previous studies, Bacteroidetes and Firmicutes in this study constituted a major fraction of the total sequencing reads in all ruminants (Fig. 2A). Members of Prevotella, Fibrobacter, Hallella, Succiniclasticum, Oscillibacter, Butyrivibrio, Pseudobutyrivibrio, and Ruminococcus were universally present in all ruminants examined, and members of Prevotella were the most abundant (comprising 17 to 50% of the total bacterial reads) of all genera identified in our study at levels relatively higher than those in previous results (32). Members of Fibrobacter were the second most dominant in ruminants (4.3 to 10% of the total bacterial reads), with the sole exception of KNG. Interestingly, the KNG rumens with low rumen pH values contained a very low abundance of Fibrobacter species (0.08% ± 0.14%), suggesting that members of Fibrobacter may be susceptible to low pH. Previous reports have shown that members of Fibrobacter in rumens had not only a fibrolytic property but also an acetate-producing ability (57, 58), which might explain the low production of acetate in KNG (Table 2).
The archaeal sequencing reads were further analyzed using their representative sequences with available cultivated 16S rRNA archaeal gene sequences. As a result, all archaeal sequencing reads were clustered within the methanogenic archaea, with the exception of one read, which might have been a transient archaeon introduced by the ruminant diet (28, 54). Surprisingly, almost all archaeal sequences (29,841/29,843 total) formed a new phylogenic lineage distinct from the known methanogen 16S RNA gene sequences (Fig. 3). These findings are not in accordance with previous reports that Methanobrevibacter sp. or members of the family Methanobacteriaceae (ex., Methanobacterium sp.) were the best-represented methanogens in the rumen (34, 37, 72). Almost all archaeal sequences reported here were categorized as unclassified genera at an 80% confidence threshold, indicating that most of the rumen archaea in common Korean ruminants still remain uncharacterized. Only two archaeal sequencing reads (2 of 29,843) clustered with known archaeal sequences (Fig. 3).
We began this investigation by hypothesizing that metabolites and microbiota in the rumens of Hanwoo steers at two stages of husbandry would be distinctive. When no differences were found, we then expanded the comparisons to Holstein-Friesian dairy cattle (HDC) and Korean native goats (KNG). The HDC diet was very similar to that given to Hanwoo in growth stage, and we hypothesized that changing the breed of the bovine host would lead to contrasting compositions in the pools of metabolites and microbial populations present in the rumen. This hypothesis was supported by the data. Although our pyrosequencing-based community analyses produced useful information for the multiple community comparisons among the ruminant types, it has been shown that the amplicon-based approaches can suffer from low reproducibility (70, 71). Therefore, we recommend experimental designs performing as high a number of replicates as is practical; the three of animals per treatment used in the present study amounted to 100% of the fistulated animals available in the Korea National Institute for Animal Science. Continued investigations of the relationships between both rumen microbiota and metabolites and the diet of host ruminants will add valuable information to the field of the rumen function and related issues that include methane emissions and animal health.
Supplementary Material
ACKNOWLEDGMENTS
This study was carried out with the support of the Cooperative Research Program for Agriculture Science and Technology Development (project J007451), the Next-Generation BioGreen 21 Program (SSAC, grant PJ008220) of the Rural Development Administration, and the National Research Foundation of Korea (grant 2010-0026359) funded by the Korea Government (MEST), Republic of Korea.
Footnotes
Published ahead of print 15 June 2012
Supplemental material for this article may be found at http://aem.asm.org/.
REFERENCES
- 1. Ametaj BN, et al. 2010. Metabolomics reveals unhealthy alterations in rumen metabolism with increased proportion of cereal grain in the diet of dairy cows. Metabolomics 6: 583–594 [Google Scholar]
- 2. Beauchemin KA, McGinn SM. 2006. Methane emissions from beef cattle: effects of fumaric acid, essential oil, and canola oil. J. Anim. Sci. 84: 1489–1496 [DOI] [PubMed] [Google Scholar]
- 3. Bertram HC, et al. 2009. Metabolic characterization of rumen epithelial tissue from dairy calves fed different starter diets using 1H NMR spectroscopy. Livest. Sci. 120: 127–134 [Google Scholar]
- 4. Binladen J, et al. 2007. The use of coded PCR primers enables high-throughput sequencing of multiple homolog amplification products by 454 parallel sequencing. PLoS One 2: e197 doi:10.1371/journal.pone.0000197 [DOI] [PMC free article] [PubMed] [Google Scholar]
- 5. Brulc JM, et al. 2009. Gene-centric metagenomics of the fiber-adherent bovine rumen microbiome reveals forage specific glycoside hydrolases. Proc. Natl. Acad. Sci. U. S. A. 106: 1948–1953 [DOI] [PMC free article] [PubMed] [Google Scholar]
- 6. Callaway TR, et al. 2010. Evaluation of bacterial diversity in the rumen and feces of cattle fed different levels of dried distillers grains plus solubles using bacterial tag-encoded FLX amplicon pyrosequencing. J. Anim. Sci. 88: 3977–3983 [DOI] [PubMed] [Google Scholar]
- 7. Cao GR, English PB, Filippich LJ, Inglis S. 1987. Experimentally induced lactic acidosis in the goat. Aust. Vet. J. 64: 367–370 [DOI] [PubMed] [Google Scholar]
- 8. Chao A. 1987. Estimating the population size for capture-recapture data with unequal catchability. Biometrics 43: 783–791 [PubMed] [Google Scholar]
- 9. Cho SJ, et al. 2006. 16S rDNA analysis of bacterial diversity in three fractions of cow rumen. J. Microbiol. Biotechnol. 16: 92–101 [Google Scholar]
- 10. Chun J, Kim K, Lee Choi J-HY. 2010. The analysis of oral microbial communities of wild-type and Toll-like receptor 2-deficient mice using a 454 GS FLX Titanium pyrosequencer. BMC Microbiol. 10: 101 doi:10.1186/1471-2180-10-101 [DOI] [PMC free article] [PubMed] [Google Scholar]
- 11. Church DC. 1993. Ruminant animal: digestive physiology and nutrition. Prentice-Hall, Englewood Cliffs, NJ [Google Scholar]
- 12. Cole JR, et al. 2009. The Ribosomal Database Project: improved alignments and new tools for rRNA analysis. Nucleic Acids Res. 37: D141–D145 [DOI] [PMC free article] [PubMed] [Google Scholar]
- 13. Denman SE, McSweeney CS. 2006. Development of a real-time PCR assay for monitoring anaerobic fungal and cellulolytic bacterial populations within the rumen. FEMS Microbiol. Ecol. 58: 572–582 [DOI] [PubMed] [Google Scholar]
- 14. DeSantis TZ, et al. 2006. NAST: a multiple sequence alignment server for comparative analysis of 16S rRNA genes. Nucleic Acids Res. 34: W394–W399 [DOI] [PMC free article] [PubMed] [Google Scholar]
- 15. DeSantis TZ, et al. 2006. Greengenes, a chimera-checked 16S rRNA gene database and workbench compatible with ARB. Appl. Environ. Microbiol. 72: 5069–5072 [DOI] [PMC free article] [PubMed] [Google Scholar]
- 16. DeLong EF. 1992. Archaea in coastal marine environments. Proc. Natl. Acad. Sci. U. S. A. 89: 5685–5689 [DOI] [PMC free article] [PubMed] [Google Scholar]
- 17. Edwards E, McEwan NR, Travis AJ, Wallace RJ. 2004. 16S rDNA library-based analysis of ruminal bacterial diversity. Antonie Van Leeuwenhoek 86: 263–281 [DOI] [PubMed] [Google Scholar]
- 18. Edwards RA, et al. 2006. Using pyrosequencing to shed light on deep mine microbial ecology. BMC Genomics 7: 57. [DOI] [PMC free article] [PubMed] [Google Scholar]
- 19. Farrelly V, Rainey FA, Stackebrandt E. 1995. Effect of genome size and rrn gene copy number on PCR amplification of 16S rRNA genes from a mixture of bacterial species. Appl. Environ. Microbiol. 61: 2798–2801 [DOI] [PMC free article] [PubMed] [Google Scholar]
- 20. Felsenstein J. 2002. PHYLIP (Phylogeny Inference Package), version 3.6a. Department of Genetics, University of Washington, Seattle, WA [Google Scholar]
- 21. Figueiredo IM, et al. 2006. 1H NMR, a rapid method to monitor organic acids during cupuassu (Theobroma grandiflorum Spreng) processing. J. Agric. Food Chem. 54: 4102–4106 [DOI] [PubMed] [Google Scholar]
- 22. Gu MJ, et al. 2011. Analysis of methanogenic archaeal communities of rumen fluid and rumen particles from Korean black goats. Anim. Sci. J. 82: 663–672 [DOI] [PubMed] [Google Scholar]
- 23. Guan LL, Nkrumah JD, Basarab JA, Moore SS. 2008. Linkage of microbial ecology to phenotype: correlation of rumen microbial ecology to cattle's feed efficiency. FEMS Microbiol. Lett. 288: 85–91 [DOI] [PubMed] [Google Scholar]
- 24. Hamady M, Walker JJ, Harris JK, Gold NJ, Knight R. 2008. Error-correcting bar-coded primers for pyrosequencing hundreds of samples in multiplex. Nat. Methods 5: 235–237 [DOI] [PMC free article] [PubMed] [Google Scholar]
- 25. Hess M, et al. 2011. Metagenomic discovery of biomass-degrading genes and genomes from cow rumen. Science 331: 463–467 [DOI] [PubMed] [Google Scholar]
- 26. Huber JA, et al. 2007. Microbial population structures in the deep marine biosphere. Science 318: 97–100 [DOI] [PubMed] [Google Scholar]
- 27. Humblot C, Guyot JP. 2009. Pyrosequencing of tagged 16S rRNA gene amplicons for rapid deciphering of the microbiomes of fermented foods such as pearl millet slurries. Appl. Environ. Microbiol. 75: 4354–4361 [DOI] [PMC free article] [PubMed] [Google Scholar]
- 28. Janssen PH, Kirs M. 2008. Structure of the archaeal community of the rumen. Appl. Environ. Microbiol. 74: 3619–3625 [DOI] [PMC free article] [PubMed] [Google Scholar]
- 29. Jung JY, et al. 2011. Metagenomic analysis of kimchi, a traditional Korean fermented food. Appl. Environ. Microbiol. 77: 2264–2274 [DOI] [PMC free article] [PubMed] [Google Scholar]
- 30. Kamra DN. 2005. Rumen microbial ecosystem. Curr. Sci. 89: 124–135 [Google Scholar]
- 31. Kim M, Morrison M, Yu Z. 2011. Status of the phylogenetic diversity census of ruminal microbiomes. FEMS Microbiol. Ecol. 76: 49–63 [DOI] [PubMed] [Google Scholar]
- 32. Kong Y, Teather R, Forster R. 2010. Composition, spatial distribution, and diversity of the bacterial communities in the rumen of cows fed different forages. FEMS Microbiol. Ecol. 74: 612–622 [DOI] [PubMed] [Google Scholar]
- 33. Kurihara Y, Eadie JM, Hobson PN, Mann SO. 1968. Relationship between bacteria and ciliate protozoa in the sheep rumen. J. Gen. Microbiol. 51: 267–288 [DOI] [PubMed] [Google Scholar]
- 34. Lange M, Westermann P, Ahring BK. 2005. Archaea in protozoa and metazoa. Appl. Microbiol. Biotechnol. 66: 465–474 [DOI] [PubMed] [Google Scholar]
- 35. Li RW, Connor EE, Li C, Baldwin Vi RL, Sparks ME. 2011. Characterization of the rumen microbiota of pre-ruminant calves using metagenomic tools. Environ. Microbiol. doi:10.1111/j.1462-2920.2011.02543.x [DOI] [PubMed] [Google Scholar]
- 36. Li W, Godzik A. 2006. Cd-hit: a fast program for clustering and comparing large sets of protein or nucleotide sequences. Bioinformatics 22: 1658–1659 [DOI] [PubMed] [Google Scholar]
- 37. Lin C, Raskin L, Stahl DA. 1997. Microbial community structure of gastrointestinal tracts of domestic animals: comparative analyses using rRNA targeted oligonucleotide probes. FEMS Microbiol. Ecol. 22: 281–294 [Google Scholar]
- 38. Liu Y, Whitman WB. 2008. Metabolic, phylogenetic, and ecological diversity of the methanogenic archaea. Ann. N. Y. Acad. Sci. 1125: 171–189 [DOI] [PubMed] [Google Scholar]
- 39. Lozupone C, Knight R. 2005. UniFrac: a new phylogenetic method for comparing microbial communities. Appl. Environ. Microbiol. 71: 8228–8235 [DOI] [PMC free article] [PubMed] [Google Scholar]
- 40. Mackie RI, Aminov RI, White BA, McSweeney CS. 2000. Molecular ecology and diversity in gut microbial ecosystems, p 61–78 In Cronje PB. (ed), Ruminant physiology: digestion, metabolism, growth and reproduction. CABI Publishing, Oxon, United Kingdom [Google Scholar]
- 41. Margulies M, et al. 2005. Genome sequencing in microfabricated high-density picolitre reactors. Nature 437: 376–380 [DOI] [PMC free article] [PubMed] [Google Scholar]
- 42. Martin AP. 2002. Phylogenetic approaches for describing and comparing the diversity of microbial communities. Appl. Environ. Microbial 38: 3673–3682 [DOI] [PMC free article] [PubMed] [Google Scholar]
- 43. National Institute of Animal Science 2007. Korean feeding standard for Hanwoo. Korean Rural Development Administration, Suwon, Korea [Google Scholar]
- 44. Or-Rashid MM, Al Zahal O, McBride BW. 2008. Studies on the production of conjugated linoleic acid from linoleic and vaccenic acids by mixed rumen protozoa. Appl. Microbiol. Biotechnol. 81: 533–541 [DOI] [PubMed] [Google Scholar]
- 45. Purser DB, Moir RJ. 1959. Ruminal flora studies in the sheep. IX. The effect of pH on the ciliate population of the rumen in vivo. Aust. J. Agric. Res. 10: 555–564 [Google Scholar]
- 46. Qian P-Y, et al. 2011. Vertical stratification of microbial communities in the Red Sea revealed by 16S rDNA pyrosequencing. ISME J. 5: 507–518 [DOI] [PMC free article] [PubMed] [Google Scholar]
- 47. Quince C, et al. 2009. Accurate determination of microbial diversity from 454 pyrosequencing data. Nat. Methods 6: 639–641 [DOI] [PubMed] [Google Scholar]
- 48. Roesch LF, et al. 2007. Pyrosequencing enumerates and contrasts soil microbial diversity. ISME J. 1: 283–290 [DOI] [PMC free article] [PubMed] [Google Scholar]
- 49. Roh SW, et al. 2010. Investigation of archaeal and bacterial diversity in fermented seafood using bar-coded pyrosequencing. ISME J. 4: 1–16 [DOI] [PubMed] [Google Scholar]
- 50. Ruiz G, Bobadilla M, Hovell FDD. 1977. The effect of wheat bran on rumen fermentation, rumen volume and fluid flow rate in Zebu bulls fed chopped whole sugar cane. Trop. Anim. Prod. 3: 247–258 [Google Scholar]
- 51. Russell JB, Hespell RB. 1981. Microbial rumen fermentation. J. Dairy Sci. 64: 1153–1169 [DOI] [PubMed] [Google Scholar]
- 52. Schloss PD, et al. 2009. Introducing mothur: open-source, platform-independent, community-supported software for describing and comparing microbial communities. Appl. Environ. Microbiol. 75: 7537–7541 [DOI] [PMC free article] [PubMed] [Google Scholar]
- 53. Shannon CE, Weaver W. 1963. The mathematical theory of communication. University of Illinois Press, Urbana, IL [Google Scholar]
- 54. Sharp R, Ziemer CJ, Stern MD, Stahl DA. 1998. Taxon-specific associations between protozoal and methanogen populations in the rumen and a model rumen system. FEMS Microbiol. Ecol. 26: 71–78 [Google Scholar]
- 55. Sogin ML, et al. 2006. Microbial diversity in the deep sea and the underexplored ‘rare biosphere’. Proc. Natl. Acad. Sci. U. S. A. 103: 12115–12120 [DOI] [PMC free article] [PubMed] [Google Scholar]
- 56. Sorensen KB, Teske A. 2006. Stratified communities of active archaea in deep marine subsurface sediments. Appl. Environ. Microbiol. 72: 4596–4603 [DOI] [PMC free article] [PubMed] [Google Scholar]
- 57. Stewart CS, Paniagua C, Dinsdale D, Cheng Garrow K-JS. 1981. Selective isolation and characteristics of Bacteroides succinogenes from the rumen of a cow. Appl. Environ. Microbiol. 41: 504–510 [DOI] [PMC free article] [PubMed] [Google Scholar]
- 58. Stewart CS, Flint HJ. 1989. Bacteroides (Fibrobacter) succinogenes, a cellulolytic anaerobic bacterium from the gastrointestinal tract. Appl. Microbiol. Biotechnol. 30: 433–439 [Google Scholar]
- 59. Sun YZ, Mao SY, Zhu WY. 2010. Rumen chemical and bacterial changes during stepwise adaptation to a high-concentrate diet in goats. Animal 4: 210–217 [DOI] [PubMed] [Google Scholar]
- 60. Sylvester JT, Karnati SK, Yu Z, Morrison M, Firkins JL. 2004. Development of an assay to quantify rumen ciliate protozoal biomass in cows using real-time PCR. J. Nutr. 134: 3378–3384 [DOI] [PubMed] [Google Scholar]
- 61. Tajima K, et al. 1999. Rumen bacterial diversity as determined by sequence analysis of 16S rDNA libraries. FEMS Microbiol. Ecol. 29: 159–169 [Google Scholar]
- 62. Tajima K, et al. 2001. Diet-dependent shifts in the bacterial population of the rumen revealed with real-time PCR. Appl. Environ. Microbiol. 67: 2766–2774 [DOI] [PMC free article] [PubMed] [Google Scholar]
- 63. Tajima K, et al. 2007. Influence of high temperature and humidity on rumen bacterial diversity in Holstein heifers. Anaerobe 13: 57–64 [DOI] [PubMed] [Google Scholar]
- 64. Takai K, Horikoshi K. 2000. Rapid detection and quantification of members of the archaeal community by quantitative PCR using fluorogenic probes. Appl. Environ. Microbiol. 66: 5066–5072 [DOI] [PMC free article] [PubMed] [Google Scholar]
- 65. Tamura K, et al. 2011. MEGA5: molecular evolutionary genetics analysis using maximum-likelihood, evolutionary distance, and maximum-parsimony methods. Mol. Biol. Evol. 28: 2731–2739 [DOI] [PMC free article] [PubMed] [Google Scholar]
- 66. Thorpe A. 2009. Enteric fermentation and ruminant eructation: the role (and control?) of methane in the climate change debate. Clim. Change 93: 407–431 [Google Scholar]
- 67. Wheeler WE, Noller CH. 1977. Gastrointestinal tract pH and starch in feces of ruminants. J. Anim. Sci. 44: 131–135 [DOI] [PubMed] [Google Scholar]
- 68. Williams AG, Coleman GS. 1997. The rumen protozoa, p 73–139 In Hobson PN, Stewart CS. (ed), The rumen microbial ecosystem. Blackie Academic and Professional Publishers, London, United Kingdom [Google Scholar]
- 69. Wright AD, et al. 2004. Molecular diversity of rumen methanogens from sheep in Western Australia. Appl. Environ. Microbiol. 70: 1263–1270 [DOI] [PMC free article] [PubMed] [Google Scholar]
- 70. Zhou J, et al. 2011. Reproducibility and quantitation of amplicon sequencing-based detection. ISME J. 5: 1303–1313 [DOI] [PMC free article] [PubMed] [Google Scholar]
- 71. Zhou J, Kang S, Schadt CW, Garten CT. 2008. Spatial scaling of functional gene diversity across various microbial taxa. Proc. Natl. Acad. Sci. U. S. A. 105: 7768–7773 [DOI] [PMC free article] [PubMed] [Google Scholar]
- 72. Zhou M, Hernandez-Sanabria E, Guan LL. 2009. Assessment of the microbial ecology of ruminal methanogens in cattle with different feed efficiencies. Appl. Environ. Microbiol. 75: 6524–6533 [DOI] [PMC free article] [PubMed] [Google Scholar]
Associated Data
This section collects any data citations, data availability statements, or supplementary materials included in this article.