Abstract
Truncation of the algal light-harvesting antenna is expected to enhance photosynthetic productivity. The wild type and three mutant strains of Synechocystis sp. strain 6803 with a progressively smaller phycobilisome antenna were examined under different light and CO2 conditions. Surprisingly, such antenna truncation resulted in decreased whole-culture productivity for this cyanobacterium.
TEXT
Photosynthetic organisms use antenna systems to harvest light and transfer the energy to reaction centers where photochemistry occurs. Antenna systems cause inefficient use of available light energy in monoculture for two reasons: the organisms at the surface of incident light are quickly saturated and must dissipate excess energy by wasteful nonphotochemical processes, and in dense cultures, organisms at the surface of the incident light shade those below (14). Antenna truncation has been considered a viable strategy for increasing monoculture photosynthetic productivity (12), and in the green alga Chlamydomonas reinhardtii, it successfully increased photoautotrophic biomass (3) and hydrogen production (9). Antenna truncation has yet to be explored for biomass production in cyanobacteria.
In the model cyanobacterium Synechocystis sp. strain PCC 6803 (here Synechocystis 6803), and most other cyanobacteria, the phycobilisome complex is a large membrane-extrinsic light-harvesting antenna (8). The phycobilisome is a hemidiscoidal pigment-protein complex composed of an allophycocyanin core, phycocyanin rods, and several linker proteins that connect the rods to the core and the core to the stromal side of the thylakoid membrane (4, 5, 15). Wild type (WT) Synechocystis 6803 and three previously described mutants (CB, CK, and PAL) that express increasingly truncated phycobilisomes were examined for changes in photoautotrophic productivity. In the CB mutant, phycobilisomes contain only one phycocyanin hexamer per rod (17). The CK mutant has phycobilisomes that retain the allophycocyanin core but lack phycocyanin rods (16). The PAL mutant lacks assembled phycobilisomes entirely (1). These mutants were generated by disruption of genes encoding phycobilisome subunits as described in references 1, 16, and 17.
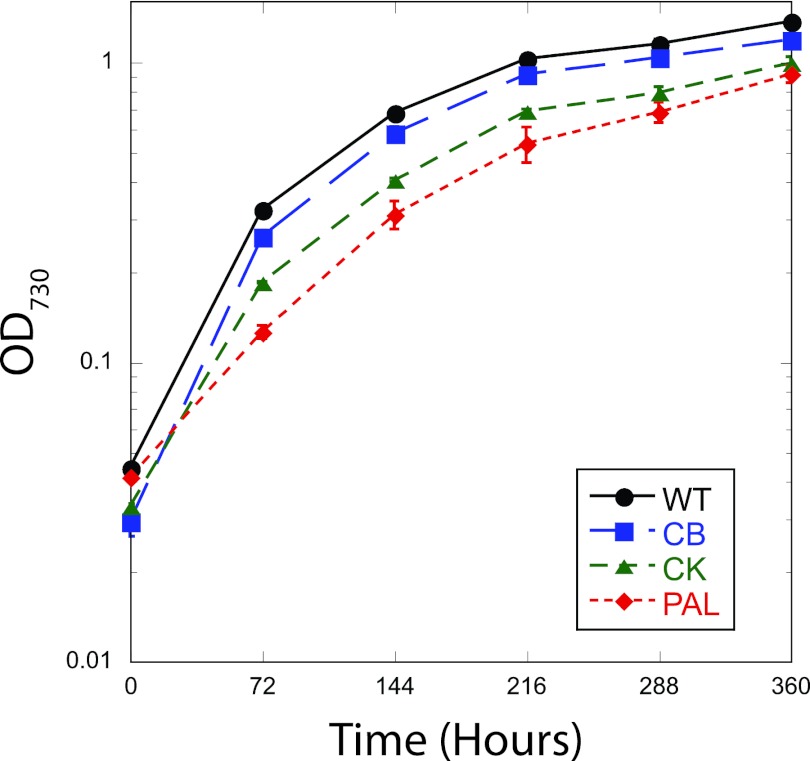
Cyanobacterial strains were maintained on solid BG11 plates (2) with antibiotic selection (for CB and CK, 10 μg/ml kanamycin; for PAL, 10 μg/ml chloroamphenicol and spectinomycin) at 30°C under constant white fluorescent light (30 μmol photons m−2 s−1). Growth levels of these strains were compared using liquid cultures inoculated from plates into 250-ml Erlenmeyer flasks containing 100 ml BG11. Cultures were grown at 30°C in 50-μmol photons m−2 s−1 light on an orbital shaker at 150 rpm, and CO2 was provided by ambient air. A growth curve under these conditions was generated by sampling and measurement of the optical density at 730 nm (OD730) on a BioTek μQuant plate reader at 72-hour intervals for 16 days (Fig. 1). Doubling time was calculated between 0 and 72 h, when cultures were growing exponentially, and was found to be 25.2 ± 0.5 h (WT), 22.8 ± 1.1 h (CB), 29.0 ± 0.5 h (CK), and 44.9 ± 0.5 h (PAL) (means ± standard errors). In general, doubling time increased as antenna size decreased. The WT achieved the highest stationary-phase densities at day 16, and all stationary-phase cell densities were very similar. Under these conditions, antenna modification did not provide a productivity advantage.
Fig 1.
Growth of WT, CB, CK, and PAL in Erlenmeyer flasks at 30°C in ambient air and 50 μmol photons m−2 s−1 from fluorescent lights. Error bars indicate the standard errors of three biological replicates. When error bars cannot be seen, the error was smaller than the size of the symbol.
In order to optimize growth conditions, FMT-150 flat-panel photobioreactors manufactured by Photon Systems, Inc. (13) were used. These bench-scale (350-ml) photobioreactors have a uniform 2-cm path length and use variable-intensity blue (455 nm) and red (627 nm) light-emitting diodes (LEDs) as the light source. A custom CO2 mixing system from Qubit Systems Inc. precisely controlled the CO2 input rate and concentration. Synechocystis 6803 WT, CB, CK, and PAL cultures were started from plates into 100 ml of BG11 in 250-ml Erlenmeyer flasks with appropriate antibiotics. Upon reaching mid-log phase, cultures were pelleted and resuspended in 5 ml of fresh BG11 and transferred to the photobioreactors. Cultures were then adapted to illumination and CO2 conditions in continuous turbidostat mode at an OD735 of 0.3 for 3 days. An integrated densitometer automatically measured changes in optical density at 735 nm (13). Day zero biomass samples of batch mode experiments were taken at the end of the continuous mode growth period and marked the transition to batch mode growth.
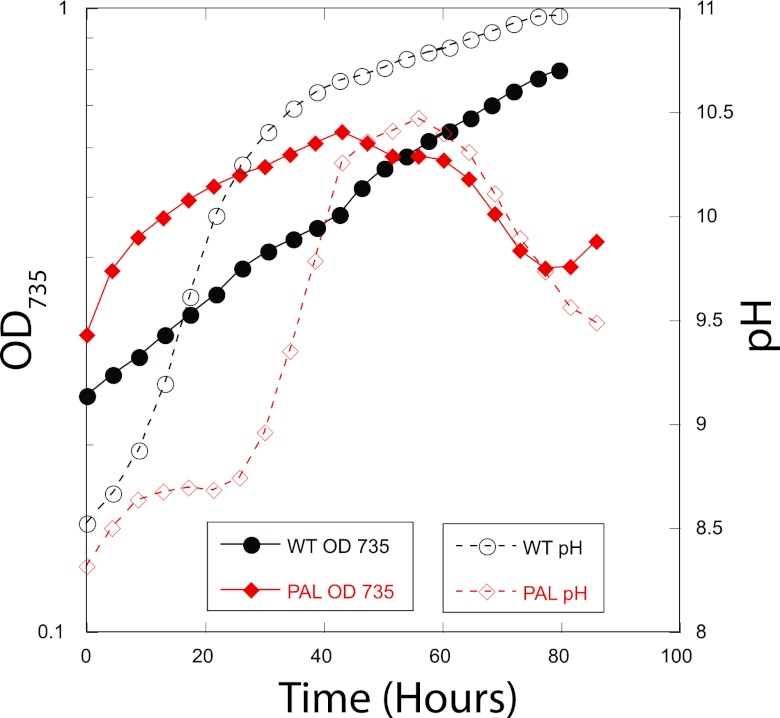
Initial photobioreactor growth curves determined conditions under which both WT and the most severe phycobilisome mutant, PAL, could consistently achieve stationary phase. In air bubbled at 350 ml/min, the PAL mutant cultures repeatedly died at pH ∼10.3 and WT grew slowly. A representative growth curve is shown in Fig. 2. The pH of 10.3 is significant in cyanobacteria cultures: it is the pH at which the predominant carbon species in the medium becomes carbonate, due to CO2 equilibrium with water. These results indicated that PAL has additional difficulties in balancing light harvesting and carbon uptake, and so it was not investigated further.
Fig 2.
Representative growth curves of WT and PAL cultures grown in the FMT-150 photobioreactor with air bubbling at 350 ml per minute, 100 μmol photons m−2 s−1 blue light and 50 μmol photons m−2 s−1 red light, and 30°C.
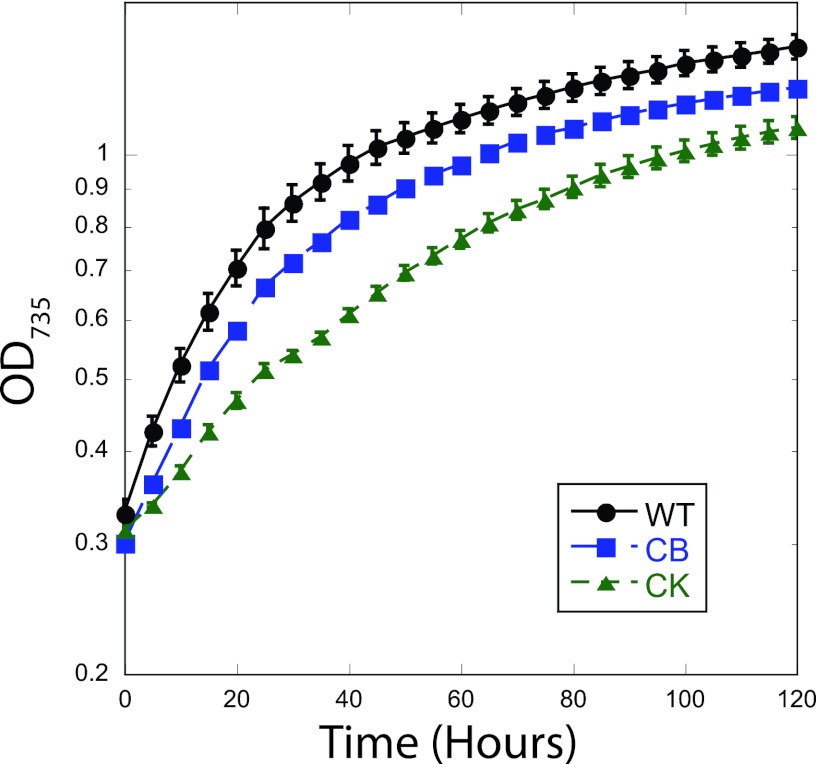
Bubbling 5% CO2 at a rate of 350 ml per minute improved growth irregularities and allowed WT, CB, and CK to reach consistent stationary phases (Fig. 3). Combined light intensities of 100 μmol photons m−2 s−1 (blue) and 50 μmol photons m−2 s−1 (red) were determined to be optimal because the cultures showed a significantly higher doubling time over that in Erlenmeyer flasks and no special treatment of the cells was necessary to achieve repeatable growth curves. Higher light intensities were tested, but both WT and PAL cultures grew sporadically or were photobleached during the 3-day adaptation period.
Fig 3.
Cultures grown in the FMT-150 photobioreactor with 5% CO2 bubbling at 350 ml per minute, 100 μmol photons m−2 s−1 blue light and 50 μmol photons m−2 s−1 red light, and 30°C. Doubling times were calculated from the OD735 during the exponential growth phase. Error bars indicate standard errors for three biological replicates. When error bars cannot be seen, the error was smaller than the size of the symbol.
Culture samples and oxygen evolution data were collected daily during the growth curve experiment in Fig. 3 and used to generate the data summarized in Table 1. An integrated Mettler-Toledo Clark-type oxygen electrode was used to determine respiration (R), photosynthetic oxygen evolution (P), and saturated photosynthetic capacity (Psat) for the entire culture (6). R was determined by measuring the rate of oxygen consumption in the dark, while P was determined by measuring the rate of oxygen evolution with lights set at the experimental level and adding R. Psat was determined by using strong actinic light (700 μmol photons m−2 s−1 [red] and 600 μmol photons m−2 s−1 [blue]) to drive oxygen evolution and adding R. These values reflected productivity parameters for the entire culture in situ.
Table 1.
Productivity parameters for cells at exponential (24 h) and stationary (120 h) phases of growtha
| Parameter | Result at time point for strain |
|||||
|---|---|---|---|---|---|---|
| 24 h |
120 h |
|||||
| WT | CB | CK | WT | CB | CK | |
| Respiration (R; μmol O2/ml/h) | 0.087 ± 0.006 | 0.075 ± 0.005 | 0.088 ± 0.007 | 0.158 ± 0.004 | 0.155 ± 0.002 | 0.142 ± 0.007 |
| Photosynthetic O2 evolution (P; μmol O2/ml/h) | 0.808 ± 0.210 | 0.562 ± 0.117 | 0.448 ± 0.054 | 0.699 ± 0.101 | 0.588 ± 0.092 | 0.633 ± 0.156 |
| Saturated photosynthetic O2 evolution (Psat; μmol O2/ml/h) | 2.284 ± 0.198 | 1.155 ± 0.194 | 1.497 ± 0.143 | 2.436 ± 0.110 | 1.782 ± 0.252 | 1.570 ± 0.242 |
| Cell concn (10−8 cells/ml) | 3.62 ± 0.589 | 3.37 ± 0.185 | 1.82 ± 0.21 | 12.90 ± 1.52 | 13.03 ± 2.64 | 9.85 ± 1.18 |
| Biomass concn (mg/ml) | 4.70 ± 0.092 | 4.63 ± 0.069 | 4.63 ± 0.09 | 5.80 ± 0.10 | 5.52 ± 0.09 | 5.36 ± 0.03 |
| Chlorophyll concn (μg/ml) | 7.60 ± 0.918 | 4.97 ± 0.687 | 4.37 ± 1.04 | 32.06 ± 5.79 | 22.32 ± 1.71 | 16.42 ± 1.32 |
| Phycobilin concn (μg/ml) | 59.43 ± 7.72 | 19.92 ± 3.37 | 5.84 ± 1.65 | 210.91 ± 37.50 | 92.98 ± 11.92 | 18.98 ± 3.13 |
Cultures were grown with 5% CO2 bubbling at 350 ml per minute, 100 μmol photons m−2 s−1 blue light and 50 μmol photons m−2 s−1 red light, and 30°C. Means ± standard errors of three biological replicates are reported.
Cell count, biomass concentration, and pigment concentration findings are also included in Table 1 to accommodate direct comparisons to other microalgal strains. Biomass accumulation in the photobioreactors was measured by oven drying 5-ml samples of liquid culture in aluminum dishes for 24 h at 105°C. The cell count was determined on a Nexcelom Auto M10 cell counter. Chlorophyll and phycobilin concentrations were determined spectroscopically (10). The phycobilin concentration verified the predicted phenotype and was in agreement with whole-cell absorption spectra (7).
The whole-culture oxygen evolution rates of antenna truncation mutants showed more overall photosynthesis when cells were at a high density (120 h) than at exponential growth (24 h). This is in direct contrast to findings with the WT, which performed less overall photosynthesis (P) at stationary phase (Table 1). This did not translate to improved growth rates, however, as calculated doubling times during exponential growth were 13.76 ± 0.48 h (WT), 19.79 ± 0.33 h (CB), and 28.14 ± 1.53 h (CK). Additionally, whole-reactor biomass accumulation rates also decreased with antenna size: 4.02 ± 0.42 mg/h (WT), 3.24 ± 0.07 mg/h (CB), and 2.67 ± 0.31 mg/h (CK). Contrary to the predictions for antenna mitigation proposed with green algal models (11), phycobilisome antenna truncation does not provide a clear productivity advantage to cyanobacterial monoculture.
ACKNOWLEDGMENTS
We thank Ghada Ajlani for providing the mutants used in this study. We thank all members of the Pakrasi lab for collegial discussions.
This work was supported as part of the Photosynthetic Antenna Research Center, an Energy Frontier Research Center funded by the U.S. Department of Energy, Office of Science, Office of Basic Energy Sciences, under award number DE-SC 0001035.
Footnotes
Published ahead of print 15 June 2012
REFERENCES
- 1. Ajlani G, Vernotte C. 1998. Construction and characterization of a phycobiliprotein-less mutant of Synechocystis sp. PCC 6803. Plant Mol. Biol. 37: 577–580 [DOI] [PubMed] [Google Scholar]
- 2. Allen MM. 1968. Simple conditions for the growth of unicellular blue-green algae on plates. J. Phycol. 4: 1–4 [DOI] [PubMed] [Google Scholar]
- 3. Beckmann J, et al. 2009. Improvement of light to biomass conversion by deregulation of light harvesting protein translation in Chlamydomonas reinhardtii. J. Biotechnol. 14: 70–77 [DOI] [PubMed] [Google Scholar]
- 4. Capuano V, Braux A, Tandeau de Marsac N, Houmard J. 1991. The ‘anchor polypeptide’ of cyanobacterial phycobilisomes. Molecular characterization of the Synechococcus sp. PCC 6301 apcE gene. J. Biol. Chem. 266: 7239–7247 [PubMed] [Google Scholar]
- 5. Capuano V, Thomas J-C, Tandeau de Marsac N, Houmard J. 1993. An in vivo approach to define the role of the LCM, the key polypeptide of cyanobacterial phycobilisome. J. Biol. Chem. 268: 8277–8283 [PubMed] [Google Scholar]
- 6. Červený J, Setlík I, Trtílek M, Nedbal L. 2009. Photobioreactor for cultivation and real-time, in-situ measurement of O2 and CO2 exchange rates, growth dynamics, and of chlorophyll fluorescence emission of photoautotrophic microorganisms. Eng. Life Sci. 9: 247–253 [Google Scholar]
- 7. Collins AM, et al. 2012. Photosynthetic pigment localization and thylakoid membrane morphology are altered in Synechocystis 6803 phycobilisome mutants. Plant Physiol. doi:10.1104/pp.111.192849 [DOI] [PMC free article] [PubMed] [Google Scholar]
- 8. Gantt E, Conti SF. 1966. Phycobiliprotein localization in algae. Brookhaven Symp. Biol. 19: 393–405 [PubMed] [Google Scholar]
- 9. Kosourov SN, Ghirardi ML, Seibert M. 2011. A truncated antenna mutant of Chlamydomonas reinhardtii can produce more hydrogen than the parent strain. Int. J. Hyd. Energy 36: 2044–2048 [Google Scholar]
- 10. Lichtenthaler H. 1987. Chlorophylls and carotenoids: pigments of photosynthetic biomembranes. Methods Enzymol. 148: 350–382 [Google Scholar]
- 11. Melis A. 2009. Solar energy conversion efficiencies in photosynthesis: minimizing the chlorophyll antennae to maximize efficiency. Plant Sci. 177: 272–280 [Google Scholar]
- 12. Nakajima Y, Ueda R. 1997. Improvement of photosynthesis in dense microalgal suspension by reduction of light harvesting pigments. J. Appl. Phycol. 9: 503–510 [Google Scholar]
- 13. Nedbal L, Trtílek M, Cervený J, Komárek O, Pakrasi HB. 2008. A precision photobioreactor system for precise cultivation of photoautotrophic microorganisms and for high content analysis of suspension dynamics. Biotechnol. Bioeng. 100: 902–910 [DOI] [PubMed] [Google Scholar]
- 14. Ort D, Zhu X, Melis A. 2011. Optimizing antenna size to maximize photosynthetic efficiency. Plant Physiol. 155: 79–85 [DOI] [PMC free article] [PubMed] [Google Scholar]
- 15. Sidler WA. 1994. Phycobilisome and phycobiliprotein structures, p 139–216 In Bryant DA. (ed), The molecular biology of cyanobacteria. Kluwer Academic Publishers, Dordrecht, The Netherlands [Google Scholar]
- 16. Thomas JC, Ughy B, Lagoutte B, Ajlani G. 2006. A second isoform of the ferredoxin:NADP oxidoreductase generated by an in-frame initiation of translation. Proc. Natl. Acad. Sci. U. S. A. 103. 48: 18368–18373 [DOI] [PMC free article] [PubMed] [Google Scholar]
- 17. Ughy B, Ajlani G. 2004. Phycobilisome rod mutants in Synechocystis sp. PCC 6803. Microbiology 150: 4147–4156 [DOI] [PubMed] [Google Scholar]


