

Abstract
Purpose: To develop a method for creating variable planning margins around a clinical treatment volume (CTV) and to evaluate its application in head and neck cancer radiotherapy in accounting for locoregional variations of nonrigid setup uncertainties.
Methods: Ten computed tomography (CT) images (with a resolution of 0.68 × 0.68 × 2.5 mm3) of a head and neck cancer patient were acquired from the first two weeks of treatment for this study. Five rigid structures (the C2, C5, and caudal C7 vertebrae, mandible, and jugular notch) were used as the landmarks for creating variable local margins. At different CTV locations, local margins were calculated as the weighted average of margins determined at different landmark points from previous studies. The weight was determined by a Gaussian falloff function of the distance between the current location and each landmark point. The CTV delineated on the planning CT image, spanning from the upper portion of the mouth to the lower part of the neck, was expanded to form the planning treatment volume (PTV) with either variable or the conventional constant margins. To evaluate the target coverage, the original planning CTV was deformably mapped to each daily treatment CT using a deformable image registration method. We examined the overlap of the deformed CTV and the rigidly aligned PTV for each margin design strategy and compared the efficacy of the variable margin with the constant margin approach.
Results: For the variable margin approach with a baseline C2 margin of 2.5 mm in the left-right, anterior-posterior, and superior-inferior directions, an average of 99.2% of the CTV was within the PTV, and for the approach with a constant 2.5 mm margin, an average of 97.9% of the CTV was within the PTV. With a baseline margin of 2.0 mm, the variable margin approach had an average coverage of 97.8%, similar to that of the constant 2.5 mm margin approach. However, its average nonoverlapped PTV proportion was 32.4%, smaller than that of the constant 2.5 mm margin approach (33.7%). Paired t-tests of computations from the ten treatment fractions showed no significant difference in CTV coverage for the variable margin approach with a baseline of 2.0 mm and the constant 2.5 margin approach (p = 0.054), but the nonoverlapped PTV proportion was significantly smaller for the variable margin approach with a baseline of 2.0 mm than for the constant 2.5 mm margin approach (p < 0.0001). The CTV coverage with the variable margin approach was also significantly higher than with the constant margin approach in the lower neck area, where a larger setup error normally occurs.
Conclusions: We implemented a variable margin approach to account for locoregional variations of setup uncertainties for head and neck cancer radiotherapy, and demonstrated the effectiveness of this approach when compared with the conventional global constant margin expansion approach, where the treatment target spreads out to a broad region. As variable margin data become available and more clinical studies are performed, this approach could be applicable to other treatment sites as well.
Keywords: head and neck cancer, setup uncertainties, margins, locoregional variations
INTRODUCTION
The introduction of intensity-modulated radiation therapy (IMRT) has enabled the delivery of highly conformal dose distributions to target tumors.1 The dose conformality is critical in radiation therapy because it offers the opportunity to deliver the desired radiation doses accurately to the desired target volume while sparing the nearby healthy organs throughout the course of treatment. In practice, however, the treatment may be delivered to tissues outside of the prescribed clinical target volume (CTV) because of daily setup uncertainties and changes in patient anatomy.2, 3, 4 Daily setup uncertainties are typically managed by implementing procedures that reduce setup error; for example, in head and neck radiotherapy, patients are usually immobilized using external fixation devices such as thermal plastic masks and positioning mouthpieces.5, 6 However, because the patient's external position has limited ability to predict the positions of the internal anatomy, even with careful use of these immobilization devices, the target's position may vary from day to day.3, 7 Furthermore, patients often show notable anatomical changes over the course of treatment as a result of tumor regression and weight loss,2 which create relative nonrigidity between individual structures and lead to additional setup error. A simple translational setup correction, which is usually used in clinical practice, cannot completely compensate for this error.8
To account for these setup uncertainties and ensure that a sufficient dose is delivered to the target, treatment planners apply safety margins to the CTV.9 Traditionally, the resulting planning target volume (PTV) is an expansion of the CTV with a constant margin in each of six possible directions (left [L], right [R], anterior [A], posterior [P], superior [S], and inferior [I]), although the margin can be different for each direction. A fundamental assumption here is that the setup error is the same for each direction throughout the entire target volume. However, this assumption may not be true when multiple targets are spread out over a broad region. Recent studies8, 10 showed that the changes of certain local regions of anatomic structures in the head and neck are nonrigid relative to one another. Therefore, a simple global linear expansion of margin may not be optimal or adequate to compensate for this relative variability. Ideally, the margin should correlate with the uncertainties at different locations. A single large, uniform margin to cover the largest uncertainty in each direction may be too conservative and thus may result in overirradiation of the surrounding healthy tissues. To the best of our knowledge, however, no one has yet developed a method of optimizing variable margins to account for locoregional variations in setup error.
In this paper, we report our work to develop a variable margin design strategy to achieve an optimal margin accommodating local variable setup uncertainties at different anatomic regions of the head and neck. We developed this variable margin design for head and neck cancer radiotherapy on the basis of local anisotropic margin data derived in previous studies.8, 10 Although locoregional variation was studied previously, the current study is, to our knowledge, the first to present such a variable margin design and to supply a practical method for its implementation. Our algorithm performs local margin expansion on the basis of mathematical morphology;11 we compared the effectiveness of this local variable margin expansion with the conventional global constant margin expansion and demonstrated that the former was superior to the latter in compensating for locoregional uncertainties.
METHODS AND MATERIALS
Patient data
Ten computed tomography (CT) images of a head and neck cancer patient receiving IMRT were acquired from the first two weeks of the treatment course for this study. The criterion for selecting the patient was the range of the total CTV that spreads to a large region covering variable margins. We used CT images obtained during early treatment to reduce the effects of tumor shrinkage on our study of setup uncertainties. The CTV contours had been manually drawn by a head-and-neck oncologist on the simulation CT image. During treatment delivery, the setup error had been corrected by rigidly shifting the treatment couch using the translation data acquired from in-house rigid alignment software.12 The acquired CT images had an in-slice spatial resolution of 0.68 × 0.68 mm2 and a slice spacing of 2.5 mm. The appropriate institutional review board at The University of Texas MD Anderson Cancer Center approved this study.
Local variable margin expansion
Local variable margin data
Locoregional variations of setup errors in head and neck cancer radiotherapy were first studied by Zhang et al.,8 who identified three regions of interest (ROIs) consisting of bony structures near the cervical vertebrae C2 and C6 and the palatine process of the maxilla (PPM) with local variations in shift correction in all three directions (L-R, A-P, and S-I). Later, van Kranen et al.10 conducted a similar study that included eight ROIs consisting of bony structures (the mandible, larynx, jugular notch, occiput bone, and C1-C3, C3-C5, C5-C7, and caudal C7 vertebrae) with locally variable errors recorded in all three directions (L-R, A-P, and S-I). In their study, the margin recipe for rigid body setup errors was applied to each ROI locally one-by-one as a first-order approximation13
| (1) |
where Σ denotes the systematic setup error and σ denotes the random error. The local setup error of each ROI was determined by local rigid registration of planning CT to successive daily cone-beam CT (CBCT) scans. The details were described by van Kranen et al.10 for measuring the local margins.
To prove the principle, we used the local margin data from van Kranen et al. in our study with the exception that we did not include the occiput bone region (because it is too far from most head and neck treatment regions to be markedly affected) and the larynx region (because of the variation due to swallowing). We combined two regions with similar local errors (C1-C3 and C3-C5) into a single region called C2, resulting in the five landmark ROIs shown in Fig. 1 (C5 was renamed from C5-C7). The local margins of these five ROIs were computed based on the data given in Table IV of van Kranen et al.,10 and the values were normalized for each of the three directions (L-R, A-P, and S-I) using C2 as the reference ROI because it is a good alignment object and has the smallest variations. This gives rise to the relative margin values for five landmarks as shown in Table 1. The relative margin for C2 is set to 1 in Table 1 for all three directions because it serves as the reference. The actual C2 margins can be measured for each individual practice and set differently. We denote the C2 margin values as the baseline margins. Margin values for other landmark ROIs can be determined using Table 1 after the baseline margins are set.
Figure 1.

Approximate locations of the five landmark ROIs and prescribed CTV displayed in the sagittal plane. This CTV is a diagram of the combination of all treatment CTVs. The PTV is a projected expansion with local variable margins, which are larger for the lower neck area than for the upper neck area.
Table 1.
Relative local variable margins of five landmark ROIs in all three directions (L-R: left-right; A-P: anterior-posterior; S-I: superior-inferior). C2 was the reference ROI.
| Relative local variable margin |
|||
|---|---|---|---|
| ROIs | L-R | A-P | S-I |
| C2 | 1 | 1 | 1 |
| C5 | 1.26 | 1.43 | 1.42 |
| Mandible | 0.83 | 1.31 | 1.76 |
| Jugular notch | 1.34 | 1.43 | 1.50 |
| Caudal C7 | 1.77 | 1.60 | 1.63 |
Principle of margin expansion
The principle of contour margin expansion is attributed to mathematical morphology.11 Before the margin expansion is performed, the 2D contours defining the ROI in all slices are first converted to a 3D binary image, with pixels inside the contours assigned a value of 1 and pixels outside the contours assigned a value of 0. The dilation operation in binary morphology is applied to implement the margin expansion. We introduced the structuring element (SE) in mathematical morphology for better description of the process. A SE is a simple predefined shape that is also a binary image. Binary morphology probes this predefined shape and thereby determines how well it fits or misses the shapes in the original binary image. Specifically, let ℤ3 denote the digital 3D space and an object in this space. Also let B ⊂ ℤ3 denote an arbitrary SE and Bx denote the translation of B with respect to the vector x ∈ ℤ3,
| (2) |
The dilation of X by the SE of B is then defined as the set of all points x such that the intersection of Bx with X is nonempty11, 14
| (3) |
The commonly used SE of B is a sphere of radius r centered at the origin. Expansion of X using such a SE produces a uniform expansion in all directions, as shown in Fig. 2a. However, the radii of the SE can also differ from one another in all six directions so that the SE has an ovoid shape. Using such a SE to expand object X produces a nonuniform expansion, as shown in Fig. 2b. An ellipsoid is a specific type of ovoid shape, with equal radii (pairwise) in the L and R, A and P, and S and I directions but with unequal diameters in the L-R, A-P, and S-I directions. However, even with nonuniform expansion, locoregional variations in setup errors still may not be optimally accounted for because variations can also exist in the same direction at different locations. Therefore, we were motivated to devise a variable margin expansion strategy.
Figure 2.

Illustration of Different margin expansion methods: (a) global uniform margin expansion using a spherical SE of radius r; (b) global nonuniform margin expansion using a SE with different radii in all six directions; and (c) local variable margin expansion with variable radii at different expansion locations.
Design of variable margin expansion
To our knowledge, this paper is the first to describe the development and application of a variable margin design in radiotherapy. In previous studies of margin expansion, whether uniform or nonuniform, a fixed SE such as a sphere or an ovoid shape was used. In our variable margin design, we allowed the SE to change when translated to different locations during the expansion process. Specifically, to expand the object X with local variable margins, we used an ellipsoid SE, allowing the radii to differ in all three directions (L-R, A-P, and S-I). At the same time, the radii of the ellipsoid, , changed continuously with the translated location x. The effective location x was on the surface of the object X during the expansion, as shown in Fig. 2c.
In our study, the object X was the CTV under consideration; this CTV was a combination of all the treatment volumes delineated on the simulation CT image and spanned a broad region from the upper part of the patient's mouth to the lower portion of the neck. At CTV location x, the local margin value, , was calculated as the weighted average of the landmark ROI margins as described in Sec. 2A, denoted as , with N the total number of landmark ROIs,
| (4) |
where wi, i = 1, …, N, are the weights assigned to each landmark ROI. The weights at each location were determined by a Gaussian falloff function of the distance between the current location x and each landmark ROI. If the distance between the current location and the landmark ROI i is di, as shown in Fig. 3, then
| (5) |
where is the normalization factor and σ is a constant balancing the effect of the distance value.
Figure 3.

The local margin value at different CTV locations was calculated as the distance-weighted average of the landmark ROI margins. For a CTV surface point, the distance between this point and the ith landmark ROI is denoted by di, and denotes the ith landmark margin values in all three directions (L-R, A-P, and S-I).
The distance-balancing factor σ is determined by the spatial distribution of the landmark ROIs. To determine this factor, we first computed the geometric center of the landmark ROIs. The geometric center typically resides inside the CTV under consideration and close to the most translated locations of the SE. We then recorded the distance from each landmark ROI to the geometric center and calculated the mean distance . We expected that the Gaussian model in Eq. 5 could be used to appropriately evaluate the distance from the geometric center to the landmark ROIs. Figure 4 shows the curves of weight w as a function of distance x using the model in Eq. 5. The variation of x can effectively change the weight when the curve descends from 1 to 0. To take full advantage of the entire descending area, we set area under the curve in the range of to be 99.9% of the full range between 0 ⩽ x ⩽ ∞; that is,
| (6) |
Notice that the integration on the right-hand side of Eq. 6 equals after the removal of the normalization factor W and that the integration on the left-hand side is a Gaussian error function. Simplification yields
| (7) |
Computing the inverse Gaussian error function in Eq. 7 yields a distance-balancing factor of . Figure 4 shows how different distance-balancing factors can effectively measure the distance.
Figure 4.

Illustration of how distance-balancing factor σ can effectively measure the distance. The larger the distance-balancing factor, the wider the range it can measure. For example, if σ = 2.0, x ⩽ 6.5810 covers 99.9% of the area under the Gaussian curve. It cannot effectively measure distances greater than 6.5810 cm because the computed weight is nearly zero when x > 6.5810.
We used the fast dilation algorithm described by Nikopoulos and Pitas15 to implement the morphological dilation. Using this dilation algorithm in our implementation, the radii of the SE are recomputed for only the object surface locations, thus markedly reducing the computational load. The morphological dilation was performed in image coordinate space. The specified margin value in physical unit should be first converted using image resolution. Using a variable SE to perform the margin expansion, we were able to compensate for the local variations of setup errors.
Validation
Geometric validation
We set up an experiment to compare the effectiveness of using the local variable margins and the global constant margins (Fig. 5). This procedure simulated the clinical procedure for image-guided radiotherapy. The CTV on the planning CT was expanded to generate the PTV using either the local variable margin method or the global constant margin method. Both the CTV and the PTV on the planning CT were then rigidly transformed to a treatment CT, which simulated the setup error correction done during treatment. The CTV was further deformed to the treatment CT space using deformable image registration16 to represent the actual setup error due to nonrigid organ deformation and tumor changes. The rigidly aligned PTV that was expanded from the CTV should effectively contain the deformed CTV to achieve effective treatment while leaving a small portion outside the CTV to reduce irradiation to normal tissue.
Figure 5.

Framework for verifying the effectiveness of planning margin strategy. The CTV on the planning CT was expanded to PTV using either the constant or the variable margin method. Both the CTV and the PTV on the planning CT were rigidly transformed to a treatment CT. The CTV was further deformed to the treatment CT. The overlapping between the deformed CTV and the aligned PTV was used to evaluate the margin design.
We used two evaluation metrics related to overlap between the deformed CTV and the aligned PTV to evaluate the effectiveness of the margin design strategies. One metric was the CTV coverage, i.e., the percentage of the CTV enclosed in the PTV, which was defined as the intersection of the CTV and the PTV divided by the CTV volume (Fig. 6),
| (8) |
Figure 6.

A demonstration of volume overlap between the CTV and the PTV. The intersection of these two volumes is denoted by , while PTV/CTV denotes the portion of the PTV volume not within the CTV.
The higher this value, the better the margin design; that is, the better able it was to compensate for uncertainties. The other metric was the nonoverlapped PTV proportion, which was defined as the portion of the PTV volume not within the CTV divided by the whole PTV,
| (9) |
The lower this value, the better of the margin design; that is, the lower the proportion of normal tissue to be irradiated.
Dosimetric validation
We performed a planning study to compare the dosimetric impact of using the local variable margins and the global constant margins. This patient received an IMRT treatment and the low risk CTV was prescribed to 56 Gy. For simplicity, the PTV was expanded only from the low risk CTV using both local variable margin approach with a 2.0 mm baseline and constant 2.5 mm margin approach. Except the PTV, all other constraints were the same for these two IMRT plans. The plans were established and optimized in Pinnacle3 treatment planning system (Philips Medical Systems, Fitchburg, WI). For these two plans, we compared the dose delivered to the CTV and adjacent organs-at-risk, including left and right parotid glands, brain stem, spinal cord, and esophagus, to evaluate the two margin approaches.
RESULTS
Geometric validation
We compared the local variable margins and the global constant margins for CTV coverage and nonoverlapped PTV proportion. The experiment illustrated in Fig. 5 was carried out for the ten fractions of treatment CTs and the statistical results are listed in Table 2. For the variable margin approach with a baseline margin of 2.5 mm in all three directions, an average of 99.2% of the CTV was enclosed in the PTV, and for the constant margin approach with a margin of 2.5 mm in all three directions average of only 97.9%. With the baseline margin reduced to 2.0 mm, the variable margin approach had an average CTV coverage of 97.8%, similar to that for a constant 2.5 mm margin expansion; however, this variable margin yielded a smaller nonoverlapped PTV proportion (32.4%) than did the design with a constant 2.5 mm margin expansion (33.7%), which can be observed from Table 2. Considering the relatively large CTV volume of approximately 1120 cm3, the absolute volume difference between the variable and constant margin designs is not trivial.
Table 2.
Comparison of variable and constant margins on the percentages of CTV coverage and nonoverlapped PTV portion based on the statistics in ten treatment fractions.
| CTV coverage (%) |
Nonoverlapped PTV proportion (%) |
|||||||
|---|---|---|---|---|---|---|---|---|
| Margin design | Mean | SD | Max | Min | Mean | SD | Max | Min |
| Variable | ||||||||
| 2.5 mm | 99.2 | 1.6 | 100.0 | 95.0 | 39.9 | 1.6 | 42.3 | 36.6 |
| 2.0 mm | 97.8 | 3.0 | 99.7 | 90.7 | 32.4 | 1.4 | 34.2 | 30.5 |
| Constant | ||||||||
| 2.5 mm | 97.9 | 2.9 | 99.7 | 90.8 | 33.7 | 1.3 | 35.5 | 32.0 |
| 2.0 mm | 96.8 | 3.6 | 99.2 | 88.5 | 29.4 | 1.5 | 32.0 | 27.3 |
Note: SD = standard deviation; Max = maximum; Min = minimum.
We also performed paired t-tests of different margin designs in the CTV coverage and nonoverlapped PTV proportion for the ten treatment fractions with a significant level of 0.05. The CTV coverage was significantly higher for the variable margin approach with a 2.5 mm baseline than for the constant 2.5 mm margin approach (p = 0.016), but there was no significant difference between the variable margin approach with a 2.0 mm baseline and constant 2.5 mm margin approach (p = 0.054). However, the nonoverlapped PTV proportion was significantly smaller for the approach with variable margins with a 2.0 mm baseline than for the approach with constant 2.5 mm margins (p < 0.0001). These results demonstrate the advantage of variable margins in correcting setup uncertainties.
The local margins shown in Table 1 imply relatively larger margins in the lower neck area than in the C2 area. This result is understandable because the headrest and external immobilization devices were close to the C2 area. The margins depicted in Fig. 7 also demonstrate this point. In the upper neck region, the CTV was entirely within the PTV, and the variable and constant margin approaches resulted in virtually identical margins. In the lower neck region, some parts of the CTV were outside the PTV created using constant margins. Overall, the PTV created with the variable margin approach contained most of the CTV, yielding a much better CTV coverage.
Figure 7.

The advantage of local variable margins in the lower neck region. Global constant margins are not able to cover some parts of CTV in this area, but the local variable margins enclose most CTV. The lower neck region is magnified for a better visualization of the difference between these two approaches.
Dosimetric validation
The dose volume histograms (DVHs) for the CTV and organs-at-risk were shown in Fig. 8 for both the variable margin approach of 2.0 mm baseline and the constant 2.5 mm margin approach. The DVHs showed that the dose delivered to the CTV for both margin approaches was almost the same. For the adjacent organs-at-risk, the right parotid gland, the brain stem, and the esophagus appeared to receive slightly lower dose for the variable margin approach than the constant margin approach; while the left parotid gland and the spinal cord received similar dose for both margin approaches. The mean dose delivered to these organs-at-risk was shown in Table 3, which also demonstrated that less toxicity to the organs-at-risk for variable margin approach. The dosimetric validation result is consistent with the geometric analysis result obtained in Sec. 3A. We demonstrated that slightly less normal tissue would be irradiated for the variable margin approach.
Figure 8.
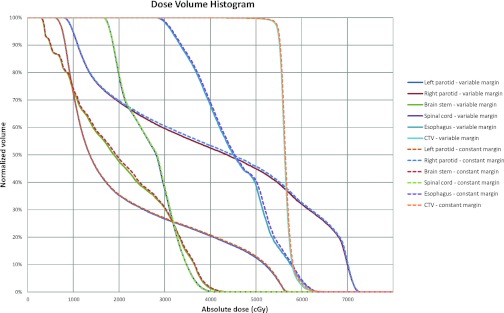
Comparison of dose volume histograms (DVHs) of CTV and organs-at-risk (OARs) for two IMRT plans. The solid lines denote the DVHs of variable margin expansion approach with 2.0 mm baseline, while the dashed lines denote the DVHs of constant 2.5 mm margin approach. The OARs include left and right parotid glands, brain stem, spinal cord, and esophagus.
Table 3.
Comparison of mean dose (unit: cGy) delivered to the organs-at-risk for two margin expansion approaches.
| Margin design | Organs-at-risk |
||||
|---|---|---|---|---|---|
| Left parotid | Right parotid | Brain stem | Spinal cord | Esophagus | |
| Variable 2.0 mm | 2186 | 4107 | 2023 | 2679 | 4538 |
| Constant 2.5 mm | 2200 | 4150 | 2046 | 2686 | 4572 |
DISCUSSION
Variable margin approach to account for regional variations of setup errors for head and neck cancer radiotherapy has demonstrated its superior effectiveness compared with the traditional global constant margin expansion approach when a complicated target spreads out to a broad region with different setup uncertainties. Because we studied only one head and neck cancer patient, the results serve as a preliminary proof of principle. That is, although our assessment of ten treatment fractions consistently showed the advantage of the new margin design, more patient data are needed to demonstrate the effectiveness of this margin strategy.
The advantage of our variable margin approach is to generate location-weighted margins for large and complicated shaped targets to account for regional variations of setup errors. An isotropic margin expansion in current practice does not take into regional variations. The proposed method will not work well if the target is small. A small target will not be affected by setup errors far away from the target. In this situation, our variable margin approach will converge to the constant margin approach.
To our knowledge, variable margin data like those generated by van Kranen et al.10 are available only for head and neck cancer radiotherapy; therefore, we applied our variable margin approach to only a head and neck cancer treatment. However, this approach can be extended to treatments at other sites if the variable margin data are available. More clinical studies on the locoregional variations in setup error are necessary to promote the application of variable margin approach more widely.
It appears that the dosimetric impact for critical organs is not as obvious as the geometric impact for tissues inside a high-dose PTV. The main reason is that the dose gradient in critical structures is not as sharp as the geometric boundary in which the inside and outside of a PTV is clearly defined. If the dose gradient change is small between the two margin approaches, the variable margin approach may not translate into a large dosimetric benefit for organs away from the PTV. In addition, our planning study was performed on the planning CT only and the daily setup uncertainties have not been taken into account yet. Therefore, the dosimetric difference of two margin designs cannot be observed clearly. In the future, we will compare these two margin design strategies by comparing the delivered dose distributions that incorporates daily setup uncertainties.
Our variable margin approach is more sensitive to the image resolution than the constant margin approach; therefore, the advantage of the variable margin approach is limited by the image resolution. In our study, the image resolution was 0.68 × 0.68 × 2.5 mm3. For the constant margin approach, using 3-mm and 2.5-mm margins yielded exactly the same results, mainly because of the relatively large slice spacing (2.5 mm). However, when using our variable margin approach with a baseline margin of 3 mm, the mean CTV coverage increased to 99.5 ± 1.2% and the nonoverlapped PTV proportion increased to 43.0 ± 1.7%. This result demonstrates that images that have higher resolution, especially a smaller slice spacing in the S-I direction, will have a better margin expansion result than their counterparts when our proposed variable margin approach is used. In order to demonstrate this point, we resampled the images to have a slice spacing of 1.5 mm in S-I direction and redid the experiment in Fig. 5 for the first fraction of treatment CT. For the variable margin approach with 2.0-mm baseline, the CTV coverage increased from 94.5% to 95.8%, while the nonoverlapped PTV proportion decreased from 30.6% to 28.2%.
In our current study, we estimated the local margin values from five sparse landmark ROIs. The estimation only obtained approximate margin values and required online computation. In a future study, we plan to construct a patient model based on population studies to show the local variable margin values at each voxel location.17, 18, 19 This patient model would be site-specific, and depend on tumor staging and patient characteristics. With this patient model, we will be able to apply the variable margin expansion directly to a new patient after deformable image registration16 by mapping the local margin values on the patient model to the corresponding locations on the new patient. Thus, there will be no need to estimate the local margin values according to weighted averages of the landmark ROI margins, and we can expect a more accurate local margin expansion.
CONCLUSIONS
In conclusion, we implemented a variable margin approach to account for locoregional variations of setup errors and demonstrated its superior effectiveness compared with the traditional global constant margin approach. The variable margin approach has the potential to improve margin design in radiotherapy by improving the compensation for setup uncertainties while reducing irradiation of surrounding normal tissues.
ACKNOWLEDGMENTS
This research was supported in part by the National Institutes of Health through MD Anderson's Cancer Center Support Grant No. CA016672. We would also like to acknowledge Kathryn B. Carnes and Sarah Bronson from the Department of Scientific Publication for reviewing our paper. The authors declare no conflicts of interest regarding the work presented here.
Presented at the Annual Meeting of the American Association of Physicists in Medicine, Pittsburgh, Pennsylvania, July 2010.
References
- Cozzi L., Fogliata A., Bolsi A., Nicolini G., and Bernier J., “Three-dimensional conformal vs. intensity-modulated radiotherapy in head-and-neck cancer patients: Comparative analysis of dosimetric and technical parameters,” Int. J. Radiat. Oncol., Biol., Phys. 58, 617–624 (2004). 10.1016/j.ijrobp.2003.09.059 [DOI] [PubMed] [Google Scholar]
- Barker J. L., Garden A. S., Ang K. K., O’Daniel J. C., Wang H., Court L. E., Morrison W. H., Rosenthal D. I., Chao K. S. C., Tucker S. L., Mohan R., and Dong L., “Quantification of volumetric and geometric changes occurring during fractionated radiotherapy for head-and-neck cancer using an integrated CT/linear accelerator system,” Int. J. Radiat. Oncol., Biol., Phys. 59, 960–970 (2004). 10.1016/j.ijrobp.2003.12.024 [DOI] [PubMed] [Google Scholar]
- Hong T. S., Tome W. A., Chappell R. J., Chinnaiyan P., Mehta M. P., and Harari P. M., “The impact of daily setup variations on head-and-neck intensity-modulated radiation therapy,” Int. J. Radiat. Oncol., Biol., Phys. 61, 779–788 (2005). 10.1016/j.ijrobp.2004.07.696 [DOI] [PubMed] [Google Scholar]
- van Asselen B., Raaijmakers C. P. J., Lagendijk J. J. W., and Terhaard C. H. J., “Intrafraction motions of the larynx during radiotherapy,” Int. J. Radiat. Oncol., Biol., Phys. 56, 384–390 (2003). 10.1016/S0360-3016(02)04572-8 [DOI] [PubMed] [Google Scholar]
- Willner J., Hadinger U., Neumann M., Schwab F. J., Bratengeier K., and Flentje M., “Three dimensional variability in patient positioning using bite block immobilization in 3D-conformal radiation treatment for ENT-tumors,” Radiother. Oncol. 43, 315–321 (1997). 10.1016/S0167-8140(97)00055-8 [DOI] [PubMed] [Google Scholar]
- Karger C. P., Jakel O., Debus J., Kuhn S., and Hartmann G. H., “Three-dimensional accuracy and interfractional reproducibility of patient fixation and positioning using a stereotactic head mask system,” Int. J. Radiat. Oncol., Biol., Phys. 49, 1493–1504 (2001). 10.1016/S0360-3016(00)01562-5 [DOI] [PubMed] [Google Scholar]
- Manning M. A., Wu Q. W., Cardinale R. M., Mohan R., Lauve A. D., Kavanagh B. D., Morris M. M., and Schmidt-Ullrich R. K., “The effect of setup uncertainty on normal tissue sparing with IMRT for head-and-neck cancer,” Int. J. Radiat. Oncol., Biol., Phys. 51, 1400–1409 (2001). 10.1016/S0360-3016(01)01740-0 [DOI] [PubMed] [Google Scholar]
- Zhang L., Garden A. S., Lo J., Ang K. K., Ahamad A., Morrison W. H., Rosenthal D. I., Chambers M. S., Zhu X. R., Mohan R., and Dong L., “Multiple regions-of-interest analysis of setup uncertainties for head-and-neck cancer radiotherapy,” Int. J. Radiat. Oncol., Biol., Phys. 64, 1559–1569 (2006). 10.1016/j.ijrobp.2005.12.023 [DOI] [PubMed] [Google Scholar]
- International Commission on Radiation Units and Measurements, ICRU Report 62, Prescribing, recording, and reporting photon beam therapy (Supplement to ICRU Report 50) (ICRU, Bethesda, MD, 1999).
- Van Kranen S., Van Beek S., Rasch C., Van Herk M., and Sonke J.-J., “Setup uncertainties of anatomical sub-regions in head-and-neck cancer patients after offline CBCT guidance,” Int. J. Radiat. Oncol., Biol., Phys. 73, 1566–1573 (2009). 10.1016/j.ijrobp.2008.11.035 [DOI] [PubMed] [Google Scholar]
- Soille P., Morphological Image Analysis: Principles and Applications, 2nd ed. (Springer, New York, 2003). [Google Scholar]
- Court L., Rosen I., Mohan R., and Dong L., “Evaluation of mechanical precision and alignment uncertainties for an integrated CT/LINAC system,” Med. Phys. 30, 1198–1210 (2003). 10.1118/1.1573792 [DOI] [PubMed] [Google Scholar]
- van Herk M., Remeijer P., Rasch C., and Lebesque J. V., “The probability of correct target dosage: Dose-population histograms for deriving treatment margins in radiotherapy,” Int. J. Radiat. Oncol., Biol., Phys. 47, 1121–1135 (2000). 10.1016/S0360-3016(00)00518-6 [DOI] [PubMed] [Google Scholar]
- Vincent L., “Morphological transformations of binary images with arbitrary structuring elements,” Signal Process. 22, 3–23 (1991). 10.1016/0165-1684(91)90025-E [DOI] [Google Scholar]
- Nikopoulos N. and Pitas I., “A fast implementation of 3-D binary morphological transformations,” IEEE Trans. Image Process. 9, 283–286 (2000). 10.1109/83.821743 [DOI] [PubMed] [Google Scholar]
- Wang H., Dong L., Lii M. F., Lee A. L., de Crevoisier R., Mohan R., Cox J. D., Kuban D. A., and Cheung R., “Implementation and validation of a three-dimensional deformable registration algorithm for targeted prostate cancer radiotherapy,” Int. J. Radiat. Oncol., Biol., Phys. 61, 725–735 (2005). 10.1016/j.ijrobp.2004.07.677 [DOI] [PubMed] [Google Scholar]
- Coolens C., Webb S., Shirato H., Nishioka K., and Evans P. M., “A margin model to account for respiration-induced tumour motion and its variability,” Phys. Med. Biol. 53, 4317–4330 (2008). 10.1088/0031-9155/53/16/007 [DOI] [PubMed] [Google Scholar]
- Hugo G. D., Yan D., and Liang J., “Population and patient-specific target margins for 4D adaptive radiotherapy to account for intra- and inter-fraction variation in lung tumour position,” Phys. Med. Biol. 52, 257–274 (2007). 10.1088/0031-9155/52/1/017 [DOI] [PubMed] [Google Scholar]
- Mongioj V., Orlandi E., Palazzi M., Deponti E., Marzia F., Stucchi C., Sangalli C., Fallai C., Zonca G., Olmi P., and Pignoli E., “Set-up errors analyses in IMRT treatments for nasopharyngeal carcinoma to evaluate time trends, PTV and PRV margins,” Acta Oncol. 50, 61–71 (2011). 10.3109/0284186X.2010.509108 [DOI] [PubMed] [Google Scholar]