Figure 4.
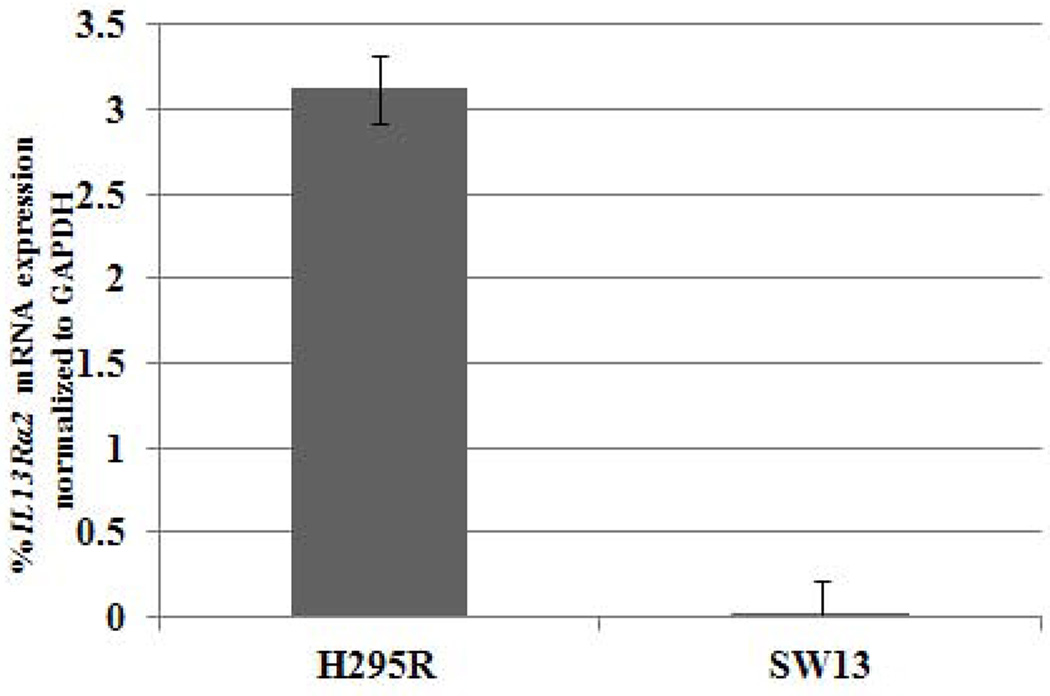
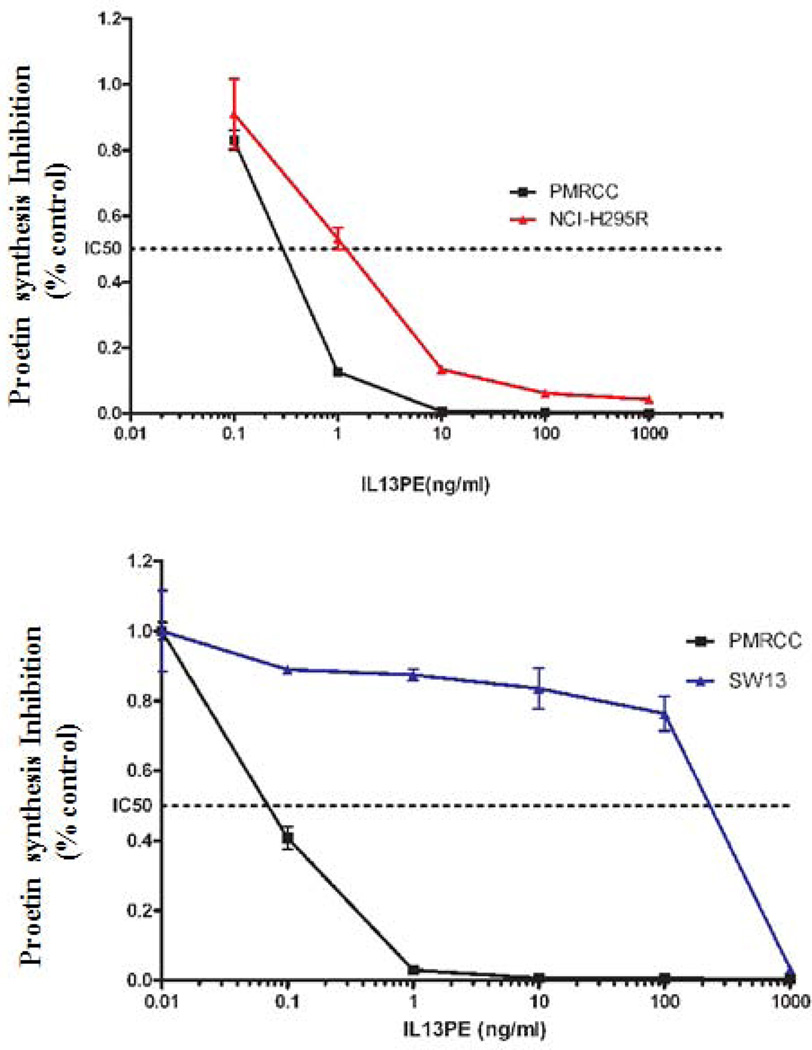
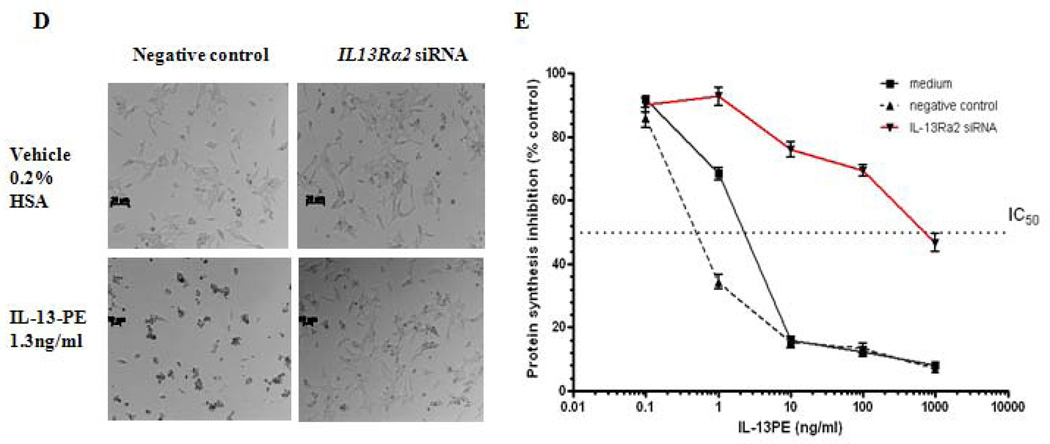
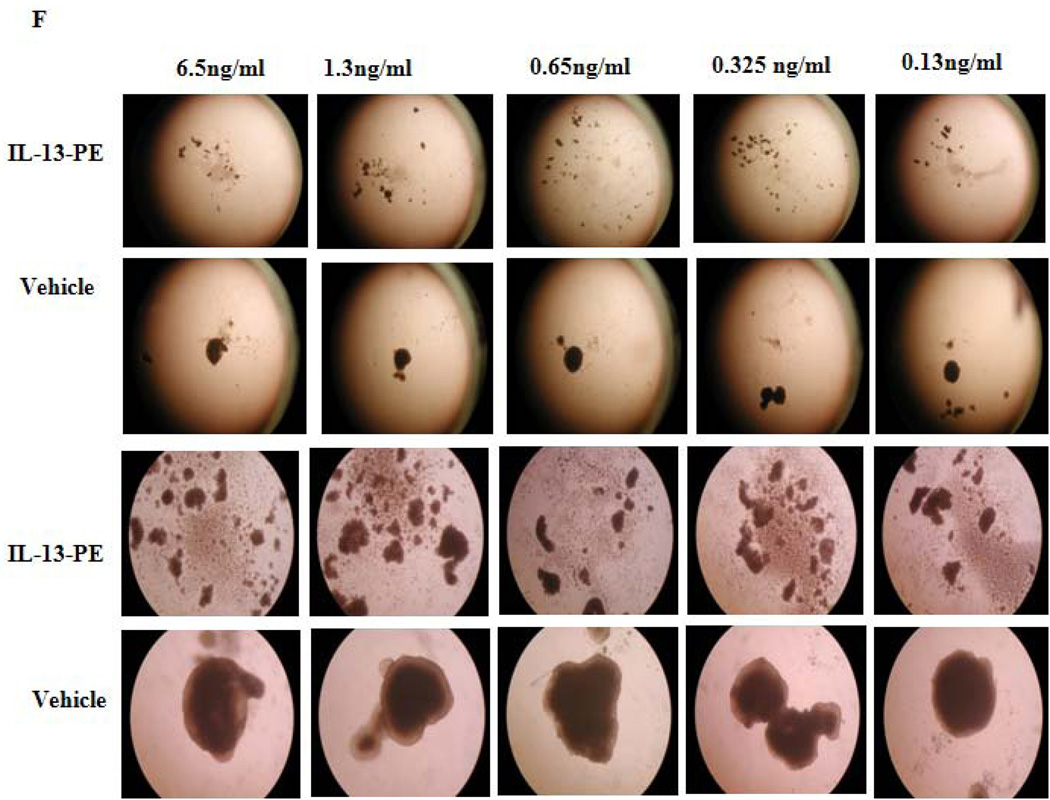
IL13Rα2 positive H295R cells are sensitive to IL-13-PE. A) IL13Rα2 mRNA expression in ACC cell lines (H295R and SW13). Y axis represents % IL13Rα2 mRNA expression relative to GAPDH. Protein synthesis inhibition assay was done to assess the cytotoxicity of IL-13-PE to H295R (B) and SW13 (C) cells. PM-RCC cells (renal carcinoma cell line) were used as positive control. Mean ± SD of quadruplicate determination. D) IL-13-PE was administered at concentration of 1.3 ng/ml to cells with IL13Rα2 knockdown and negative control. Upper panel represents negative control and siRNA knockdown cells treated with vehicle (0.2% HSA) and lower panel represents the cells treated with IL-13-PE. All images are at 10X magnification and representative of two experiments done in duplicates. E) Protein synthesis inhibition assay was done to assess the cytotoxicity of IL-13-PE to H295R transfected cells with IL13Rα2 siRNA and negative control used at 80 nM concentration. F) Effect of IL-13-PE in H295R spheroids. Spheroids were treated with IL-13-PE and vehicle at different concentrations of 0.13 ng/ml to 6.5 ng/ml. Upper panel represents IL-13PE treatment at 12.5X magnification and lower panel represents vehicle treatment at 50X magnification.


