

Abstract
Purpose
To demonstrate the feasibility of PC-VIPR (Phase Contrast Vastly undersampled Imaging with Projection Reconstruction) for the depiction and hemodynamic analysis of hepatic and splanchnic vessels in patients with portal hypertension.
Methods & Materials
24 cirrhotic patients (55.9±10.4years) were scanned using 5-point PC-VIPR for high spatial resolution imaging with large volume coverage at 3T using a 32-channel body coil. Vessel segmentation and hemodynamic visualization included color-coded 3D streamlines and particle traces. Segmentation quality was compared to contrast-enhanced multi-phase liver imaging. Flow pattern analysis was performed in consensus of 3 readers. The MELD score was calculated to estimate disease severity and was correlated to image quality.
Results
Good to excellent visualization quality was achieved in 23/24 cases. All arterial vessels and 144/168 vessels of the portal venous (PV) circulation were unambiguously identified. No correlation with the MELD score was found. 8/148 vessels of the PV circulation demonstrated reverse (hepatofugal) flow. Hepatofugal flow small tributaries to PV flow were present in three cases despite hepatopetal flow in the PV.
Conclusion
This feasibility study demonstrates the feasibility of PC-VIPR for simultaneous morphological and hemodynamic assessment of the hepatic and splanchnic vasculature in cirrhosis and portal hypertension. Future studies with quantitative analyses are warranted.
Keywords: Hemodynamics, portal hypertension, phase contrast imaging, velocity mapping, flow-sensitive MRI, liver disease
INTRODUCTION
Liver injury from a variety of diseases, including viral hepatitis, alcoholic cirrhosis, and fatty liver disease, among others, can progress to liver fibrosis and eventually cirrhosis (end-stage fibrosis). During the development of cirrhosis, portal sinusoidal resistance increases dramatically leading to portal hypertension, one of the major complications of cirrhosis and chronic liver disease in general (1-2). As the pressure gradient between the portal venous and systemic venous system increases, patients are at risk of developing portosystemic collaterals, ascites, and splenomegaly. During the course of the disease, rising pressure differences lead to an increased risk of hepatic encephalopathy, hepatorenal syndrome, and the dreaded complication of acute variceal rupture. Unfortunately, once collaterals have developed, increased levels of circulating endogenous vasodilators that result from the underlying liver disease, can lead to further increases in portal venous flow, exacerbating the risk of variceal rupture and other complications (3).
Definitive evaluation of portal hypertension is currently performed through measurement of the portosystemic pressure gradient, mostly commonly using the wedged hepatic venous pressure (WHVP). This invasive procedure requires insertion of a catheter into the right internal jugular vein, through the right atrium and into a hepatic vein where a pressure sensor distal to an inflated balloon measures portal sinusoidal pressure. While the WHVP is an important measure of the severity of portal hypertension, it does not directly assess blood flow to the liver.
There is a great need for non-invasive assessment of the hemodynamics of portal hypertension. In addition, the portosystemic pressure gradient, which is a very important measurement to assess portal hypertension, provides an incomplete assessment of the hemodynamics of the liver. Since the pressure is related to both the blood flow and sinusoidal resistance, measurement of flow within the hepatic and splanchnic vasculature may prove helpful as an additional surrogate marker of portal hypertension.
Unfortunately, the hepatic and splanchnic vasculature is challenging to assess. Doppler ultrasound is the most widely used approach, but is very limited due to limited acoustic windows from the overlying gas-filled stomach and duodenum, and the ability to visualize the complex and variable anatomy over a wide region of coverage. Despite good correlation between ultrasound and 2D phase contrast MR velocity mapping for measurement of blood flow direction and velocities in the portal vein (4-5), ultrasound cannot measure flow and suffers from considerable intraobserver variability (6). These challenges are further compounded by the dual blood supply to the liver, with highly variable hepatic arterial anatomy, as well as major alterations in anatomy with the development of large portosystemic collaterals in portal hypertension.
4D magnetic resonance velocity mapping offers the unique combination of perfectly co-registered anatomic and hemodynamic visualization from a single examination, providing cardiac gated, volumetric velocity fields. Initial results on the hemodynamic analysis of the portal vein presented by Stankovic et al. using a Cartesian 4D velocity mapping approaching are highly promising (7). However, the coverage provided by the Cartesian approach does not cover the extent of the vasculature needed and is insufficient for evaluation of, e.g., the small hepatic arteries.
It has been shown that radial undersampling (8) can be exploited for rapid 2D (9) and 3D phase contrast MRI with PC-VIPR (Phase Contrast Vastly undersampled Isotropic Projection Reconstruction), to provide large volume coverage with high spatial resolution, in reasonable scan times (10). Although the undersampled acquisition introduces streak artifacts, it has been shown that these artifacts are mitigated due to the inherent sparsity of the angiographic data, the subtraction of signal from stationary background (8), and from the PILS effect (Parallel Imaging with Localized Sensitivities) from the smaller regions of coil sensitivity in phased array coils with large numbers of elements (11). This combination of factors has made PC-VIPR a promising method for hemodynamic evaluation of the entire arterial and venous system of the liver. The wide range of velocities that are expected between the portal vein, hepatic arteries and portosystemic collaterals is another challenge for imaging the liver with 4D PC MR. A recently described 5-point velocity encoding scheme with an improved velocity sensitivity spectrum may be well suited to address the challenges in imaging of liver hemodynamics, especially in the presence of liver disease and portal hypertension (12).
Therefore, the purpose of this study was to assess the feasibility of using 4D magnetic resonance velocity mapping with PC-VIPR for the assessment of liver hemodynamics in patients with portal hypertension. To achieve this goal we sought i) to analyze the hemodynamics with respect to visualization quality and directionality, ii) to relate the image quality to the severity of the disease as expressed by the survival rate following the MELD score [Models for End-stage Liver Disease (13)], and iii) to underline the potential clinical impact by presentation of case examples. For confirmation, we iv) further compared the vessel segmentation quality of PC VIPR with contrast-enhanced liver imaging.
METHODS AND MATERIALS
Human Subjects
24 subjects (55.9±10.4years, 88.4±16.7kg; 15 male, 9 female) were included in this HIPAA-compliant and IRB-approved study. Subjects with a clinical history of cirrhosis and/or portal hypertension who were referred for abdominal MRI or who were identified to have cirrhosis on the basis of prior MRI were included (14). Written informed consent was obtained from all participants prior to inclusion. To assess disease severity, the MELD score was calculated for each patient using the following equation: MELD = 3.8*loge(bilirubin [mg/dL]) + 11.2*loge(INR) + 9.6*loge(creatinine [mg/dL]) + 6.4*(etiology: 0 if cholestatic or alcoholic, 1 otherwise)(13). In 19 patients, blood works determined within the last 6 month were available and allowed to calculate the MELD score.
MR Imaging
MR acquisitions were performed on a 3T clinical scanner (Discovery MR 750, GE Healthcare, Waukesha, WI) using a phased-array 32-channel body coil (NeoCoil, Pewaukee, WI). A balanced 5-point velocity encoded PC-VIPR sequence for time-efficient large volume coverage with high spatial and temporal resolution and increased velocity encoding sensitivity was used (10,12,15). Imaging parameters for PC-VIPR included: dual echo acquisition, imaging volume=32cm × 32 cm × 32 cm, axial slab excitation, acquired spatial resolution = isotropic 1.4 mm, TR/TE=6.1-7.8/2.1-3.2ms (first echo), flip angle=8-20°, and Venc =60cm/s. An adaptive respiratory gating scheme using respiratory bellows and a 50% acceptance window resulted in scan times of approximately 10-12min depending on the respiratory rate of the subject. Retrospective ECG gating with temporal filtering similar to view sharing in Cartesian acquisitions was used (16). To restrict data volumes, data were reconstructed to 14 time frames per RR cycle. Automatic correction for Maxwell terms and eddy currents is included in the image acquisition and post-processing scheme.
In 21 subjects, contrast-enhanced dynamic T1-weighted 3D-SPGR with intermittent fat saturation (LAVA) of the liver was available for comparison. Per clinical standard, 0.1mmol/kg gadobenate dimeglumine (Bracco Diagnostics, Princeton, NJ) was injected at a flow rate of 2ml/s via a 20G antecubital i.v. line. Imaging during the late arterial, portal venous, and delayed (systemic venous) phase was achieved by using a fluoroscopic trigger placed in the abdominal aorta. Typical imaging parameters varied according to individual variations and were: TR/TE = 4.4/2.1 ms, axial slab excitation, acquisition matrix = 320 × 224, FOV = 350-380 × 350-380 mm, flip angle=15°, and bandwidth ±62.5kHz. Typically, 80 slices with a slice thickness of 3.2mm were recorded and interpolated to 156 slices with 1.6mm slice thickness (outer 4 slices were discarded). Parallel imaging using ARC [Autocalibrating Reconstruction for Cartesian imaging (17)] with effective acceleration factors of approximately 3.5-3.6 was applied to allow for a breath-hold duration of approximately 20-22sec. Three patients did not receive contrast agents due to a) compromised renal function or b) lack of consent in the administration of contrast agent. They were not excluded from the study because hemodynamic analyses were feasible nevertheless.
Data Processing and Evaluation
Post-Processing of the PC VIPR data included the reconstruction of velocity-weighted angiograms, vessel segmentation of the vasculature on basis of these angiograms (MIMICS, Materialise, Ann Arbor, MI) and blood flow visualization (EnSight, CEI Inc., Apex, NC) with time-resolved 3D particle traces and 3D streamlines. To facilitate a timely visualization for potential clinical purposes, a whole-volume particle trace emission restricted to the segmented vascular system of origin was generated. Particle traces were color-coded with respect to the vascular system (portal venous = yellow, arterial = red, venous = blue). For more detailed visualization of blood flow in selected case examples, double-oblique emitter planes were manually placed in the vessels of interest. The planes served as emitter regions for time-resolved particle traces and 3D streamlines, both color-coded to the absolute acquired velocities. In selected clinical cases, arrow heads were used at the end of the particle trace to depict the directionality of blood flow in static images. Data processing including data transfer to a dedicated post-processing workstation based on a dual-core personal computer, data conversion for visualization, and visualization in MIMICS and EnSight, was on the order of 120-150min.
The segmentation quality was rated in a consensus reading of 3 experienced readers on a 0-2 scale (0=poor image quality, 1=good image quality, 2=very good image quality) and compared to image findings on clinical contrast enhanced T1w images. The following 13 vessels were assessed: the portal vein (PV) and both main branches (ltPV, rtPV), splenic vein (splenV), superior mesenteric vein (SMV), inferior mesenteric vein (IMV), coronary vein (corV), abdominal aorta (AO), left and right renal artery (LRA, RRA), hepatic artery (HA) with both main left and right branch (LRA, RHA), and portosystemic collaterals. The qualitative hemodynamic analysis was performed with respect to the flow visualization quality and the directionality of blood flow in the vessels of the portal venous system (PV, rtPV, ltPV, splenV, SMV, IMV, CorV).
For statistical analysis, ratios are given for frequency of findings and image quality ratings. The association of image quality with severity of the disease was performed with Fisher’s exact test dividing patients into those with a MELD score less than or greater than 9.
RESULTS
Image Quality
5-point PC-VIPR and subsequent visualization was successfully performed in all 24 participants. The segmentation quality was rated very good in 12 cases, good in 11 cases, and poor in 1 case. Figure 1 shows a typical segmentation of the upper abdominal vasculature in a 59yo man, demonstrating large volumetric coverage and inclusion of segmental vessels. Fig. 1B-D demonstrates the segmentation of portal venous, arterial, and systemic venous vasculature with whole volume particle traces visualization.
Figure 1.
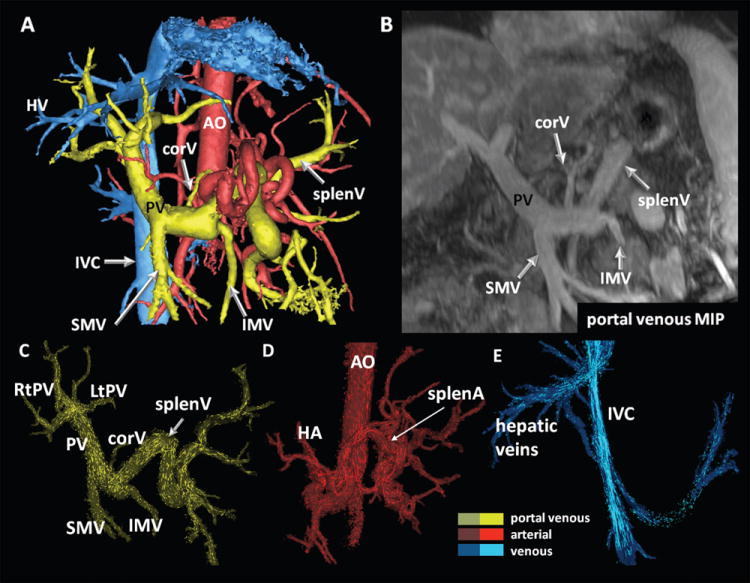
Segmentation results (A) and segmental hemodynamic visualization using 3D particle traces on basis of previous vessel segmentation (C-E) in a 59 year-old patient with cryptogenic cirrhosis and multiple regenerative nodules. In (B), a MIP representation of the portal venous phase analyzed in standard axial views is displayed for comparison. (A) shows the large volume coverage and details that can be acquired with 5-point PC-VIPR. Data is displayed during systole. Particle trace emission was performed from the entire volume previously segmented thus eliminating the need to place multiple planes for emission of tracers. Color coding was performed with respect to vascular systems: yellow = portal venous, blue = venous, red = arterial. PV = portal vein; SMV, IMV = superior and inferior mesenteric vein; splenV = splenic vein; corV = coronary vein; HA = hepatic artery; splenA = splenic artery; AO – abdominal aorta; IVC = inferior vena cava.
All arterial vessels under investigation were identified on both PC-VIPR and contrast-enhanced T1w images. Of note, true or accessory left hepatic arteries were present in 25% of cases and depicted with both modalities (see Figure 2). Table 1 summarizes visualization findings of the portal venous system. As shown in this table, 146 of a total of 168 evaluated vessel segments of the portal venous circulation (24 patients, PV, rtPV, ltPV, splenV, SMV, IMV, corV), were unambiguously identified. Difficulties were based on the limited identification of the corV and IMV only. The corV was correctly identified on PC-VIPR segmentations in 11/21 cases; in 9 cases it was not identifiable; in 1 case, the corV was identified on the PC-VIPR image only. Similarly, the IMV was identified in 18/21 cases on PC-VIPR images; it was not identified in 3 cases. Fisher’s exact test demonstrated no association between the MELD score and the ability to identify corV or IMV on PC-VIPR images (p>0.05 for both). Additionally, portosystemic collaterals were identified in 10 cases by PC-VIPR and were confirmed on contrast enhanced LAVA images.
Figure 2.
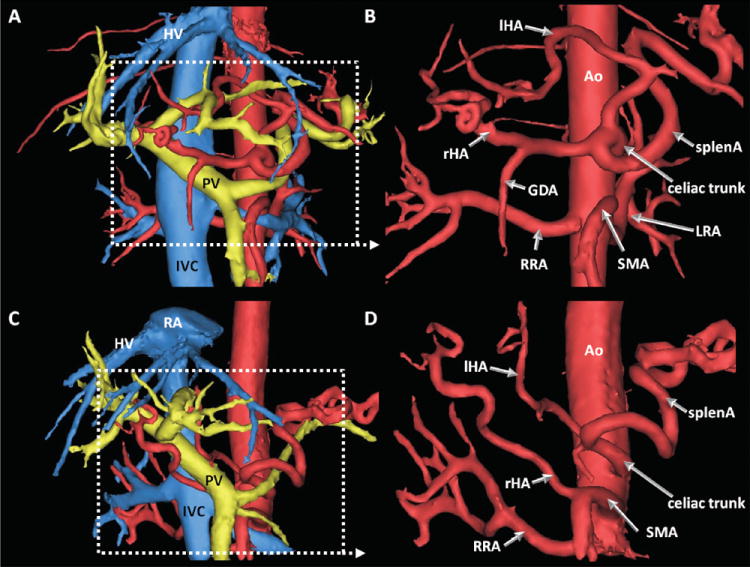
Complete segmentation (left) and arterial segmentation only (right) of data with variants of the hepatic arterial system. Arterial segmentation seen from 15° RAO. With its volumetric coverage, PC VIPR allowed identification of true left (A, B) and variant hepatic arteries (C, D). In A and B, a 49yo male patient with HCC and chronic cirrhosis showed a left hepatic artery (lHA) originating from the celiac trunk. C and D are images from a 42yo female patient who presented with unclear hepatic masses. In her, the right hepatic artery (rHA) branches off the superior mesenteric artery (SMA) while the left (lHA) is originating from the celiac trunk. RA = right atrium, HV = hepatic vein, PV = portal vein, ICV = inferior vena cava, RRA = right renal artery, LRA = left renal artery, GDA = gastroduodenal artery, Ao = aorta.
Table 1.
Segmentation results and hemodynamic findings in the portal venous system in24 patients undergoing 5-point PC-VIPR of the upper abdomen.
| Patients [n] Vessel | visualized | hepatopetal flow | hepatofugal flow | not visualized |
|---|---|---|---|---|
| PV | 24 | 23 | 1 | 0 |
| rtPV | 22 | 21 | 1 | 2 |
| ltPV | 22 | 21 | 1 | 2 |
| splenV | 23 | 20 | 3 | 1 |
| SMV | 24 | 24 | 0 | 0 |
| IMV | 21 | 20 | 1 | 3 |
| corV | 10 | 7 | 3 | 14 |
|
| ||||
| total | 146 | 136 | 10 | 22 |
PV = portal vein; ltPV, rtPV = left and right portal vein; splenV = splenic vein; SMV, IMV = superior and inferior mesenteric vein; corV = coronary vein
Hemodynamic Visualization
Hemodynamic visualization for directionality was evaluated on basis of the previously segmented vascular territories. This allowed for a territory by territory (i.e., portal venous, venous, arterial) analysis of flows in all patients with limited user interaction as demonstrated in Figure 1 C-D. This avoided the need to place multiple planes to emit particle traces from as previously performed in (7). In 148 successfully visualized vessel segments, ten segments in four patients showed hepatofugal flow (see Table 1).
Interestingly, only one of the patients (MELD score = 8) showed hepatofugal flow in the main portal vein. In three patients (MELD scores 8, 10, and 16, respectively), hepatofugal flow was detected in tributaries of the portal venous circulation, even though the portal vein itself had hepatopetal flow.
Case Examples
Selected case examples are shown in figures 3-6. In figure 3, findings in a 59-old man (the same patient as shown in Figure 1 to demonstrate the entire extent of visualization) with cryptogenic cirrhosis (MELD score = 8) are displayed. Although the major vessels of interest show normal hepatopetal flow with a helical configuration [similar to results previously described by Stankovic et al. (7)], 5-point PC VIPR was able to detect hepatofugal flow in the coronary vein and inferior mesenteric vein (18). We interpret these findings as an early shunting pattern that decompresses the portal system before frank hepatofugal flow in the portal vein is demonstrated.
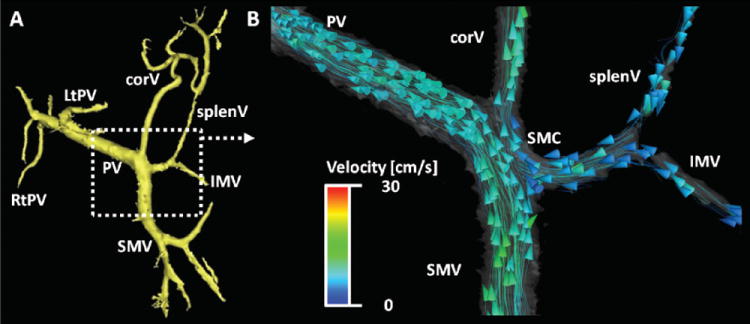
Figure 3.
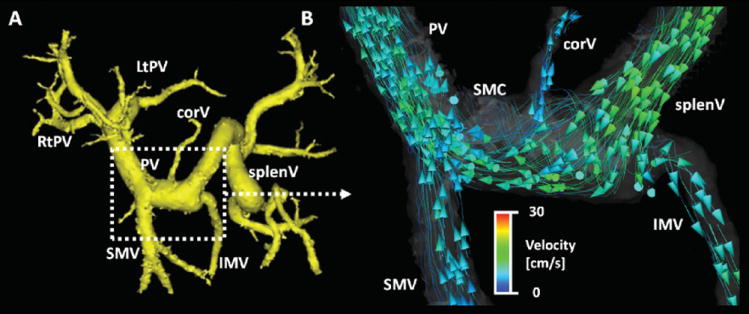
59 year-old man with cirrhosis (MELD score = 8) and portal hypertension (same patient as in Figure 1). After segmentation of the portal venous system (A, yellow), the detailed blood flow analysis using particle traces in (B) shows hepatopetal flow in the portal vein (PV) and its main contributing branches splenic vein (splenV) and superior mesenteric vein (SMV). It is of special note, however, that due to his mild portal hypertension there is hepatofugal flow in the coronary vein (corV) and inferior mesenteric vein (IMV) only. This observation emphasizes the advantage of using 5-point PC VIPR which captures a large volume of interest and is not limited by, e.g., insonation angles or windows due to bowel gas. In B), curved streamlines with arrowheads indicating their direction have been used to better depict the finding. This visualization approach was not part of the study. The study data of this patient in displayed in Figure 1 and 2. Color-coding in (B) is performed with respect to the absolute acquired velocities. SMC = spleno-mesenteric confluence.
Figure 6.
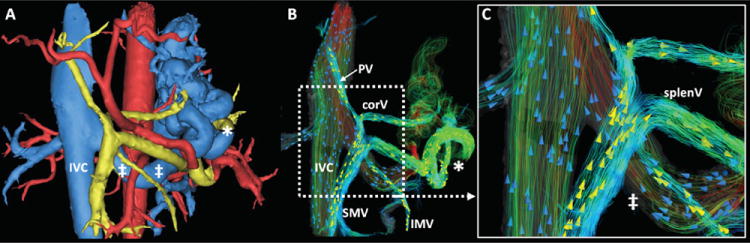
59 year-old patient with alcoholic cirrhosis and hepatitis C, MELD score 10. Both MIMICS segmentation (A) and flow visualization with EnSight (B, C) show very large portosystemic collaterals. The full extent of flow to the shunt vessels (*) and return via the enlarged left renal vein (‡) can be appreciated in detail. B and C used 3D streamlines color-coded to the absolute measured velocity. Arrowheads were added in a random distribution to depict directionality (yellow arrowheads, portal venous streamlines; blue arrowheads, [systemic] venous streamlines). MIMICS segmentation (A): yellow: portal venous vasculature & contributing vessels; blue: systemic venous vasculature; red: arterial supply.
Figure 4 depicts images from a 70 year-old woman (MELD score = 8). She had previously undergone radiofrequency ablation of a singular hepatocellular carcinoma nodule in the presence of liver cirrhosis. The reason for referral to MR was a rising alpha-Fetoprotein (AFP). The hemodynamic analysis revealed normal hepatopetal flow in the portal vein. Upon closer inspection, however, hepatofugal flow was noted in the coronary vein. Interestingly, visualization with particle traces suggested that the majority of flow from the SMV drained into the portal vein, while flow from the IMV and splenic vein was diverted primarily into the coronary vein. This may be important for predicting levels of hepatic encephalopathy.
Figure 4.
70 year-old female with known cirrhotic liver disease (MELD score = 8). After segmentation of 5-point PC VIPR flow data in MIMICS (A), flow dynamics visualized in EnSIght (CEI, Apex, NC) can be appreciated in B. Interestingly, most vessels show hepatopetal flow (PV, SMV, splenV, and IMV). Only the flow in the coronary vein (corV) was shown to be hepatofugal. Of note is the contribution of flows on the basis of the flow field: The flow is predominantly from the SMV into the PV, while splenic and inferior mesenteric vein flows (splenV and IMV, respectively) are channeled primarily into the coronary vein. Flow traces suggest that there is only minimal mixing. This may be important for predicting levels of hepatic encephalopathy. Color-coding in (B) is performed with respect to the absolute acquired velocities.
Figure 5 shows a case with a higher MELD score (19), with overt hepatofugal flow that can be appreciated in portal vein and splenic vein. This patient is a 23 year-old woman, who had a Kasai porto-jejunostomy with Roux-en-Y anastomosis performed during infancy to correct an obstructive Type-A choledochal cyst. Further, large portosystemic collaterals including a splenorenal shunt are easily identified.
Figure 5.
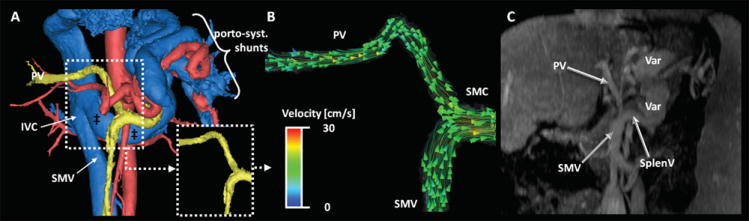
23 year-old woman with secondary (biliary) cirrhosis after obstructive Type A choledochal cyst. A Kasai porto-enterostomy with Roux-en-Y anastomosis was performed during infancy (24). The patient presented with rising bilirubin and a MELD score of 19. In A) the segmentation using MIMICS shows the portal venous system (yellow) with large porto-systemic shunts via the spleno-renal pathway. Note the markedly enlarged left renal vein (‡) draining in the IVC at the level of the white arrow. Hemodynamic visualization shows the hepatofugal flow in the portal venous system. Color-coding in (B) is performed with respect to the absolute acquired velocities. (C) is a MIP depiction of the portal venous phase LAVA sequence. Note that the comparative analysis was not performed on MIP reformats but standard axial views. PV = portal vein, SMV = superior mesenteric vein, SMC – spleno-mesenteric confluence.
Such splenorenal collaterals can also be appreciated in Figure 6, which shows images from another 59 year-old man with alcoholic liver cirrhosis and hepatitis C (MELD score 10). Enormous splenorenal collaterals are shown, creating a large portosystemic shunt that drains flow from splenic vein into the left renal vein and subsequently into the IVC. Note also, the diminutive portal vein (although with hepatopetal flow), as well as the hepatofugal flow in splenic and coronary vein partially draining the mesenteric veins and contributing to the shunt flow.
DISCUSSION
In this work we have demonstrated the feasibility of performing comprehensive anatomic and hemodynamic visualization of hepatic and splanchnic blood flow with a single free-breathing acquisition. Using undersampled radial imaging at 3T with a 32 channel coil, temporally resolved, volumetric velocity mapping of the entire abdomen could be performed with very high spatial resolution in 10-12minutes. In addition to identification of important arteries and veins, the direction of blood flow was easily determined, demonstrating the feasibility of qualitative hemodynamic assessment. Furthermore, we have demonstrated the potential utility of these hemodynamic patterns and large volume imaging in selected case examples in patients with portal hypertension.
This approach combines the advantages of Doppler ultrasound to detect and characterize blood flow with the large volumetric 3D coverage of cross-sectional imaging. By doing so, it may help to overcome known limitations of ultrasound including operator dependence, limited acoustic windows, visualization of complex anatomy, and limited inter-reader reproducibility (6,19). Further, while Doppler ultrasound provides velocity measurements, it is limited in its ability to measure true flow through a vessel (20). By measuring the velocity vector field with large volumetric coverage, 4D flow methods can provide true flow measurements in any vessel included in the volume. Also, volumetric velocity mapping with 4D flow methods avoid the need to acquire numerous double oblique planes needed for 2D phase contrast methods. Volumetric velocity mapping is well suited for the liver and abdomen providing a paradigm where one comprehensive acquisition is followed by post-processing and flow measurements in specific vessels (7).
Large volume velocity mapping for comprehensive visualization of the hemodynamics in patients with liver disease offers several unique and interesting diagnostic opportunities. For example, after a meal challenge the increased flow that occurs in the postprandial state affects the entire hepatic and splanchnic vasculature. The portal venous hemodynamic response to meal has been shown to be indicative of the severity of cirrhosis and portal hypertension (21). In the presence of portosystemic shunts, this response may vary significantly (22) and such additional pathways should be assessed as well, preferably in the same examination.
Furthermore, the mechanisms underlying the hepatorenal syndrome, a rapidly fatal complication in uncompensated cirrhosis, may benefit from simultaneous assessment of the hepatic arterial, portal venous and renal arterial flow. Ming et al have shown the importance of portal flow in the feedback mechanism of flow reduction and accumulation of adenosine in the space of Mall as the trigger for renal fluid and sodium retention (23). A comprehensive hemodynamic assessment of both the liver and kidneys may have great potential for detection, staging, and prognosis of patients at risk for hepatorenal syndrome.
In addition, direct measurement of splanchnic flow could be used to perform treatment planning prior to interventions such as transjugular intrahepatic portosystemic shunt (TIPSS) placements, as well as treatment monitoring after TIPSS. Assessment of the response of drugs to reduce portal flow could also be performed using these methods. Finally, the flow and/or shunting pattern in a specific patient may provide important information that could alter treatment. For example, the relative shunting through the coronary vein and into esophageal varices, compared to shunting through other collaterals, may be an accurate marker to assess risk of variceal rupture. The shunting patterns seen in figure 4 (SMV flow primarily to liver and splenic vein flow primarily to coronary vein) may also have important implications for explaining whether a patient with portosystemic collaterals develops hepatic encephalopathy. Flow from the gut (SMV and IMV) contains toxic metabolites such as ammonia that are normally detoxified in the liver. A particular flow pattern could have great impact on the amount of toxic metabolites that bypasses the liver. Such patterns may be useful in predicting the response to and potential benefit from TIPPS, for example.
There were several limitations of this study. First, quantitative flow measurements were not included as part of this study because it was not feasible to collect an appropriate reference measurement (e.g., multiple oblique slices with 2D phase contrast MRI as an internal reference) as part of the clinical imaging protocol. In addition, the choice of the Venc setting is a balance between good signal-to-noise performance and avoidance of velocity phase aliasing. A Venc of 60cm/s, in combination with 5-point encoding, was chosen empirically and shown to provide excellent results with good noise performance. However, rigorous optimization to determine an appropriate Venc setting was not performed and could potentially improve performance further, and is a subject of current evaluation.
In lieu of a quantitative reference standard for flow, comparison of contrast enhanced T1 weighted 3D-spoiled gradient echo imaging (LAVA) was available to validate the ability of 5-point PC-VIPR to assess the identification of important vascular anatomy in these patients. This comparison demonstrated that PC-VIPR performs extremely well for depiction of large and mid-size vessels of the abdomen.
Like all 4D flow methods, post-processing of the velocity mapping is computationally demanding and requires relatively intense user-interaction. Manual segmentation, especially when based manual thresholding, is highly subjective and may be the reason that some of the small veins in this study were not identified (table 1). Future developments in comprehensive visualization software will likely lead to great improvements in workflow with more automated software and enhanced vessel segmentation may overcome these challenges.
Another shortcoming of this study was the manner in which patients were recruited and their disease severity was assessed. Portosystemic pressure gradients are not commonly performed in patients with cirrhosis because measurement of WHVP is invasive. As a surrogate marker of disease severity, the MELD score, a commonly used predictor of survival in patients with liver disease, was used. However, the MELD score may not necessarily reflect the severity of portal hypertension itself. Similarly, other clinically useful scales such as the Child-Pugh score do not directly reflect the severity of portal hypertension. Regardless, the data presented in this study demonstrates the feasibility of data acquisition, post-processing and assessment of anatomy and qualitative hemodynamic patterns in patients with portal hypertension.
In conclusion, 5-point PC VIPR of the hepatic and splanchnic vasculature is feasible in patients with portal hypertension. It provides a comprehensive, volumetric approach to assess morphology and hemodynamics of the liver with high spatial resolution in a reasonable scan time. Ongoing studies will focus on the ability of this method to accurately quantify flow in important vascular territories using appropriate reference standards such as ultrasound or 2D phase contrast MRI for comparison. Comparison in patients undergoing WHVP measurement, while more challenging, would also be of great interest. Despite the early stages of the development and validation 5-point PC VIPR holds great promise for the unique assessment of the hemodynamics of liver disease through comprehensive, volumetric velocity mapping in clinically feasibly scan times.
Acknowledgments
The authors gratefully acknowledge support from NIH (R01 DK083380, R01 DK088925, R01 HL072260 and RC1 EB010384), the Coulter Foundation, Bracco Diagnostics, and GE Healthcare.
Footnotes
Financial disclosures:
The Departments of Radiology and Medical Physics receive support by GE Healthcare. A.F. has received an educational stipend from Bracco Diagnostics.
References
- 1.McCullough AJ. Pathophysiology of nonalcoholic steatohepatitis. J Clin Gastroenterol. 2006;40(Suppl 1):S17–29. doi: 10.1097/01.mcg.0000168645.86658.22. [DOI] [PubMed] [Google Scholar]
- 2.Ratziu V, Bonyhay L, Di Martino V, et al. Survival, liver failure, and hepatocellular carcinoma in obesity-related cryptogenic cirrhosis. Hepatology. 2002;35(6):1485–1493. doi: 10.1053/jhep.2002.33324. [DOI] [PubMed] [Google Scholar]
- 3.Moreau R, Lebrec D. Molecular Mechanisms of Systemic Vasodilatation and Hyperdynamic Circulatory State of Cirrhosis. In: Sanyal AJ, Shah VH, editors. Portal Hypertension: Pathobiology, Evaluation, and Treatment, Clinical Gastroenterology. Totowa, NJ: Humana Press; 2005. [Google Scholar]
- 4.Applegate GR, Thaete FL, Meyers SP, et al. Blood flow in the portal vein: velocity quantitation with phase-contrast MR angiography. Radiology. 1993;187(1):253–256. doi: 10.1148/radiology.187.1.8451423. [DOI] [PubMed] [Google Scholar]
- 5.Burkart DJ, Johnson CD, Morton MJ, Wolf RL, Ehman RL. Volumetric flow rates in the portal venous system: measurement with cine phase-contrast MR imaging. AJR Am J Roentgenol. 1993;160(5):1113–1118. doi: 10.2214/ajr.160.5.8470589. [DOI] [PubMed] [Google Scholar]
- 6.de Vries PJ, van Hattum J, Hoekstra JB, de Hooge P. Duplex Doppler measurements of portal venous flow in normal subjects. Inter- and intra-observer variability. J Hepatol. 1991;13(3):358–363. doi: 10.1016/0168-8278(91)90081-l. [DOI] [PubMed] [Google Scholar]
- 7.Stankovic Z, Frydrychowicz A, Csatari Z, et al. MR-based visualization and quantification of three-dimensional flow characteristics in the portal venous system. J Magn Reson Imaging. 2010;32(2):466–475. doi: 10.1002/jmri.22248. [DOI] [PubMed] [Google Scholar]
- 8.Peters DC, Korosec FR, Grist TM, et al. Undersampled projection reconstruction applied to MR angiography. Magn Reson Med. 2000;43(1):91–101. doi: 10.1002/(sici)1522-2594(200001)43:1<91::aid-mrm11>3.0.co;2-4. [DOI] [PubMed] [Google Scholar]
- 9.Barger AV, Peters DC, Block WF, et al. Phase-contrast with interleaved undersampled projections. Magn Reson Med. 2000;43(4):503–509. doi: 10.1002/(sici)1522-2594(200004)43:4<503::aid-mrm3>3.0.co;2-0. [DOI] [PubMed] [Google Scholar]
- 10.Gu T, Korosec FR, Block WF, et al. PC VIPR: a high-speed 3D phase-contrast method for flow quantification and high-resolution angiography. AJNR Am J Neuroradiol. 2005;26(4):743–749. [PMC free article] [PubMed] [Google Scholar]
- 11.Griswold MA, Jakob PM, Nittka M, Goldfarb JW, Haase A. Partially parallel imaging with localized sensitivities (PILS) Magn Reson Med. 2000;44(4):602–609. doi: 10.1002/1522-2594(200010)44:4<602::aid-mrm14>3.0.co;2-5. [DOI] [PubMed] [Google Scholar]
- 12.Johnson KM, Markl M. Improved SNR in phase contrast velocimetry with five-point balanced flow encoding. Magn Reson Med. 2010;63(2):349–355. doi: 10.1002/mrm.22202. [DOI] [PMC free article] [PubMed] [Google Scholar]
- 13.Kamath PS, Wiesner RH, Malinchoc M, et al. A model to predict survival in patients with end-stage liver disease. Hepatology. 2001;33(2):464–470. doi: 10.1053/jhep.2001.22172. [DOI] [PubMed] [Google Scholar]
- 14.Faria SC, Ganesan K, Mwangi I, et al. MR imaging of liver fibrosis: current state of the art. Radiographics. 2009;29(6):1615–1635. doi: 10.1148/rg.296095512. [DOI] [PMC free article] [PubMed] [Google Scholar]
- 15.Johnson KM, Lum DP, Turski PA, Block WF, Mistretta CA, Wieben O. Improved 3D phase contrast MRI with off-resonance corrected dual echo VIPR. Magn Reson Med. 2008;60(6):1329–1336. doi: 10.1002/mrm.21763. [DOI] [PMC free article] [PubMed] [Google Scholar]
- 16.Liu J, Redmond MJ, Brodsky EK, et al. Generation and visualization of four-dimensional MR angiography data using an undersampled 3-D projection trajectory. IEEE Trans Med Imaging. 2006;25(2):148–157. doi: 10.1109/TMI.2005.861706. [DOI] [PubMed] [Google Scholar]
- 17.Brau AC, Beatty PJ, Skare S, Bammer R. Comparison of reconstruction accuracy and efficiency among autocalibrating data-driven parallel imaging methods. Magn Reson Med. 2008;59(2):382–395. doi: 10.1002/mrm.21481. [DOI] [PMC free article] [PubMed] [Google Scholar]
- 18.Wachsberg RH. Inferior mesenteric vein: gray-scale and Doppler sonographic findings in normal subjects and in patients with portal hypertension. AJR Am J Roentgenol. 2005;184(2):481–486. doi: 10.2214/ajr.184.2.01840481. [DOI] [PubMed] [Google Scholar]
- 19.Sabba C, Weltin GG, Cicchetti DV, et al. Observer variability in echo-Doppler measurements of portal flow in cirrhotic patients and normal volunteers. Gastroenterology. 1990;98(6):1603–1611. doi: 10.1016/0016-5085(90)91097-p. [DOI] [PubMed] [Google Scholar]
- 20.Chow PK, Yu WK, Soo KC, Chan ST. The measurement of liver blood flow: a review of experimental and clinical methods. J Surg Res. 2003;112(1):1–11. doi: 10.1016/s0022-4804(03)00127-6. [DOI] [PubMed] [Google Scholar]
- 21.Ludwig D, Schwarting K, Korbel CM, Bruning A, Schiefer B, Stange EF. The postprandial portal flow is related to the severity of portal hypertension and liver cirrhosis. J Hepatol. 1998;28(4):631–638. doi: 10.1016/s0168-8278(98)80287-0. [DOI] [PubMed] [Google Scholar]
- 22.Siringo S, Piscaglia F, Zironi G, et al. Influence of esophageal varices and spontaneous portal-systemic shunts on postprandial splanchnic hemodynamics. Am J Gastroenterol. 2001;96(2):550–556. doi: 10.1111/j.1572-0241.2001.03558.x. [DOI] [PubMed] [Google Scholar]
- 23.Ming Z, Smyth DD, Lautt WW. Decreases in portal flow trigger a hepatorenal reflex to inhibit renal sodium and water excretion in rats: role of adenosine. Hepatology. 2002;35(1):167–175. doi: 10.1053/jhep.2002.30425. [DOI] [PubMed] [Google Scholar]
- 24.Hartley JL, Davenport M, Kelly DA. Biliary atresia. Lancet. 2009;374(9702):1704–1713. doi: 10.1016/S0140-6736(09)60946-6. [DOI] [PubMed] [Google Scholar]